Cities with the Highest Percentage of Population Employed in Construction in Minnesota
RELATED REPORTS & OPTIONS
Construction
Minnesota
Compare Cities
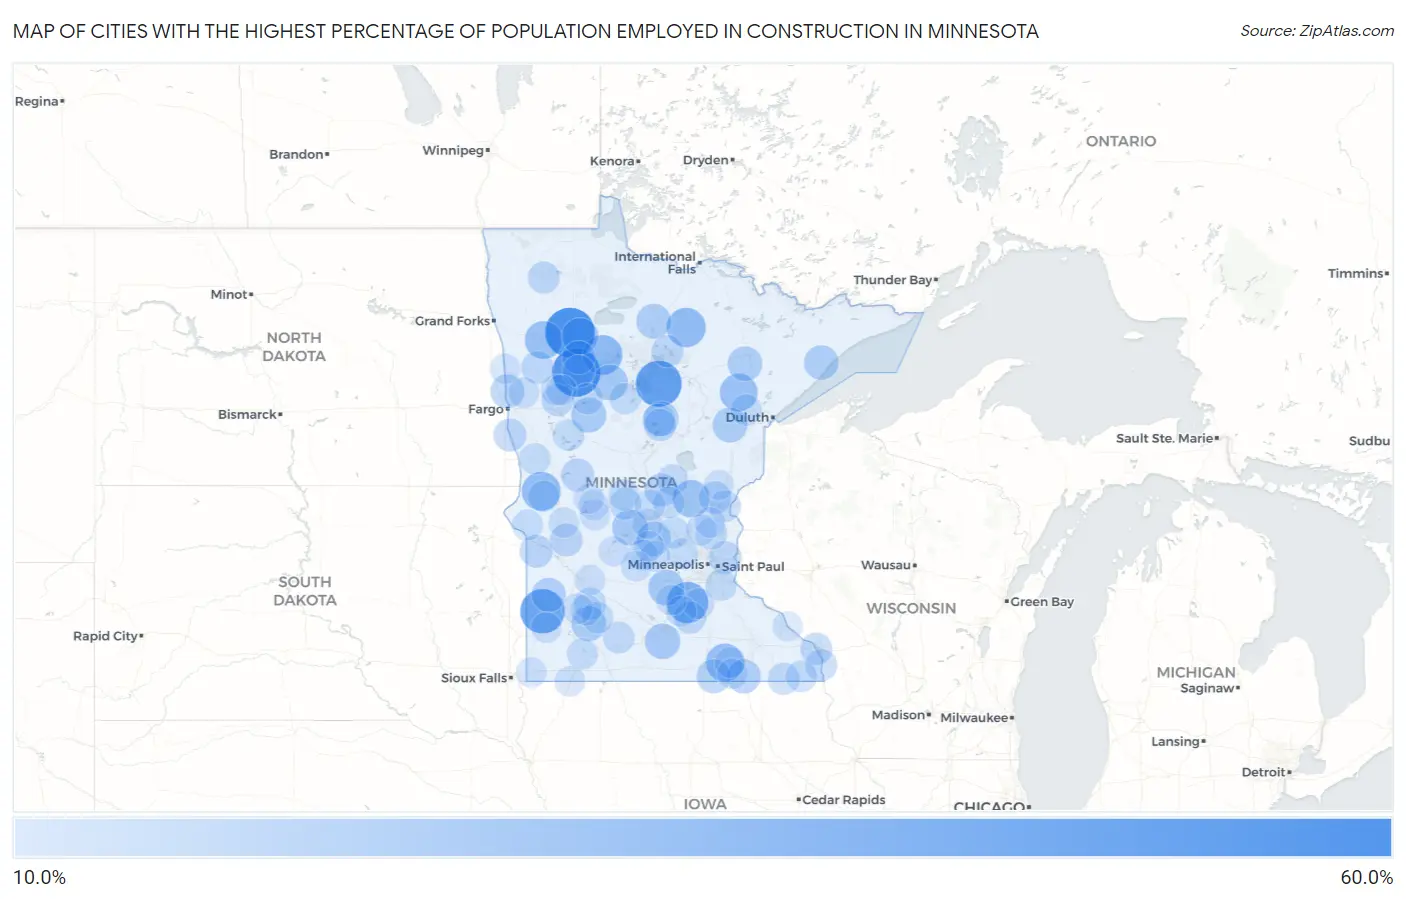
Map of Cities with the Highest Percentage of Population Employed in Construction in Minnesota
0.0%
60.0%
Cities with the Highest Percentage of Population Employed in Construction in Minnesota
| City | % Employed | vs State | vs National | |
| 1. | Trail | 58.3% | 6.2%(+52.1)#1 | 6.9%(+51.5)#142 |
| 2. | West Roy Lake | 55.6% | 6.2%(+49.3)#2 | 6.9%(+48.7)#168 |
| 3. | Boy River | 50.0% | 6.2%(+43.8)#3 | 6.9%(+43.1)#230 |
| 4. | Arco | 46.7% | 6.2%(+40.4)#4 | 6.9%(+39.8)#251 |
| 5. | Heidelberg | 39.6% | 6.2%(+33.4)#5 | 6.9%(+32.7)#369 |
| 6. | Solway | 36.2% | 6.2%(+30.0)#6 | 6.9%(+29.3)#478 |
| 7. | Effie | 34.7% | 6.2%(+28.5)#7 | 6.9%(+27.8)#523 |
| 8. | Norcross | 34.0% | 6.2%(+27.8)#8 | 6.9%(+27.1)#550 |
| 9. | Lansing | 32.1% | 6.2%(+25.8)#9 | 6.9%(+25.2)#636 |
| 10. | Mentor | 31.8% | 6.2%(+25.6)#10 | 6.9%(+24.9)#647 |
| 11. | Meadowlands | 31.5% | 6.2%(+25.2)#11 | 6.9%(+24.6)#667 |
| 12. | Bock | 30.4% | 6.2%(+24.2)#12 | 6.9%(+23.6)#722 |
| 13. | Gonvick | 28.8% | 6.2%(+22.6)#13 | 6.9%(+21.9)#813 |
| 14. | Roscoe | 27.3% | 6.2%(+21.0)#14 | 6.9%(+20.4)#941 |
| 15. | Green Isle | 27.1% | 6.2%(+20.9)#15 | 6.9%(+20.3)#960 |
| 16. | Lake George | 26.9% | 6.2%(+20.7)#16 | 6.9%(+20.0)#980 |
| 17. | Good Thunder | 26.4% | 6.2%(+20.2)#17 | 6.9%(+19.5)#1,014 |
| 18. | Wolf Lake | 25.5% | 6.2%(+19.3)#18 | 6.9%(+18.7)#1,082 |
| 19. | Cromwell | 25.3% | 6.2%(+19.0)#19 | 6.9%(+18.4)#1,099 |
| 20. | Revere | 25.0% | 6.2%(+18.8)#20 | 6.9%(+18.1)#1,139 |
| 21. | Mizpah | 25.0% | 6.2%(+18.8)#21 | 6.9%(+18.1)#1,140 |
| 22. | Iron Junction | 24.4% | 6.2%(+18.2)#22 | 6.9%(+17.6)#1,184 |
| 23. | Fifty Lakes | 24.3% | 6.2%(+18.1)#23 | 6.9%(+17.4)#1,193 |
| 24. | Finland | 24.2% | 6.2%(+18.0)#24 | 6.9%(+17.4)#1,206 |
| 25. | Taunton | 23.7% | 6.2%(+17.4)#25 | 6.9%(+16.8)#1,288 |
| 26. | South Haven | 23.6% | 6.2%(+17.3)#26 | 6.9%(+16.7)#1,298 |
| 27. | Taopi | 23.3% | 6.2%(+17.1)#27 | 6.9%(+16.5)#1,342 |
| 28. | Georgetown | 23.1% | 6.2%(+16.8)#28 | 6.9%(+16.2)#1,379 |
| 29. | Myrtle | 23.1% | 6.2%(+16.8)#29 | 6.9%(+16.2)#1,382 |
| 30. | Hubbard | 22.2% | 6.2%(+16.0)#30 | 6.9%(+15.3)#1,520 |
| 31. | Ebro | 21.4% | 6.2%(+15.2)#31 | 6.9%(+14.6)#1,637 |
| 32. | Millerville | 21.0% | 6.2%(+14.7)#32 | 6.9%(+14.1)#1,705 |
| 33. | Buckman | 20.9% | 6.2%(+14.7)#33 | 6.9%(+14.0)#1,716 |
| 34. | Danvers | 20.5% | 6.2%(+14.3)#34 | 6.9%(+13.7)#1,785 |
| 35. | Wolverton | 20.5% | 6.2%(+14.3)#35 | 6.9%(+13.7)#1,786 |
| 36. | Bellingham | 20.5% | 6.2%(+14.3)#36 | 6.9%(+13.6)#1,791 |
| 37. | Willernie | 20.3% | 6.2%(+14.0)#37 | 6.9%(+13.4)#1,839 |
| 38. | Gary | 20.1% | 6.2%(+13.9)#38 | 6.9%(+13.3)#1,863 |
| 39. | Roy Lake | 20.0% | 6.2%(+13.8)#39 | 6.9%(+13.1)#1,901 |
| 40. | Manhattan Beach | 20.0% | 6.2%(+13.8)#40 | 6.9%(+13.1)#1,913 |
| 41. | Grasston | 19.6% | 6.2%(+13.4)#41 | 6.9%(+12.8)#1,988 |
| 42. | Crosslake | 19.6% | 6.2%(+13.3)#42 | 6.9%(+12.7)#1,997 |
| 43. | Kilkenny | 19.4% | 6.2%(+13.1)#43 | 6.9%(+12.5)#2,058 |
| 44. | Inger | 19.2% | 6.2%(+13.0)#44 | 6.9%(+12.4)#2,087 |
| 45. | Callaway | 19.0% | 6.2%(+12.8)#45 | 6.9%(+12.2)#2,125 |
| 46. | Dakota | 19.0% | 6.2%(+12.8)#46 | 6.9%(+12.1)#2,144 |
| 47. | Middle River | 18.9% | 6.2%(+12.7)#47 | 6.9%(+12.0)#2,158 |
| 48. | Canton | 18.8% | 6.2%(+12.6)#48 | 6.9%(+12.0)#2,192 |
| 49. | Brownsville | 18.7% | 6.2%(+12.5)#49 | 6.9%(+11.8)#2,229 |
| 50. | Seaforth | 18.6% | 6.2%(+12.4)#50 | 6.9%(+11.7)#2,244 |
| 51. | St Rosa | 18.5% | 6.2%(+12.3)#51 | 6.9%(+11.6)#2,277 |
| 52. | Darfur | 18.4% | 6.2%(+12.1)#52 | 6.9%(+11.5)#2,307 |
| 53. | Rush City | 18.3% | 6.2%(+12.1)#53 | 6.9%(+11.4)#2,323 |
| 54. | Wanda | 18.2% | 6.2%(+11.9)#54 | 6.9%(+11.3)#2,377 |
| 55. | Hillman | 18.2% | 6.2%(+11.9)#55 | 6.9%(+11.3)#2,392 |
| 56. | Becker | 18.0% | 6.2%(+11.7)#56 | 6.9%(+11.1)#2,435 |
| 57. | Gilman | 17.7% | 6.2%(+11.5)#57 | 6.9%(+10.9)#2,505 |
| 58. | Dent | 17.7% | 6.2%(+11.5)#58 | 6.9%(+10.8)#2,524 |
| 59. | East Bethel | 17.7% | 6.2%(+11.5)#59 | 6.9%(+10.8)#2,526 |
| 60. | Akeley | 17.6% | 6.2%(+11.4)#60 | 6.9%(+10.8)#2,539 |
| 61. | Coates | 17.6% | 6.2%(+11.3)#61 | 6.9%(+10.7)#2,572 |
| 62. | Foxhome | 17.5% | 6.2%(+11.3)#62 | 6.9%(+10.7)#2,577 |
| 63. | Herman | 17.5% | 6.2%(+11.3)#63 | 6.9%(+10.6)#2,586 |
| 64. | Spring Grove | 17.5% | 6.2%(+11.2)#64 | 6.9%(+10.6)#2,587 |
| 65. | Grey Eagle | 17.2% | 6.2%(+11.0)#65 | 6.9%(+10.4)#2,652 |
| 66. | Pine Point | 17.2% | 6.2%(+11.0)#66 | 6.9%(+10.4)#2,653 |
| 67. | Brookston | 17.1% | 6.2%(+10.9)#67 | 6.9%(+10.3)#2,687 |
| 68. | Dundee | 17.1% | 6.2%(+10.9)#68 | 6.9%(+10.3)#2,688 |
| 69. | Ogema | 16.9% | 6.2%(+10.7)#69 | 6.9%(+10.1)#2,762 |
| 70. | Clinton | 16.9% | 6.2%(+10.6)#70 | 6.9%(+10.00)#2,786 |
| 71. | Greenfield | 16.8% | 6.2%(+10.5)#71 | 6.9%(+9.90)#2,825 |
| 72. | Lucan | 16.5% | 6.2%(+10.2)#72 | 6.9%(+9.58)#2,974 |
| 73. | Lonsdale | 16.5% | 6.2%(+10.2)#73 | 6.9%(+9.58)#2,975 |
| 74. | Cokato | 16.3% | 6.2%(+10.0)#74 | 6.9%(+9.40)#3,029 |
| 75. | St Stephen | 16.2% | 6.2%(+10.0)#75 | 6.9%(+9.37)#3,042 |
| 76. | St Francis | 16.2% | 6.2%(+9.99)#76 | 6.9%(+9.35)#3,046 |
| 77. | Ruthton | 16.2% | 6.2%(+9.98)#77 | 6.9%(+9.34)#3,054 |
| 78. | Le Center | 16.1% | 6.2%(+9.88)#78 | 6.9%(+9.24)#3,090 |
| 79. | Felton | 16.1% | 6.2%(+9.86)#79 | 6.9%(+9.22)#3,096 |
| 80. | Hancock | 16.1% | 6.2%(+9.84)#80 | 6.9%(+9.19)#3,105 |
| 81. | Henderson | 16.1% | 6.2%(+9.83)#81 | 6.9%(+9.19)#3,109 |
| 82. | Darwin | 16.0% | 6.2%(+9.81)#82 | 6.9%(+9.17)#3,119 |
| 83. | White Earth | 16.0% | 6.2%(+9.78)#83 | 6.9%(+9.14)#3,128 |
| 84. | Sacred Heart | 15.9% | 6.2%(+9.69)#84 | 6.9%(+9.05)#3,163 |
| 85. | Brownsdale | 15.9% | 6.2%(+9.68)#85 | 6.9%(+9.04)#3,168 |
| 86. | Beaver Creek | 15.9% | 6.2%(+9.63)#86 | 6.9%(+8.99)#3,198 |
| 87. | Cedar Mills | 15.8% | 6.2%(+9.55)#88 | 6.9%(+8.91)#3,230 |
| 88. | Sedan | 15.8% | 6.2%(+9.55)#89 | 6.9%(+8.91)#3,231 |
| 89. | Bigelow | 15.7% | 6.2%(+9.51)#90 | 6.9%(+8.87)#3,243 |
| 90. | Halstad | 15.7% | 6.2%(+9.46)#91 | 6.9%(+8.82)#3,270 |
| 91. | Milroy | 15.7% | 6.2%(+9.42)#92 | 6.9%(+8.78)#3,290 |
| 92. | Isanti | 15.6% | 6.2%(+9.33)#93 | 6.9%(+8.69)#3,316 |
| 93. | Rose Creek | 15.6% | 6.2%(+9.32)#94 | 6.9%(+8.68)#3,321 |
| 94. | Kingston | 15.5% | 6.2%(+9.30)#95 | 6.9%(+8.66)#3,336 |
| 95. | Kandiyohi | 15.5% | 6.2%(+9.29)#96 | 6.9%(+8.65)#3,340 |
| 96. | Rockville | 15.5% | 6.2%(+9.25)#97 | 6.9%(+8.61)#3,351 |
| 97. | Villard | 15.4% | 6.2%(+9.15)#98 | 6.9%(+8.51)#3,384 |
| 98. | Forada | 15.4% | 6.2%(+9.15)#99 | 6.9%(+8.51)#3,398 |
| 99. | Minneiska | 15.2% | 6.2%(+8.92)#100 | 6.9%(+8.28)#3,522 |
| 100. | Brook Park | 14.9% | 6.2%(+8.69)#101 | 6.9%(+8.05)#3,652 |
Common Questions
What are the Top 10 Cities with the Highest Percentage of Population Employed in Construction in Minnesota?
Top 10 Cities with the Highest Percentage of Population Employed in Construction in Minnesota are:
#1
58.3%
#2
55.6%
#3
50.0%
#4
46.7%
#5
39.6%
#6
36.2%
#7
34.7%
#8
34.0%
#9
32.1%
#10
31.8%
What city has the Highest Percentage of Population Employed in Construction in Minnesota?
Trail has the Highest Percentage of Population Employed in Construction in Minnesota with 58.3%.
What is the Percentage of Population Employed in Construction in the State of Minnesota?
Percentage of Population Employed in Construction in Minnesota is 6.2%.
What is the Percentage of Population Employed in Construction in the United States?
Percentage of Population Employed in Construction in the United States is 6.9%.