Cities with the Highest Percentage of Population Employed in Construction in Massachusetts
RELATED REPORTS & OPTIONS
Construction
Massachusetts
Compare Cities
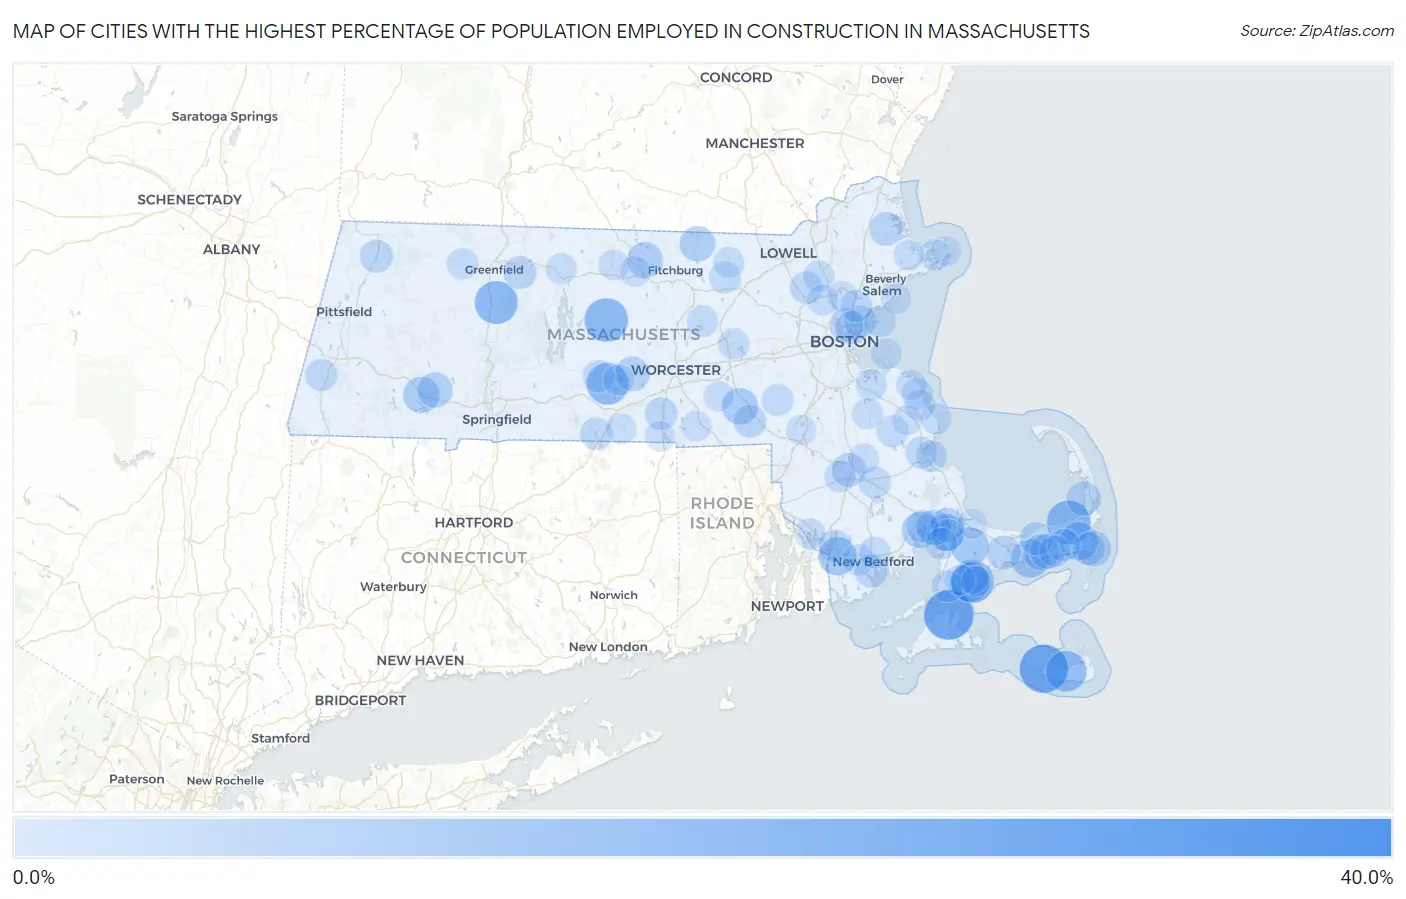
Map of Cities with the Highest Percentage of Population Employed in Construction in Massachusetts
0.0%
40.0%
Cities with the Highest Percentage of Population Employed in Construction in Massachusetts
| City | % Employed | vs State | vs National | |
| 1. | Green Harbor | 39.3% | 6.0%(+33.3)#1 | 6.9%(+32.4)#376 |
| 2. | Vineyard Haven | 30.0% | 6.0%(+24.0)#2 | 6.9%(+23.1)#750 |
| 3. | Madaket | 28.6% | 6.0%(+22.7)#3 | 6.9%(+21.8)#820 |
| 4. | Brewster | 23.4% | 6.0%(+17.4)#4 | 6.9%(+16.5)#1,325 |
| 5. | Barre | 23.1% | 6.0%(+17.1)#5 | 6.9%(+16.2)#1,386 |
| 6. | South Deerfield | 22.4% | 6.0%(+16.4)#6 | 6.9%(+15.5)#1,482 |
| 7. | Monomoscoy Island | 22.1% | 6.0%(+16.1)#7 | 6.9%(+15.2)#1,533 |
| 8. | Brookfield | 21.2% | 6.0%(+15.2)#8 | 6.9%(+14.3)#1,674 |
| 9. | Nantucket | 19.8% | 6.0%(+13.8)#9 | 6.9%(+12.9)#1,947 |
| 10. | Oak Bluffs | 18.5% | 6.0%(+12.5)#10 | 6.9%(+11.6)#2,267 |
| 11. | Seconsett Island | 17.8% | 6.0%(+11.8)#11 | 6.9%(+10.9)#2,496 |
| 12. | North Westport | 16.8% | 6.0%(+10.8)#12 | 6.9%(+9.91)#2,823 |
| 13. | East Harwich | 16.7% | 6.0%(+10.8)#13 | 6.9%(+9.87)#2,841 |
| 14. | West Yarmouth | 16.5% | 6.0%(+10.5)#14 | 6.9%(+9.59)#2,973 |
| 15. | Forestdale | 16.4% | 6.0%(+10.4)#15 | 6.9%(+9.53)#2,993 |
| 16. | Bourne | 15.4% | 6.0%(+9.38)#16 | 6.9%(+8.48)#3,415 |
| 17. | Milford | 14.8% | 6.0%(+8.78)#17 | 6.9%(+7.89)#3,749 |
| 18. | Blandford | 14.6% | 6.0%(+8.62)#18 | 6.9%(+7.73)#3,843 |
| 19. | Weweantic | 14.6% | 6.0%(+8.58)#19 | 6.9%(+7.69)#3,873 |
| 20. | South Yarmouth | 14.2% | 6.0%(+8.18)#20 | 6.9%(+7.29)#4,118 |
| 21. | South Ashburnham | 14.1% | 6.0%(+8.08)#21 | 6.9%(+7.19)#4,168 |
| 22. | Townsend | 13.6% | 6.0%(+7.66)#22 | 6.9%(+6.77)#4,436 |
| 23. | Chatham | 13.6% | 6.0%(+7.60)#23 | 6.9%(+6.70)#4,491 |
| 24. | Russell | 13.4% | 6.0%(+7.44)#24 | 6.9%(+6.55)#4,618 |
| 25. | Onset | 13.1% | 6.0%(+7.15)#25 | 6.9%(+6.26)#4,820 |
| 26. | West Dennis | 12.9% | 6.0%(+6.92)#26 | 6.9%(+6.02)#4,993 |
| 27. | Spencer | 12.8% | 6.0%(+6.81)#27 | 6.9%(+5.91)#5,066 |
| 28. | West Warren | 12.6% | 6.0%(+6.64)#28 | 6.9%(+5.75)#5,163 |
| 29. | North Eastham | 12.4% | 6.0%(+6.37)#29 | 6.9%(+5.48)#5,393 |
| 30. | Buzzards Bay | 12.2% | 6.0%(+6.22)#30 | 6.9%(+5.32)#5,519 |
| 31. | Barnstable Town | 12.1% | 6.0%(+6.08)#31 | 6.9%(+5.19)#5,629 |
| 32. | Raynham Center | 11.8% | 6.0%(+5.82)#32 | 6.9%(+4.93)#5,890 |
| 33. | Rowley | 11.7% | 6.0%(+5.71)#33 | 6.9%(+4.81)#6,016 |
| 34. | Yarmouth Port | 11.3% | 6.0%(+5.27)#34 | 6.9%(+4.37)#6,487 |
| 35. | Everett | 11.1% | 6.0%(+5.15)#35 | 6.9%(+4.25)#6,597 |
| 36. | Adams | 11.0% | 6.0%(+5.00)#36 | 6.9%(+4.11)#6,787 |
| 37. | Bliss Corner | 10.8% | 6.0%(+4.85)#37 | 6.9%(+3.96)#6,969 |
| 38. | Bellingham | 10.7% | 6.0%(+4.71)#38 | 6.9%(+3.82)#7,145 |
| 39. | West Chatham | 10.7% | 6.0%(+4.70)#39 | 6.9%(+3.81)#7,154 |
| 40. | Millers Falls | 10.6% | 6.0%(+4.65)#40 | 6.9%(+3.76)#7,230 |
| 41. | Oxford | 10.5% | 6.0%(+4.53)#41 | 6.9%(+3.64)#7,385 |
| 42. | Chelsea | 10.4% | 6.0%(+4.46)#42 | 6.9%(+3.57)#7,460 |
| 43. | Pinehurst | 10.4% | 6.0%(+4.46)#43 | 6.9%(+3.56)#7,465 |
| 44. | Fall River | 10.4% | 6.0%(+4.41)#44 | 6.9%(+3.52)#7,517 |
| 45. | Revere | 10.4% | 6.0%(+4.38)#45 | 6.9%(+3.49)#7,563 |
| 46. | Wareham Center | 10.3% | 6.0%(+4.36)#46 | 6.9%(+3.47)#7,601 |
| 47. | Northwest Harwich | 10.2% | 6.0%(+4.24)#47 | 6.9%(+3.34)#7,738 |
| 48. | Holland | 10.2% | 6.0%(+4.17)#48 | 6.9%(+3.28)#7,810 |
| 49. | West Brookfield | 10.1% | 6.0%(+4.15)#49 | 6.9%(+3.26)#7,841 |
| 50. | Seabrook | 10.1% | 6.0%(+4.12)#50 | 6.9%(+3.23)#7,877 |
| 51. | Housatonic | 10.0% | 6.0%(+4.04)#51 | 6.9%(+3.15)#7,977 |
| 52. | Saugus | 10.0% | 6.0%(+4.01)#52 | 6.9%(+3.12)#8,052 |
| 53. | Middleborough Center | 9.9% | 6.0%(+3.93)#53 | 6.9%(+3.04)#8,142 |
| 54. | Kingston | 9.8% | 6.0%(+3.81)#54 | 6.9%(+2.91)#8,324 |
| 55. | Millis Clicquot | 9.8% | 6.0%(+3.80)#55 | 6.9%(+2.91)#8,328 |
| 56. | Hanson | 9.8% | 6.0%(+3.80)#56 | 6.9%(+2.90)#8,345 |
| 57. | Monument Beach | 9.7% | 6.0%(+3.68)#57 | 6.9%(+2.79)#8,504 |
| 58. | Ayer | 9.6% | 6.0%(+3.62)#58 | 6.9%(+2.73)#8,599 |
| 59. | Pocasset | 9.6% | 6.0%(+3.57)#59 | 6.9%(+2.67)#8,676 |
| 60. | Falmouth | 9.5% | 6.0%(+3.56)#60 | 6.9%(+2.67)#8,682 |
| 61. | Cedar Crest | 9.5% | 6.0%(+3.49)#61 | 6.9%(+2.60)#8,795 |
| 62. | Smith Mills | 9.4% | 6.0%(+3.45)#62 | 6.9%(+2.56)#8,852 |
| 63. | North Plymouth | 9.3% | 6.0%(+3.35)#63 | 6.9%(+2.46)#9,011 |
| 64. | Clinton | 9.3% | 6.0%(+3.33)#64 | 6.9%(+2.44)#9,040 |
| 65. | Nahant | 9.3% | 6.0%(+3.29)#65 | 6.9%(+2.40)#9,115 |
| 66. | Taunton | 9.2% | 6.0%(+3.21)#66 | 6.9%(+2.32)#9,239 |
| 67. | Dennis Port | 9.2% | 6.0%(+3.18)#67 | 6.9%(+2.29)#9,272 |
| 68. | New Bedford | 9.1% | 6.0%(+3.09)#68 | 6.9%(+2.20)#9,453 |
| 69. | Shelburne Falls | 9.0% | 6.0%(+3.06)#69 | 6.9%(+2.17)#9,494 |
| 70. | Weymouth Town | 9.0% | 6.0%(+3.03)#70 | 6.9%(+2.14)#9,551 |
| 71. | Scituate | 8.9% | 6.0%(+2.94)#71 | 6.9%(+2.04)#9,686 |
| 72. | Wilmington | 8.9% | 6.0%(+2.92)#72 | 6.9%(+2.03)#9,705 |
| 73. | Marlborough | 8.9% | 6.0%(+2.89)#73 | 6.9%(+2.00)#9,750 |
| 74. | Orange | 8.9% | 6.0%(+2.87)#74 | 6.9%(+1.98)#9,788 |
| 75. | Gloucester | 8.9% | 6.0%(+2.87)#75 | 6.9%(+1.98)#9,792 |
| 76. | East Brookfield | 8.8% | 6.0%(+2.80)#76 | 6.9%(+1.91)#9,919 |
| 77. | Groton | 8.7% | 6.0%(+2.70)#77 | 6.9%(+1.81)#10,111 |
| 78. | Abington | 8.7% | 6.0%(+2.67)#78 | 6.9%(+1.77)#10,159 |
| 79. | Ocean Bluff Brant Rock | 8.5% | 6.0%(+2.54)#79 | 6.9%(+1.65)#10,391 |
| 80. | Woburn | 8.5% | 6.0%(+2.53)#80 | 6.9%(+1.64)#10,424 |
| 81. | Marshfield Hills | 8.4% | 6.0%(+2.39)#81 | 6.9%(+1.50)#10,675 |
| 82. | Essex | 8.3% | 6.0%(+2.36)#82 | 6.9%(+1.47)#10,712 |
| 83. | Baldwinville | 8.3% | 6.0%(+2.36)#83 | 6.9%(+1.47)#10,721 |
| 84. | Ocean Grove | 8.3% | 6.0%(+2.36)#84 | 6.9%(+1.46)#10,728 |
| 85. | East Falmouth | 8.2% | 6.0%(+2.25)#85 | 6.9%(+1.36)#10,960 |
| 86. | Southbridge Town | 8.2% | 6.0%(+2.22)#86 | 6.9%(+1.33)#11,027 |
| 87. | Hull | 8.1% | 6.0%(+2.16)#87 | 6.9%(+1.27)#11,136 |
| 88. | East Douglas | 8.1% | 6.0%(+2.09)#88 | 6.9%(+1.20)#11,264 |
| 89. | Bridgewater Town | 8.1% | 6.0%(+2.09)#89 | 6.9%(+1.20)#11,272 |
| 90. | Gardner | 8.0% | 6.0%(+2.06)#90 | 6.9%(+1.17)#11,334 |
| 91. | North Scituate | 8.0% | 6.0%(+2.05)#91 | 6.9%(+1.16)#11,355 |
| 92. | Wakefield | 8.0% | 6.0%(+2.00)#92 | 6.9%(+1.11)#11,461 |
| 93. | Webster | 8.0% | 6.0%(+1.97)#93 | 6.9%(+1.08)#11,512 |
| 94. | Marblehead | 7.9% | 6.0%(+1.95)#94 | 6.9%(+1.06)#11,563 |
| 95. | Foxborough | 7.9% | 6.0%(+1.90)#95 | 6.9%(+1.01)#11,680 |
| 96. | Upton | 7.8% | 6.0%(+1.86)#96 | 6.9%(+0.971)#11,743 |
| 97. | New Seabury | 7.7% | 6.0%(+1.74)#97 | 6.9%(+0.849)#12,009 |
| 98. | North Pembroke | 7.7% | 6.0%(+1.72)#98 | 6.9%(+0.833)#12,037 |
| 99. | Rockport | 7.7% | 6.0%(+1.68)#99 | 6.9%(+0.787)#12,154 |
| 100. | Sandwich | 7.5% | 6.0%(+1.56)#100 | 6.9%(+0.668)#12,412 |
Common Questions
What are the Top 10 Cities with the Highest Percentage of Population Employed in Construction in Massachusetts?
Top 10 Cities with the Highest Percentage of Population Employed in Construction in Massachusetts are:
#1
30.0%
#2
28.6%
#3
23.4%
#4
23.1%
#5
22.4%
#6
22.1%
#7
21.2%
#8
19.8%
#9
17.8%
#10
16.8%
What city has the Highest Percentage of Population Employed in Construction in Massachusetts?
Vineyard Haven has the Highest Percentage of Population Employed in Construction in Massachusetts with 30.0%.
What is the Percentage of Population Employed in Construction in the State of Massachusetts?
Percentage of Population Employed in Construction in Massachusetts is 6.0%.
What is the Percentage of Population Employed in Construction in the United States?
Percentage of Population Employed in Construction in the United States is 6.9%.