Cities with the Largest African Community in the United States
RELATED REPORTS & OPTIONS
African
United States
Compare Cities
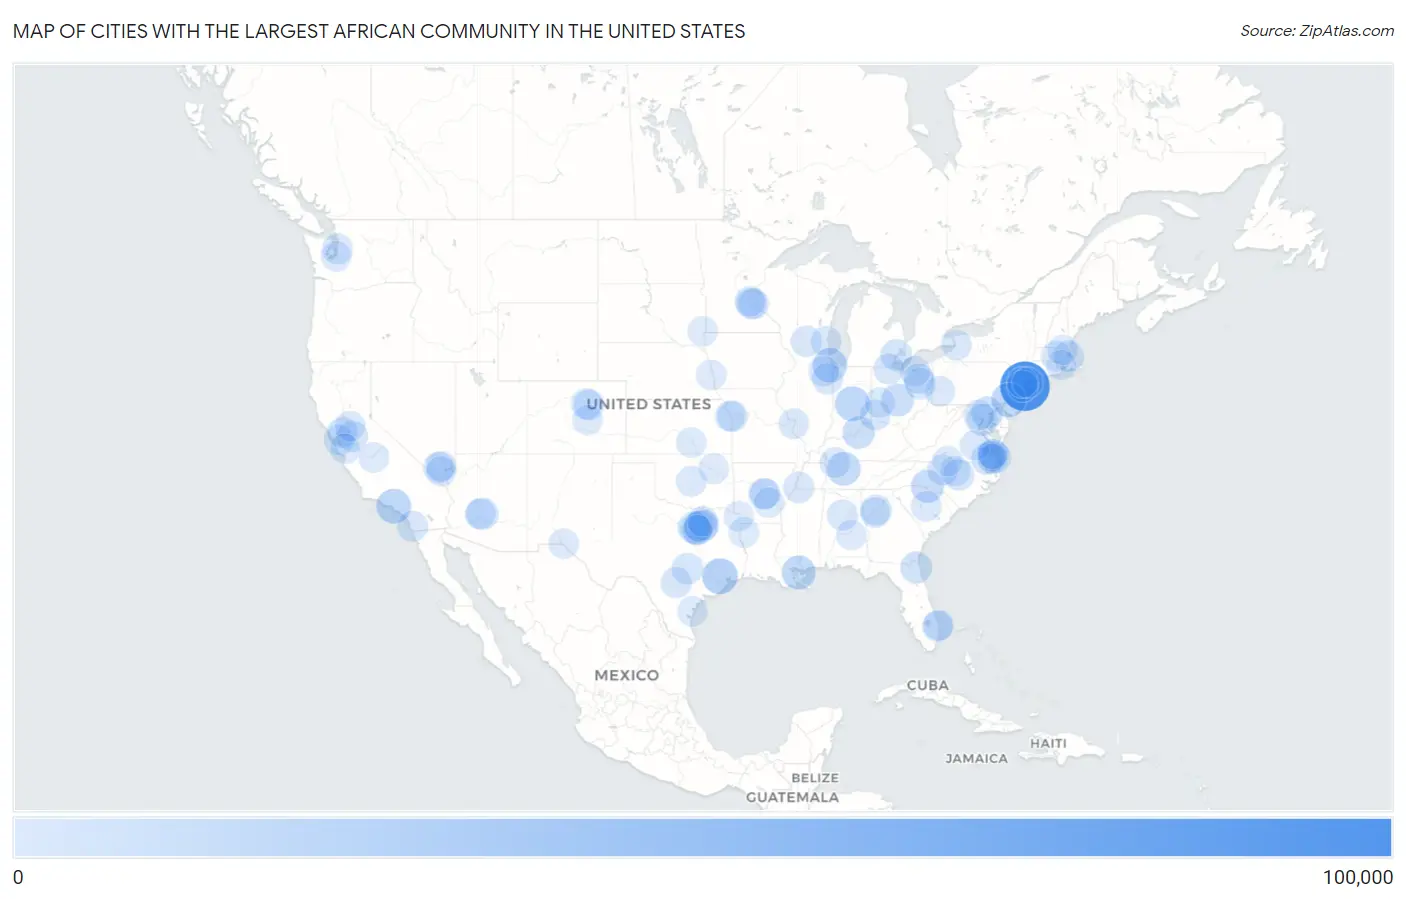
Map of Cities with the Largest African Community in the United States
0
100,000
Cities with the Largest African Community in the United States
| City | African | vs State | vs National | |
| 1. | New York | 93,911 | 134,721(69.71%)#1 | 1,871,898(5.02%)#1 |
| 2. | Houston | 26,807 | 195,696(13.70%)#1 | 1,871,898(1.43%)#2 |
| 3. | Los Angeles | 22,522 | 144,343(15.60%)#1 | 1,871,898(1.20%)#3 |
| 4. | Indianapolis | 22,079 | 39,278(56.21%)#1 | 1,871,898(1.18%)#4 |
| 5. | Philadelphia | 21,156 | 67,313(31.43%)#1 | 1,871,898(1.13%)#5 |
| 6. | Chicago | 20,769 | 71,530(29.04%)#1 | 1,871,898(1.11%)#6 |
| 7. | New Orleans | 18,895 | 39,823(47.45%)#1 | 1,871,898(1.01%)#7 |
| 8. | Nashville | 17,675 | 52,094(33.93%)#1 | 1,871,898(0.94%)#8 |
| 9. | Charlotte | 14,270 | 74,005(19.28%)#1 | 1,871,898(0.76%)#9 |
| 10. | Columbus | 13,400 | 79,267(16.90%)#1 | 1,871,898(0.72%)#10 |
| 11. | Louisville | 12,283 | 24,769(49.59%)#1 | 1,871,898(0.66%)#11 |
| 12. | Dallas | 12,254 | 195,696(6.26%)#2 | 1,871,898(0.65%)#12 |
| 13. | Suffolk | 10,281 | 99,286(10.35%)#1 | 1,871,898(0.55%)#13 |
| 14. | Baltimore | 10,009 | 90,427(11.07%)#1 | 1,871,898(0.53%)#14 |
| 15. | Phoenix | 9,764 | 25,428(38.40%)#1 | 1,871,898(0.52%)#15 |
| 16. | Jacksonville | 9,276 | 113,560(8.17%)#1 | 1,871,898(0.50%)#16 |
| 17. | Fort Worth | 9,199 | 195,696(4.70%)#3 | 1,871,898(0.49%)#17 |
| 18. | Washington | 8,930 | 8,930(100.00%)#1 | 1,871,898(0.48%)#18 |
| 19. | Arlington | 8,682 | 195,696(4.44%)#4 | 1,871,898(0.46%)#19 |
| 20. | Detroit | 8,239 | 48,730(16.91%)#1 | 1,871,898(0.44%)#20 |
| 21. | Canton | 7,196 | 79,267(9.08%)#2 | 1,871,898(0.38%)#21 |
| 22. | Austin | 6,869 | 195,696(3.51%)#5 | 1,871,898(0.37%)#22 |
| 23. | Newark | 6,833 | 50,507(13.53%)#1 | 1,871,898(0.37%)#23 |
| 24. | Las Vegas | 6,434 | 22,691(28.35%)#1 | 1,871,898(0.34%)#24 |
| 25. | Memphis | 6,170 | 52,094(11.84%)#2 | 1,871,898(0.33%)#25 |
| 26. | Kankakee | 6,045 | 71,530(8.45%)#2 | 1,871,898(0.32%)#26 |
| 27. | Raleigh | 5,989 | 74,005(8.09%)#2 | 1,871,898(0.32%)#27 |
| 28. | Little Rock | 5,954 | 25,468(23.38%)#1 | 1,871,898(0.32%)#28 |
| 29. | San Antonio | 5,791 | 195,696(2.96%)#6 | 1,871,898(0.31%)#29 |
| 30. | Paterson | 5,504 | 50,507(10.90%)#2 | 1,871,898(0.29%)#30 |
| 31. | Madison | 5,436 | 18,379(29.58%)#1 | 1,871,898(0.29%)#31 |
| 32. | Atlanta | 5,418 | 97,024(5.58%)#1 | 1,871,898(0.29%)#32 |
| 33. | San Diego | 5,342 | 144,343(3.70%)#2 | 1,871,898(0.29%)#33 |
| 34. | Stockton | 5,334 | 144,343(3.70%)#3 | 1,871,898(0.28%)#34 |
| 35. | Cincinnati | 5,204 | 79,267(6.57%)#3 | 1,871,898(0.28%)#35 |
| 36. | Boston | 4,881 | 32,213(15.15%)#1 | 1,871,898(0.26%)#36 |
| 37. | Greensboro | 4,865 | 74,005(6.57%)#3 | 1,871,898(0.26%)#37 |
| 38. | Toledo | 4,722 | 79,267(5.96%)#4 | 1,871,898(0.25%)#38 |
| 39. | Birmingham | 4,722 | 33,082(14.27%)#1 | 1,871,898(0.25%)#39 |
| 40. | Kansas City | 4,720 | 24,132(19.56%)#1 | 1,871,898(0.25%)#40 |
| 41. | Milwaukee | 4,458 | 18,379(24.26%)#2 | 1,871,898(0.24%)#41 |
| 42. | Norfolk | 4,399 | 99,286(4.43%)#2 | 1,871,898(0.24%)#42 |
| 43. | Seattle | 4,306 | 33,788(12.74%)#1 | 1,871,898(0.23%)#43 |
| 44. | Denver | 4,214 | 16,991(24.80%)#1 | 1,871,898(0.23%)#44 |
| 45. | Oklahoma City | 4,186 | 13,767(30.41%)#1 | 1,871,898(0.22%)#45 |
| 46. | Garland | 4,183 | 195,696(2.14%)#7 | 1,871,898(0.22%)#46 |
| 47. | Minneapolis | 4,182 | 32,871(12.72%)#1 | 1,871,898(0.22%)#47 |
| 48. | Virginia Beach | 4,159 | 99,286(4.19%)#3 | 1,871,898(0.22%)#48 |
| 49. | Buffalo | 4,124 | 134,721(3.06%)#2 | 1,871,898(0.22%)#49 |
| 50. | Aurora | 3,933 | 16,991(23.15%)#2 | 1,871,898(0.21%)#50 |
| 51. | Joliet | 3,910 | 71,530(5.47%)#3 | 1,871,898(0.21%)#51 |
| 52. | St Paul | 3,873 | 32,871(11.78%)#2 | 1,871,898(0.21%)#52 |
| 53. | Oakland | 3,766 | 144,343(2.61%)#4 | 1,871,898(0.20%)#53 |
| 54. | Fairfield | 3,676 | 144,343(2.55%)#5 | 1,871,898(0.20%)#54 |
| 55. | Riviera Beach | 3,535 | 113,560(3.11%)#2 | 1,871,898(0.19%)#55 |
| 56. | Clarksville | 3,527 | 52,094(6.77%)#3 | 1,871,898(0.19%)#56 |
| 57. | Cleveland | 3,491 | 79,267(4.40%)#5 | 1,871,898(0.19%)#57 |
| 58. | Irving | 3,458 | 195,696(1.77%)#8 | 1,871,898(0.18%)#58 |
| 59. | Columbia | 3,439 | 38,814(8.86%)#1 | 1,871,898(0.18%)#59 |
| 60. | West Palm Beach | 3,421 | 113,560(3.01%)#3 | 1,871,898(0.18%)#60 |
| 61. | Worcester | 3,354 | 32,213(10.41%)#2 | 1,871,898(0.18%)#61 |
| 62. | Sacramento | 3,266 | 144,343(2.26%)#6 | 1,871,898(0.17%)#62 |
| 63. | Akron | 3,235 | 79,267(4.08%)#6 | 1,871,898(0.17%)#63 |
| 64. | St Louis | 3,217 | 24,132(13.33%)#2 | 1,871,898(0.17%)#64 |
| 65. | Richmond | 3,206 | 99,286(3.23%)#4 | 1,871,898(0.17%)#65 |
| 66. | North Little Rock | 3,125 | 25,468(12.27%)#2 | 1,871,898(0.17%)#66 |
| 67. | Tulsa | 3,081 | 13,767(22.38%)#2 | 1,871,898(0.16%)#67 |
| 68. | North Las Vegas | 3,080 | 22,691(13.57%)#2 | 1,871,898(0.16%)#68 |
| 69. | Corpus Christi | 3,057 | 195,696(1.56%)#9 | 1,871,898(0.16%)#69 |
| 70. | Omaha | 3,040 | 5,857(51.90%)#1 | 1,871,898(0.16%)#70 |
| 71. | Portsmouth | 3,035 | 99,286(3.06%)#5 | 1,871,898(0.16%)#71 |
| 72. | Yonkers | 3,007 | 134,721(2.23%)#3 | 1,871,898(0.16%)#72 |
| 73. | Durham | 2,994 | 74,005(4.05%)#4 | 1,871,898(0.16%)#73 |
| 74. | Pittsburgh | 2,961 | 67,313(4.40%)#2 | 1,871,898(0.16%)#74 |
| 75. | Pine Bluff | 2,951 | 25,468(11.59%)#3 | 1,871,898(0.16%)#75 |
| 76. | Montgomery | 2,908 | 33,082(8.79%)#2 | 1,871,898(0.16%)#76 |
| 77. | Tacoma | 2,907 | 33,788(8.60%)#2 | 1,871,898(0.16%)#77 |
| 78. | Brooklyn Park | 2,870 | 32,871(8.73%)#3 | 1,871,898(0.15%)#78 |
| 79. | Allen | 2,822 | 195,696(1.44%)#10 | 1,871,898(0.15%)#79 |
| 80. | Grand Prairie | 2,811 | 195,696(1.44%)#11 | 1,871,898(0.15%)#80 |
| 81. | Glendale | 2,803 | 25,428(11.02%)#2 | 1,871,898(0.15%)#81 |
| 82. | Germantown | 2,757 | 90,427(3.05%)#2 | 1,871,898(0.15%)#82 |
| 83. | Henderson | 2,714 | 22,691(11.96%)#3 | 1,871,898(0.14%)#83 |
| 84. | Wichita | 2,690 | 11,073(24.29%)#1 | 1,871,898(0.14%)#84 |
| 85. | Colorado Springs | 2,647 | 16,991(15.58%)#3 | 1,871,898(0.14%)#85 |
| 86. | Chesapeake | 2,647 | 99,286(2.67%)#6 | 1,871,898(0.14%)#86 |
| 87. | Shreveport | 2,646 | 39,823(6.64%)#2 | 1,871,898(0.14%)#87 |
| 88. | Providence | 2,641 | 6,269(42.13%)#1 | 1,871,898(0.14%)#88 |
| 89. | El Paso | 2,581 | 195,696(1.32%)#12 | 1,871,898(0.14%)#89 |
| 90. | South Fulton | 2,573 | 97,024(2.65%)#2 | 1,871,898(0.14%)#90 |
| 91. | Dayton | 2,567 | 79,267(3.24%)#7 | 1,871,898(0.14%)#91 |
| 92. | Kansas City | 2,539 | 11,073(22.93%)#2 | 1,871,898(0.14%)#92 |
| 93. | Hampton | 2,449 | 99,286(2.47%)#7 | 1,871,898(0.13%)#93 |
| 94. | Augusta-Richmond County Consolidated Government (Balance) | 2,405 | 97,024(2.48%)#3 | 1,871,898(0.13%)#94 |
| 95. | San Jose | 2,399 | 144,343(1.66%)#7 | 1,871,898(0.13%)#95 |
| 96. | Sioux Falls | 2,395 | 3,001(79.81%)#1 | 1,871,898(0.13%)#96 |
| 97. | Fresno | 2,384 | 144,343(1.65%)#8 | 1,871,898(0.13%)#97 |
| 98. | Lowell | 2,381 | 32,213(7.39%)#3 | 1,871,898(0.13%)#98 |
| 99. | Danville | 2,368 | 99,286(2.39%)#8 | 1,871,898(0.13%)#99 |
| 100. | Texarkana | 2,360 | 195,696(1.21%)#13 | 1,871,898(0.13%)#100 |
Common Questions
What are the Top 10 Cities with the Largest African Community in the United States?
Top 10 Cities with the Largest African Community in the United States are:
#1
93,911
#2
26,807
#3
22,522
#4
22,079
#5
21,156
#6
20,769
#7
18,895
#8
17,675
#9
14,270
#10
13,400
What city has the Largest African Community in the United States?
New York has the Largest African Community in the United States with 93,911.
What is the Total African Population in the United States?
Total African Population in the United States is 1,871,898.