Cities with the Largest African Community in Ohio
RELATED REPORTS & OPTIONS
African
Ohio
Compare Cities
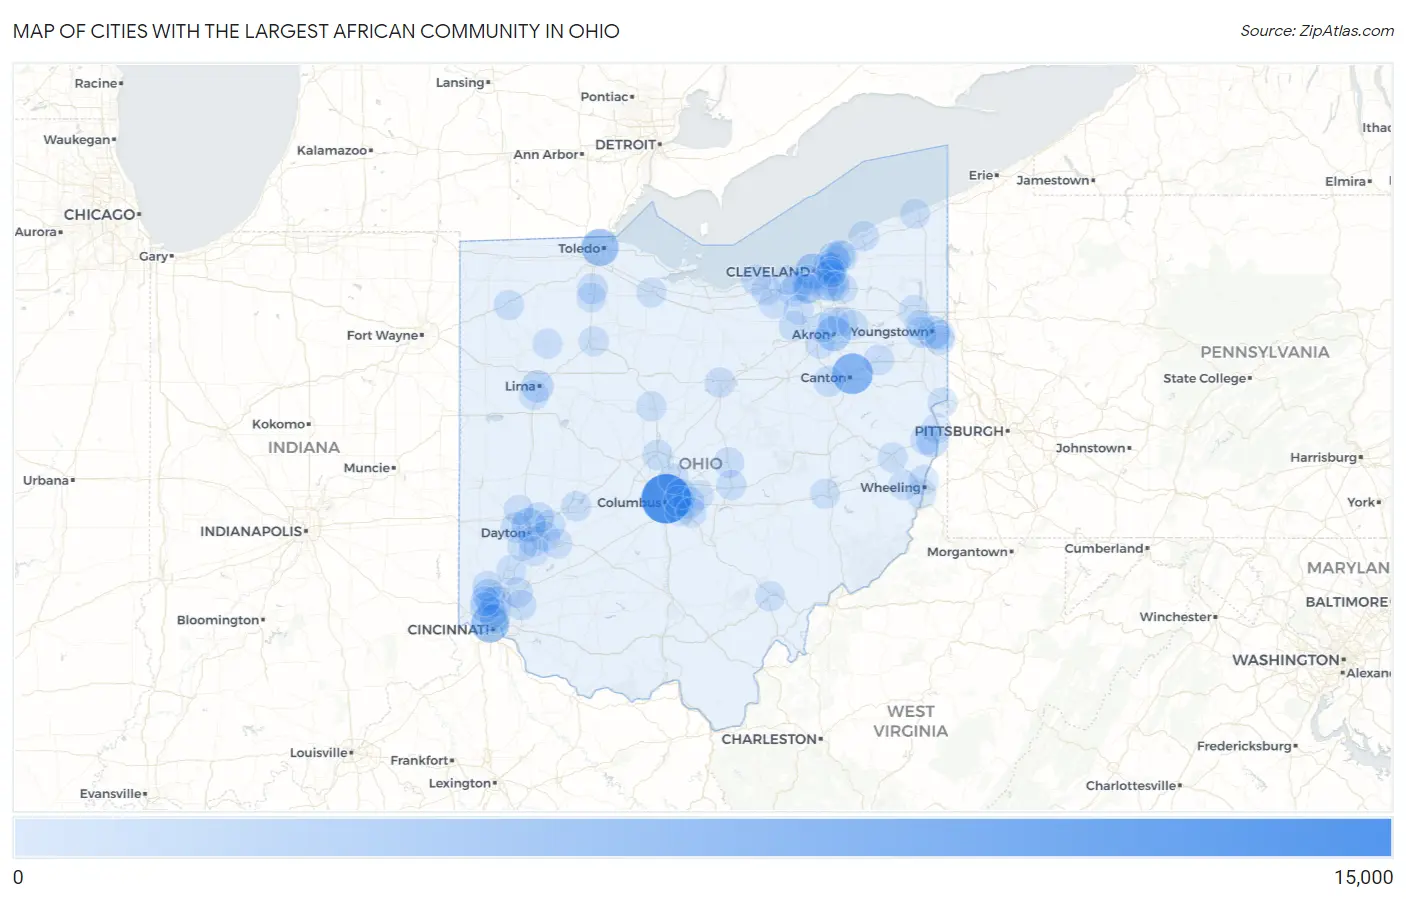
Map of Cities with the Largest African Community in Ohio
0
15,000
Cities with the Largest African Community in Ohio
| City | African | vs State | vs National | |
| 1. | Columbus | 13,400 | 79,267(16.90%)#1 | 1,871,898(0.72%)#10 |
| 2. | Canton | 7,196 | 79,267(9.08%)#2 | 1,871,898(0.38%)#21 |
| 3. | Cincinnati | 5,204 | 79,267(6.57%)#3 | 1,871,898(0.28%)#35 |
| 4. | Toledo | 4,722 | 79,267(5.96%)#4 | 1,871,898(0.25%)#38 |
| 5. | Cleveland | 3,491 | 79,267(4.40%)#5 | 1,871,898(0.19%)#57 |
| 6. | Akron | 3,235 | 79,267(4.08%)#6 | 1,871,898(0.17%)#63 |
| 7. | Dayton | 2,567 | 79,267(3.24%)#7 | 1,871,898(0.14%)#91 |
| 8. | Youngstown | 1,747 | 79,267(2.20%)#8 | 1,871,898(0.09%)#146 |
| 9. | Lima | 1,483 | 79,267(1.87%)#9 | 1,871,898(0.08%)#173 |
| 10. | Steubenville | 1,411 | 79,267(1.78%)#10 | 1,871,898(0.08%)#180 |
| 11. | Fairfield | 1,397 | 79,267(1.76%)#11 | 1,871,898(0.07%)#183 |
| 12. | Reynoldsburg | 1,044 | 79,267(1.32%)#12 | 1,871,898(0.06%)#240 |
| 13. | Euclid | 832 | 79,267(1.05%)#13 | 1,871,898(0.04%)#313 |
| 14. | Whitehall | 671 | 79,267(0.85%)#14 | 1,871,898(0.04%)#395 |
| 15. | Austintown | 635 | 79,267(0.80%)#15 | 1,871,898(0.03%)#429 |
| 16. | Massillon | 618 | 79,267(0.78%)#16 | 1,871,898(0.03%)#438 |
| 17. | Trotwood | 585 | 79,267(0.74%)#17 | 1,871,898(0.03%)#473 |
| 18. | East Cleveland | 581 | 79,267(0.73%)#18 | 1,871,898(0.03%)#477 |
| 19. | Springdale | 574 | 79,267(0.72%)#19 | 1,871,898(0.03%)#484 |
| 20. | Forest Park | 519 | 79,267(0.65%)#20 | 1,871,898(0.03%)#540 |
| 21. | Warrensville Heights | 513 | 79,267(0.65%)#21 | 1,871,898(0.03%)#549 |
| 22. | Bowling Green | 480 | 79,267(0.61%)#22 | 1,871,898(0.03%)#590 |
| 23. | Finneytown | 467 | 79,267(0.59%)#23 | 1,871,898(0.02%)#614 |
| 24. | Huber Heights | 414 | 79,267(0.52%)#24 | 1,871,898(0.02%)#689 |
| 25. | Mason | 395 | 79,267(0.50%)#25 | 1,871,898(0.02%)#716 |
| 26. | Lorain | 387 | 79,267(0.49%)#26 | 1,871,898(0.02%)#736 |
| 27. | Alliance | 384 | 79,267(0.48%)#27 | 1,871,898(0.02%)#747 |
| 28. | Utica | 369 | 79,267(0.47%)#28 | 1,871,898(0.02%)#774 |
| 29. | Delaware | 368 | 79,267(0.46%)#29 | 1,871,898(0.02%)#777 |
| 30. | Kettering | 359 | 79,267(0.45%)#30 | 1,871,898(0.02%)#790 |
| 31. | Cleveland Heights | 357 | 79,267(0.45%)#31 | 1,871,898(0.02%)#793 |
| 32. | South Euclid | 352 | 79,267(0.44%)#32 | 1,871,898(0.02%)#807 |
| 33. | Hamilton | 347 | 79,267(0.44%)#33 | 1,871,898(0.02%)#820 |
| 34. | Elyria | 341 | 79,267(0.43%)#34 | 1,871,898(0.02%)#830 |
| 35. | Maple Heights | 299 | 79,267(0.38%)#35 | 1,871,898(0.02%)#914 |
| 36. | Loveland | 275 | 79,267(0.35%)#36 | 1,871,898(0.01%)#977 |
| 37. | Fairborn | 268 | 79,267(0.34%)#37 | 1,871,898(0.01%)#999 |
| 38. | Richmond Heights | 264 | 79,267(0.33%)#38 | 1,871,898(0.01%)#1,018 |
| 39. | Painesville | 254 | 79,267(0.32%)#39 | 1,871,898(0.01%)#1,059 |
| 40. | Springfield | 229 | 79,267(0.29%)#40 | 1,871,898(0.01%)#1,164 |
| 41. | Berea | 228 | 79,267(0.29%)#41 | 1,871,898(0.01%)#1,175 |
| 42. | Newark | 220 | 79,267(0.28%)#42 | 1,871,898(0.01%)#1,207 |
| 43. | Willoughby Hills | 219 | 79,267(0.28%)#43 | 1,871,898(0.01%)#1,215 |
| 44. | Westerville | 218 | 79,267(0.28%)#44 | 1,871,898(0.01%)#1,218 |
| 45. | Shaker Heights | 214 | 79,267(0.27%)#45 | 1,871,898(0.01%)#1,228 |
| 46. | Mansfield | 204 | 79,267(0.26%)#46 | 1,871,898(0.01%)#1,283 |
| 47. | Northbrook | 201 | 79,267(0.25%)#47 | 1,871,898(0.01%)#1,311 |
| 48. | Brooklyn | 191 | 79,267(0.24%)#48 | 1,871,898(0.01%)#1,369 |
| 49. | Defiance | 188 | 79,267(0.24%)#49 | 1,871,898(0.01%)#1,385 |
| 50. | Medina | 181 | 79,267(0.23%)#50 | 1,871,898(0.01%)#1,426 |
| 51. | Cadiz | 175 | 79,267(0.22%)#51 | 1,871,898(0.01%)#1,466 |
| 52. | Brook Park | 174 | 79,267(0.22%)#52 | 1,871,898(0.01%)#1,468 |
| 53. | Findlay | 172 | 79,267(0.22%)#53 | 1,871,898(0.01%)#1,474 |
| 54. | Marion | 172 | 79,267(0.22%)#54 | 1,871,898(0.01%)#1,475 |
| 55. | Garfield Heights | 161 | 79,267(0.20%)#55 | 1,871,898(0.01%)#1,541 |
| 56. | Solon | 136 | 79,267(0.17%)#56 | 1,871,898(0.01%)#1,713 |
| 57. | Bedford Heights | 136 | 79,267(0.17%)#57 | 1,871,898(0.01%)#1,715 |
| 58. | Warren | 134 | 79,267(0.17%)#58 | 1,871,898(0.01%)#1,730 |
| 59. | Beavercreek | 133 | 79,267(0.17%)#59 | 1,871,898(0.01%)#1,740 |
| 60. | Parma Heights | 130 | 79,267(0.16%)#60 | 1,871,898(0.01%)#1,758 |
| 61. | Toronto | 130 | 79,267(0.16%)#61 | 1,871,898(0.01%)#1,764 |
| 62. | Middletown | 129 | 79,267(0.16%)#62 | 1,871,898(0.01%)#1,767 |
| 63. | Brunswick | 127 | 79,267(0.16%)#63 | 1,871,898(0.01%)#1,794 |
| 64. | Blacklick Estates | 126 | 79,267(0.16%)#64 | 1,871,898(0.01%)#1,810 |
| 65. | Gahanna | 124 | 79,267(0.16%)#65 | 1,871,898(0.01%)#1,825 |
| 66. | Cuyahoga Falls | 122 | 79,267(0.15%)#66 | 1,871,898(0.01%)#1,846 |
| 67. | Parma | 117 | 79,267(0.15%)#67 | 1,871,898(0.01%)#1,885 |
| 68. | Norton | 116 | 79,267(0.15%)#68 | 1,871,898(0.01%)#1,899 |
| 69. | Athens | 109 | 79,267(0.14%)#69 | 1,871,898(0.01%)#1,974 |
| 70. | Wickliffe | 109 | 79,267(0.14%)#70 | 1,871,898(0.01%)#1,977 |
| 71. | St Bernard | 109 | 79,267(0.14%)#71 | 1,871,898(0.01%)#1,979 |
| 72. | Campbell | 108 | 79,267(0.14%)#72 | 1,871,898(0.01%)#1,986 |
| 73. | Struthers | 103 | 79,267(0.13%)#73 | 1,871,898(0.01%)#2,027 |
| 74. | East Liverpool | 103 | 79,267(0.13%)#74 | 1,871,898(0.01%)#2,028 |
| 75. | Bellaire | 103 | 79,267(0.13%)#75 | 1,871,898(0.01%)#2,033 |
| 76. | Grafton | 99 | 79,267(0.12%)#76 | 1,871,898(0.01%)#2,084 |
| 77. | St Clairsville | 97 | 79,267(0.12%)#77 | 1,871,898(0.01%)#2,111 |
| 78. | Fremont | 95 | 79,267(0.12%)#78 | 1,871,898(0.01%)#2,133 |
| 79. | Ottawa | 95 | 79,267(0.12%)#79 | 1,871,898(0.01%)#2,137 |
| 80. | Fort Mckinley | 95 | 79,267(0.12%)#80 | 1,871,898(0.01%)#2,138 |
| 81. | Middlebranch | 95 | 79,267(0.12%)#81 | 1,871,898(0.01%)#2,140 |
| 82. | Pleasant Run | 88 | 79,267(0.11%)#82 | 1,871,898(0.00%)#2,226 |
| 83. | Centerville | 87 | 79,267(0.11%)#83 | 1,871,898(0.00%)#2,231 |
| 84. | Martins Ferry | 86 | 79,267(0.11%)#84 | 1,871,898(0.00%)#2,263 |
| 85. | Union | 84 | 79,267(0.11%)#85 | 1,871,898(0.00%)#2,300 |
| 86. | Xenia | 80 | 79,267(0.10%)#86 | 1,871,898(0.00%)#2,353 |
| 87. | Mineral Ridge | 80 | 79,267(0.10%)#87 | 1,871,898(0.00%)#2,358 |
| 88. | Pataskala | 77 | 79,267(0.10%)#88 | 1,871,898(0.00%)#2,399 |
| 89. | University Heights | 77 | 79,267(0.10%)#89 | 1,871,898(0.00%)#2,402 |
| 90. | Fairlawn | 77 | 79,267(0.10%)#90 | 1,871,898(0.00%)#2,408 |
| 91. | Wintersville | 77 | 79,267(0.10%)#91 | 1,871,898(0.00%)#2,411 |
| 92. | Stow | 75 | 79,267(0.09%)#92 | 1,871,898(0.00%)#2,441 |
| 93. | Fort Shawnee | 75 | 79,267(0.09%)#93 | 1,871,898(0.00%)#2,452 |
| 94. | West Carrollton | 74 | 79,267(0.09%)#94 | 1,871,898(0.00%)#2,472 |
| 95. | Westlake | 72 | 79,267(0.09%)#95 | 1,871,898(0.00%)#2,505 |
| 96. | Kent | 72 | 79,267(0.09%)#96 | 1,871,898(0.00%)#2,509 |
| 97. | Pickerington | 72 | 79,267(0.09%)#97 | 1,871,898(0.00%)#2,513 |
| 98. | Cambridge | 72 | 79,267(0.09%)#98 | 1,871,898(0.00%)#2,516 |
| 99. | Ashtabula | 69 | 79,267(0.09%)#99 | 1,871,898(0.00%)#2,573 |
| 100. | Portage | 69 | 79,267(0.09%)#100 | 1,871,898(0.00%)#2,585 |
Common Questions
What are the Top 10 Cities with the Largest African Community in Ohio?
Top 10 Cities with the Largest African Community in Ohio are:
#1
13,400
#2
7,196
#3
5,204
#4
4,722
#5
3,491
#6
3,235
#7
2,567
#8
1,747
#9
1,483
#10
1,411
What city has the Largest African Community in Ohio?
Columbus has the Largest African Community in Ohio with 13,400.
What is the Total African Population in the State of Ohio?
Total African Population in Ohio is 79,267.
What is the Total African Population in the United States?
Total African Population in the United States is 1,871,898.