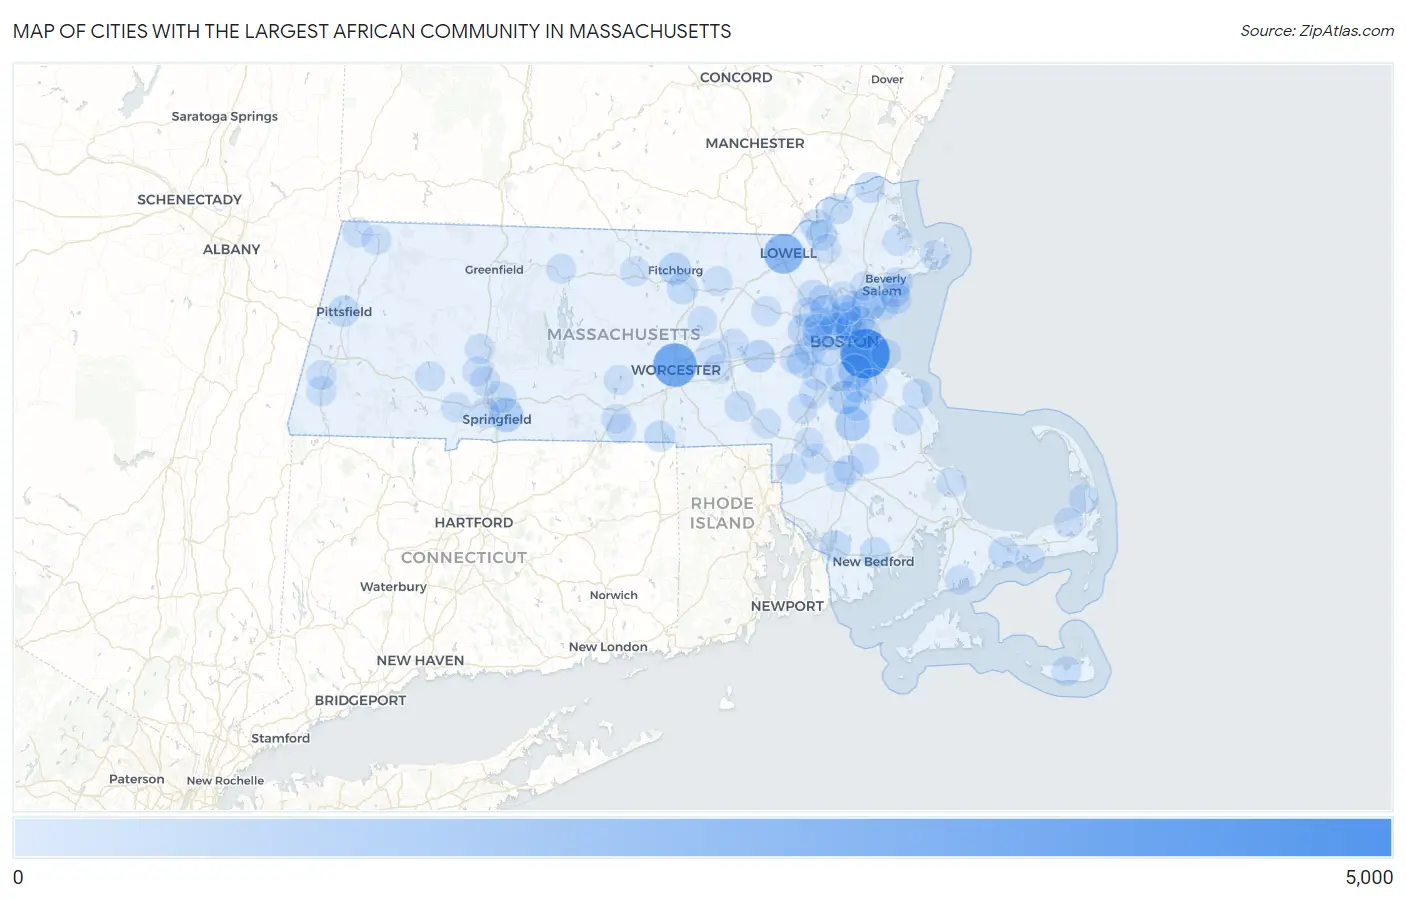
Cities with the Largest African Community in Massachusetts
RELATED REPORTS & OPTIONS
African
Massachusetts
Compare Cities
Map of Cities with the Largest African Community in Massachusetts
0
5,000
Cities with the Largest African Community in Massachusetts
| City | African | vs State | vs National | |
| 1. | Boston | 4,881 | 32,213(15.15%)#1 | 1,871,898(0.26%)#36 |
| 2. | Worcester | 3,354 | 32,213(10.41%)#2 | 1,871,898(0.18%)#61 |
| 3. | Lowell | 2,381 | 32,213(7.39%)#3 | 1,871,898(0.13%)#98 |
| 4. | Lynn | 1,061 | 32,213(3.29%)#4 | 1,871,898(0.06%)#235 |
| 5. | Brockton | 1,051 | 32,213(3.26%)#5 | 1,871,898(0.06%)#239 |
| 6. | Springfield | 949 | 32,213(2.95%)#6 | 1,871,898(0.05%)#269 |
| 7. | Quincy | 933 | 32,213(2.90%)#7 | 1,871,898(0.05%)#276 |
| 8. | Randolph Town | 928 | 32,213(2.88%)#8 | 1,871,898(0.05%)#277 |
| 9. | Cambridge | 729 | 32,213(2.26%)#9 | 1,871,898(0.04%)#361 |
| 10. | Malden | 665 | 32,213(2.06%)#10 | 1,871,898(0.04%)#398 |
| 11. | Framingham | 549 | 32,213(1.70%)#11 | 1,871,898(0.03%)#506 |
| 12. | Waltham | 549 | 32,213(1.70%)#12 | 1,871,898(0.03%)#507 |
| 13. | Fitchburg | 548 | 32,213(1.70%)#13 | 1,871,898(0.03%)#510 |
| 14. | Salem | 477 | 32,213(1.48%)#14 | 1,871,898(0.03%)#595 |
| 15. | Everett | 441 | 32,213(1.37%)#15 | 1,871,898(0.02%)#648 |
| 16. | Weymouth Town | 440 | 32,213(1.37%)#16 | 1,871,898(0.02%)#651 |
| 17. | Methuen Town | 427 | 32,213(1.33%)#17 | 1,871,898(0.02%)#667 |
| 18. | Somerville | 389 | 32,213(1.21%)#18 | 1,871,898(0.02%)#731 |
| 19. | Fall River | 305 | 32,213(0.95%)#19 | 1,871,898(0.02%)#891 |
| 20. | Pittsfield | 302 | 32,213(0.94%)#20 | 1,871,898(0.02%)#901 |
| 21. | Leominster | 296 | 32,213(0.92%)#21 | 1,871,898(0.02%)#921 |
| 22. | Barnstable Town | 279 | 32,213(0.87%)#22 | 1,871,898(0.01%)#966 |
| 23. | Webster | 263 | 32,213(0.82%)#23 | 1,871,898(0.01%)#1,026 |
| 24. | Haverhill | 260 | 32,213(0.81%)#24 | 1,871,898(0.01%)#1,035 |
| 25. | Needham | 255 | 32,213(0.79%)#25 | 1,871,898(0.01%)#1,055 |
| 26. | Amesbury Town | 247 | 32,213(0.77%)#26 | 1,871,898(0.01%)#1,090 |
| 27. | Chicopee | 243 | 32,213(0.75%)#27 | 1,871,898(0.01%)#1,101 |
| 28. | Taunton | 242 | 32,213(0.75%)#28 | 1,871,898(0.01%)#1,105 |
| 29. | Chelsea | 242 | 32,213(0.75%)#29 | 1,871,898(0.01%)#1,107 |
| 30. | New Bedford | 231 | 32,213(0.72%)#30 | 1,871,898(0.01%)#1,156 |
| 31. | Lawrence | 228 | 32,213(0.71%)#31 | 1,871,898(0.01%)#1,172 |
| 32. | Amherst | 210 | 32,213(0.65%)#32 | 1,871,898(0.01%)#1,254 |
| 33. | Newton | 198 | 32,213(0.61%)#33 | 1,871,898(0.01%)#1,326 |
| 34. | Attleboro | 183 | 32,213(0.57%)#34 | 1,871,898(0.01%)#1,412 |
| 35. | Milford | 177 | 32,213(0.55%)#35 | 1,871,898(0.01%)#1,458 |
| 36. | Marblehead | 162 | 32,213(0.50%)#36 | 1,871,898(0.01%)#1,539 |
| 37. | Burlington | 130 | 32,213(0.40%)#37 | 1,871,898(0.01%)#1,756 |
| 38. | Watertown Town | 128 | 32,213(0.40%)#38 | 1,871,898(0.01%)#1,784 |
| 39. | Revere | 124 | 32,213(0.38%)#39 | 1,871,898(0.01%)#1,824 |
| 40. | Arlington | 109 | 32,213(0.34%)#40 | 1,871,898(0.01%)#1,968 |
| 41. | Medford | 103 | 32,213(0.32%)#41 | 1,871,898(0.01%)#2,021 |
| 42. | Lexington | 102 | 32,213(0.32%)#42 | 1,871,898(0.01%)#2,035 |
| 43. | Bridgewater Town | 102 | 32,213(0.32%)#43 | 1,871,898(0.01%)#2,036 |
| 44. | Beverly | 100 | 32,213(0.31%)#44 | 1,871,898(0.01%)#2,061 |
| 45. | Woburn | 93 | 32,213(0.29%)#45 | 1,871,898(0.00%)#2,147 |
| 46. | Scituate | 83 | 32,213(0.26%)#46 | 1,871,898(0.00%)#2,316 |
| 47. | North Attleborough | 77 | 32,213(0.24%)#47 | 1,871,898(0.00%)#2,394 |
| 48. | Dedham | 77 | 32,213(0.24%)#48 | 1,871,898(0.00%)#2,396 |
| 49. | North Pembroke | 76 | 32,213(0.24%)#49 | 1,871,898(0.00%)#2,430 |
| 50. | Braintree Town | 72 | 32,213(0.22%)#50 | 1,871,898(0.00%)#2,504 |
| 51. | Wellesley | 72 | 32,213(0.22%)#51 | 1,871,898(0.00%)#2,507 |
| 52. | Saugus | 72 | 32,213(0.22%)#52 | 1,871,898(0.00%)#2,508 |
| 53. | Milton | 66 | 32,213(0.20%)#53 | 1,871,898(0.00%)#2,621 |
| 54. | West Springfield Town | 59 | 32,213(0.18%)#54 | 1,871,898(0.00%)#2,777 |
| 55. | Winchester | 54 | 32,213(0.17%)#55 | 1,871,898(0.00%)#2,919 |
| 56. | Melrose | 51 | 32,213(0.16%)#56 | 1,871,898(0.00%)#3,004 |
| 57. | Belmont | 51 | 32,213(0.16%)#57 | 1,871,898(0.00%)#3,009 |
| 58. | Holyoke | 50 | 32,213(0.16%)#58 | 1,871,898(0.00%)#3,038 |
| 59. | Brookline | 46 | 32,213(0.14%)#59 | 1,871,898(0.00%)#3,177 |
| 60. | Winthrop Town | 44 | 32,213(0.14%)#60 | 1,871,898(0.00%)#3,252 |
| 61. | Gardner | 41 | 32,213(0.13%)#61 | 1,871,898(0.00%)#3,347 |
| 62. | Norwood | 39 | 32,213(0.12%)#62 | 1,871,898(0.00%)#3,427 |
| 63. | Gloucester | 39 | 32,213(0.12%)#63 | 1,871,898(0.00%)#3,428 |
| 64. | Norton Center | 39 | 32,213(0.12%)#64 | 1,871,898(0.00%)#3,462 |
| 65. | Swampscott | 38 | 32,213(0.12%)#65 | 1,871,898(0.00%)#3,486 |
| 66. | North Eastham | 35 | 32,213(0.11%)#66 | 1,871,898(0.00%)#3,639 |
| 67. | Holbrook | 34 | 32,213(0.11%)#67 | 1,871,898(0.00%)#3,665 |
| 68. | Great Barrington | 34 | 32,213(0.11%)#68 | 1,871,898(0.00%)#3,690 |
| 69. | Oak Bluffs | 32 | 32,213(0.10%)#69 | 1,871,898(0.00%)#3,770 |
| 70. | Walpole | 30 | 32,213(0.09%)#70 | 1,871,898(0.00%)#3,849 |
| 71. | Orange | 30 | 32,213(0.09%)#71 | 1,871,898(0.00%)#3,859 |
| 72. | Marlborough | 28 | 32,213(0.09%)#72 | 1,871,898(0.00%)#3,926 |
| 73. | Northampton | 23 | 32,213(0.07%)#73 | 1,871,898(0.00%)#4,209 |
| 74. | West Yarmouth | 22 | 32,213(0.07%)#74 | 1,871,898(0.00%)#4,305 |
| 75. | Williamstown | 22 | 32,213(0.07%)#75 | 1,871,898(0.00%)#4,312 |
| 76. | Southbridge Town | 21 | 32,213(0.07%)#76 | 1,871,898(0.00%)#4,357 |
| 77. | Wakefield | 20 | 32,213(0.06%)#77 | 1,871,898(0.00%)#4,418 |
| 78. | Sturbridge | 19 | 32,213(0.06%)#78 | 1,871,898(0.00%)#4,546 |
| 79. | Westfield | 18 | 32,213(0.06%)#79 | 1,871,898(0.00%)#4,578 |
| 80. | Northborough | 18 | 32,213(0.06%)#80 | 1,871,898(0.00%)#4,624 |
| 81. | Westborough | 18 | 32,213(0.06%)#81 | 1,871,898(0.00%)#4,635 |
| 82. | The Pinehills | 17 | 32,213(0.05%)#82 | 1,871,898(0.00%)#4,720 |
| 83. | Clinton | 16 | 32,213(0.05%)#83 | 1,871,898(0.00%)#4,817 |
| 84. | Brewster | 16 | 32,213(0.05%)#84 | 1,871,898(0.00%)#4,847 |
| 85. | North Adams | 14 | 32,213(0.04%)#85 | 1,871,898(0.00%)#4,996 |
| 86. | Peabody | 13 | 32,213(0.04%)#86 | 1,871,898(0.00%)#5,076 |
| 87. | West Concord | 11 | 32,213(0.03%)#87 | 1,871,898(0.00%)#5,345 |
| 88. | Raynham Center | 10 | 32,213(0.03%)#88 | 1,871,898(0.00%)#5,492 |
| 89. | Devens | 10 | 32,213(0.03%)#89 | 1,871,898(0.00%)#5,528 |
| 90. | Nantucket | 8 | 32,213(0.02%)#90 | 1,871,898(0.00%)#5,756 |
| 91. | East Falmouth | 8 | 32,213(0.02%)#91 | 1,871,898(0.00%)#5,774 |
| 92. | Franklin Town | 7 | 32,213(0.02%)#92 | 1,871,898(0.00%)#5,863 |
| 93. | Hull | 7 | 32,213(0.02%)#93 | 1,871,898(0.00%)#5,886 |
| 94. | Ipswich | 7 | 32,213(0.02%)#94 | 1,871,898(0.00%)#5,910 |
| 95. | Andover | 6 | 32,213(0.02%)#95 | 1,871,898(0.00%)#6,064 |
| 96. | Huntington | 6 | 32,213(0.02%)#96 | 1,871,898(0.00%)#6,178 |
| 97. | Mansfield Center | 5 | 32,213(0.02%)#97 | 1,871,898(0.00%)#6,255 |
| 98. | East Brookfield | 3 | 32,213(0.01%)#98 | 1,871,898(0.00%)#6,678 |
| 99. | Housatonic | 3 | 32,213(0.01%)#99 | 1,871,898(0.00%)#6,705 |
| 100. | Easthampton Town | 2 | 32,213(0.01%)#100 | 1,871,898(0.00%)#6,798 |
Common Questions
What are the Top 10 Cities with the Largest African Community in Massachusetts?
Top 10 Cities with the Largest African Community in Massachusetts are:
#1
4,881
#2
3,354
#3
2,381
#4
1,061
#5
1,051
#6
949
#7
933
#8
928
#9
729
#10
665
What city has the Largest African Community in Massachusetts?
Boston has the Largest African Community in Massachusetts with 4,881.
What is the Total African Population in the State of Massachusetts?
Total African Population in Massachusetts is 32,213.
What is the Total African Population in the United States?
Total African Population in the United States is 1,871,898.