Yucaipa, CA Map & Demographics
Yucaipa Map
Yucaipa Overview
$36,729
PER CAPITA INCOME
$108,106
AVG FAMILY INCOME
$85,075
AVG HOUSEHOLD INCOME
31.7%
WAGE / INCOME GAP [ % ]
68.3¢/ $1
WAGE / INCOME GAP [ $ ]
$8,660
FAMILY INCOME DEFICIT
0.43
INEQUALITY / GINI INDEX
54,428
TOTAL POPULATION
26,512
MALE POPULATION
27,916
FEMALE POPULATION
94.97
MALES / 100 FEMALES
105.30
FEMALES / 100 MALES
36.4
MEDIAN AGE
3.4
AVG FAMILY SIZE
2.9
AVG HOUSEHOLD SIZE
25,967
LABOR FORCE [ PEOPLE ]
61.8%
PERCENT IN LABOR FORCE
6.8%
UNEMPLOYMENT RATE
Yucaipa Zip Codes
Yucaipa Area Codes
Income in Yucaipa
Income Overview in Yucaipa
Per Capita Income in Yucaipa is $36,729, while median incomes of families and households are $108,106 and $85,075 respectively.
| Characteristic | Number | Measure |
| Per Capita Income | 54,428 | $36,729 |
| Median Family Income | 13,826 | $108,106 |
| Mean Family Income | 13,826 | $122,181 |
| Median Household Income | 18,593 | $85,075 |
| Mean Household Income | 18,593 | $105,783 |
| Income Deficit | 13,826 | $8,660 |
| Wage / Income Gap (%) | 54,428 | 31.69% |
| Wage / Income Gap ($) | 54,428 | 68.31¢ per $1 |
| Gini / Inequality Index | 54,428 | 0.43 |
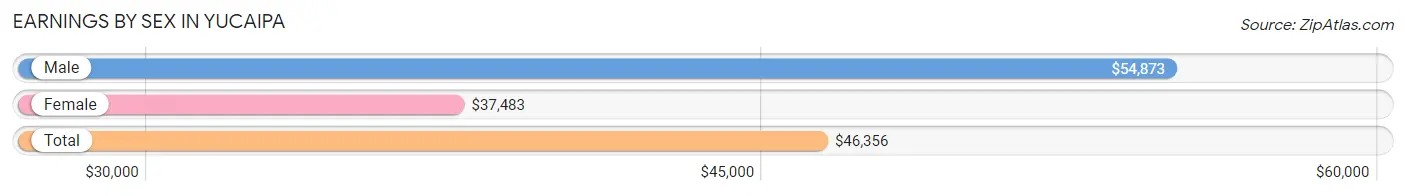
Earnings by Sex in Yucaipa
Average Earnings in Yucaipa are $46,356, $54,873 for men and $37,483 for women, a difference of 31.7%.
| Sex | Number | Average Earnings |
| Male | 14,492 (54.3%) | $54,873 |
| Female | 12,211 (45.7%) | $37,483 |
| Total | 26,703 (100.0%) | $46,356 |
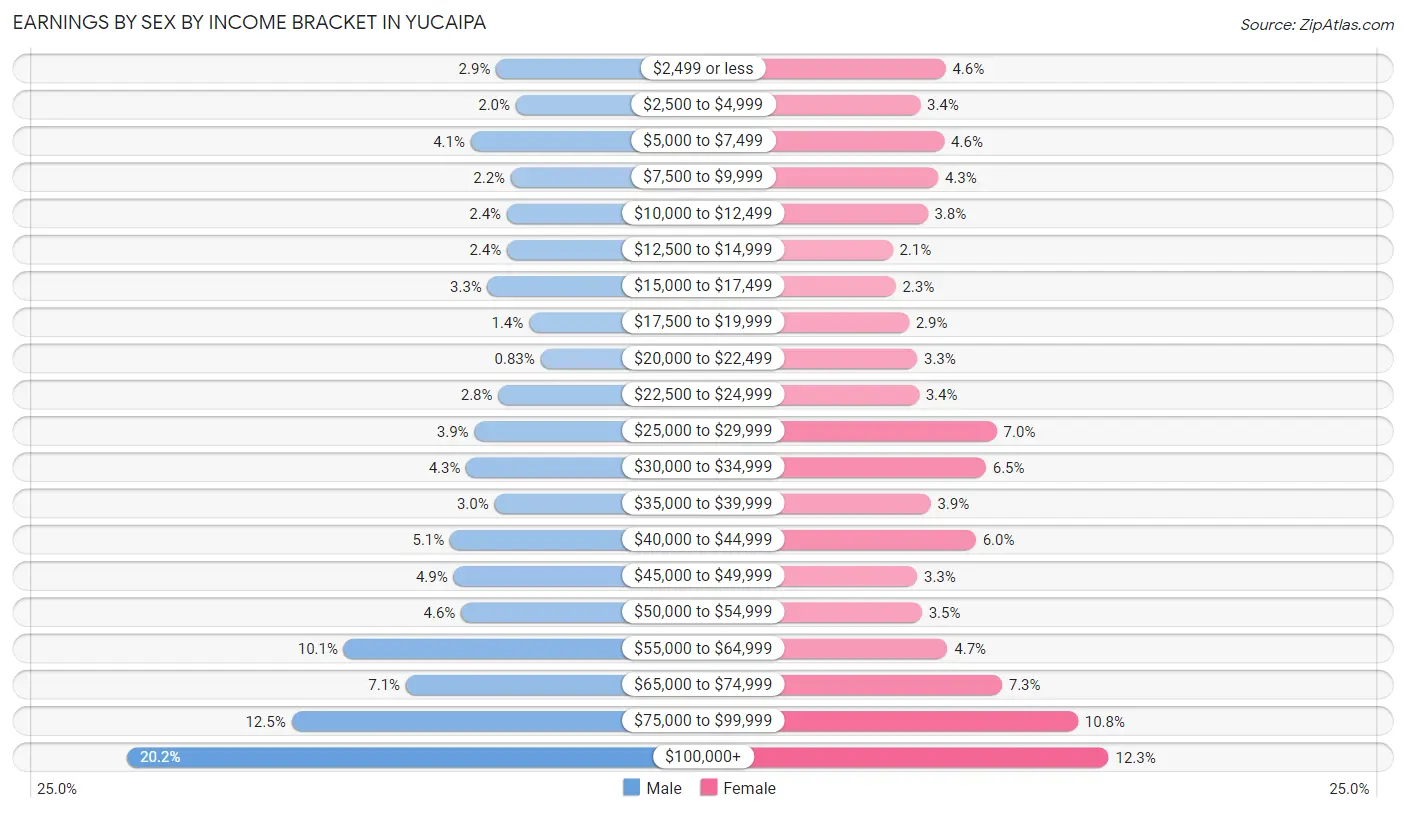
Earnings by Sex by Income Bracket in Yucaipa
The most common earnings brackets in Yucaipa are $100,000+ for men (2,927 | 20.2%) and $100,000+ for women (1,497 | 12.3%).
| Income | Male | Female |
| $2,499 or less | 422 (2.9%) | 564 (4.6%) |
| $2,500 to $4,999 | 288 (2.0%) | 419 (3.4%) |
| $5,000 to $7,499 | 594 (4.1%) | 557 (4.6%) |
| $7,500 to $9,999 | 321 (2.2%) | 522 (4.3%) |
| $10,000 to $12,499 | 349 (2.4%) | 462 (3.8%) |
| $12,500 to $14,999 | 348 (2.4%) | 261 (2.1%) |
| $15,000 to $17,499 | 480 (3.3%) | 279 (2.3%) |
| $17,500 to $19,999 | 199 (1.4%) | 354 (2.9%) |
| $20,000 to $22,499 | 121 (0.8%) | 402 (3.3%) |
| $22,500 to $24,999 | 407 (2.8%) | 412 (3.4%) |
| $25,000 to $29,999 | 569 (3.9%) | 857 (7.0%) |
| $30,000 to $34,999 | 624 (4.3%) | 795 (6.5%) |
| $35,000 to $39,999 | 434 (3.0%) | 479 (3.9%) |
| $40,000 to $44,999 | 735 (5.1%) | 738 (6.0%) |
| $45,000 to $49,999 | 712 (4.9%) | 402 (3.3%) |
| $50,000 to $54,999 | 659 (4.5%) | 428 (3.5%) |
| $55,000 to $64,999 | 1,457 (10.1%) | 575 (4.7%) |
| $65,000 to $74,999 | 1,035 (7.1%) | 887 (7.3%) |
| $75,000 to $99,999 | 1,811 (12.5%) | 1,321 (10.8%) |
| $100,000+ | 2,927 (20.2%) | 1,497 (12.3%) |
| Total | 14,492 (100.0%) | 12,211 (100.0%) |
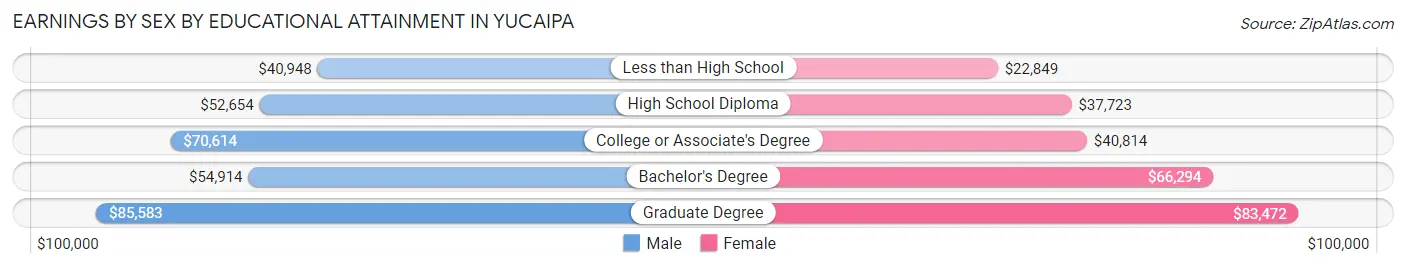
Earnings by Sex by Educational Attainment in Yucaipa
Average earnings in Yucaipa are $59,833 for men and $43,096 for women, a difference of 28.0%. Men with an educational attainment of graduate degree enjoy the highest average annual earnings of $85,583, while those with less than high school education earn the least with $40,948. Women with an educational attainment of graduate degree earn the most with the average annual earnings of $83,472, while those with less than high school education have the smallest earnings of $22,849.
| Educational Attainment | Male Income | Female Income |
| Less than High School | $40,948 | $22,849 |
| High School Diploma | $52,654 | $37,723 |
| College or Associate's Degree | $70,614 | $40,814 |
| Bachelor's Degree | $54,914 | $66,294 |
| Graduate Degree | $85,583 | $83,472 |
| Total | $59,833 | $43,096 |
Family Income in Yucaipa
Family Income Brackets in Yucaipa
According to the Yucaipa family income data, there are 2,848 families falling into the $100,000 to $149,999 income range, which is the most common income bracket and makes up 20.6% of all families. Conversely, the less than $10,000 income bracket is the least frequent group with only 235 families (1.7%) belonging to this category.
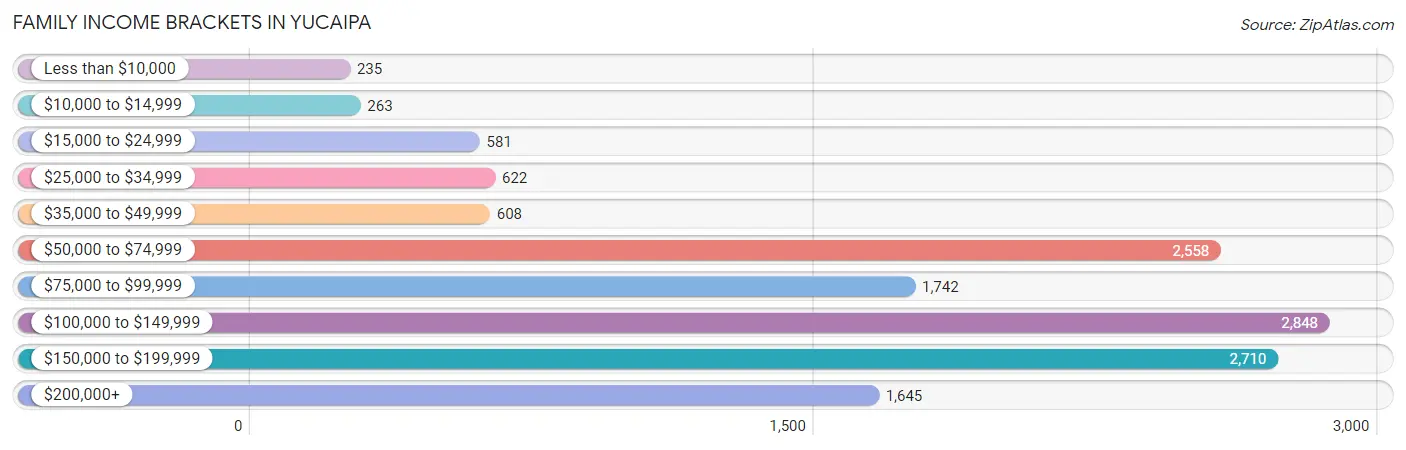
| Income Bracket | # Families | % Families |
| Less than $10,000 | 235 | 1.7% |
| $10,000 to $14,999 | 263 | 1.9% |
| $15,000 to $24,999 | 581 | 4.2% |
| $25,000 to $34,999 | 622 | 4.5% |
| $35,000 to $49,999 | 608 | 4.4% |
| $50,000 to $74,999 | 2,558 | 18.5% |
| $75,000 to $99,999 | 1,742 | 12.6% |
| $100,000 to $149,999 | 2,848 | 20.6% |
| $150,000 to $199,999 | 2,710 | 19.6% |
| $200,000+ | 1,645 | 11.9% |
Family Income by Famaliy Size in Yucaipa
7+ person families (338 | 2.4%) account for the highest median family income in Yucaipa with $178,125 per family, while 3-person families (2,702 | 19.5%) have the highest median income of $39,299 per family member.
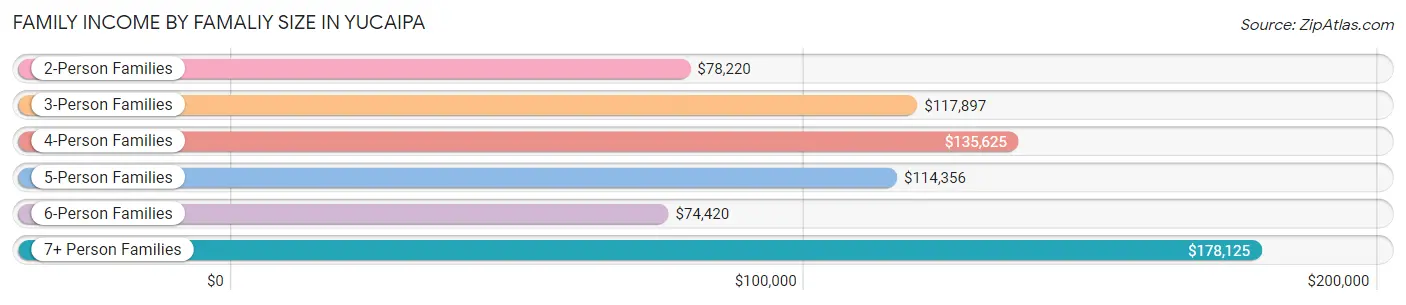
| Income Bracket | # Families | Median Income |
| 2-Person Families | 5,655 (40.9%) | $78,220 |
| 3-Person Families | 2,702 (19.5%) | $117,897 |
| 4-Person Families | 3,198 (23.1%) | $135,625 |
| 5-Person Families | 1,287 (9.3%) | $114,356 |
| 6-Person Families | 646 (4.7%) | $74,420 |
| 7+ Person Families | 338 (2.4%) | $178,125 |
| Total | 13,826 (100.0%) | $108,106 |
Family Income by Number of Earners in Yucaipa
The median family income in Yucaipa is $108,106, with families comprising 3+ earners (2,352) having the highest median family income of $148,824, while families with no earners (1,804) have the lowest median family income of $47,201, accounting for 17.0% and 13.1% of families, respectively.
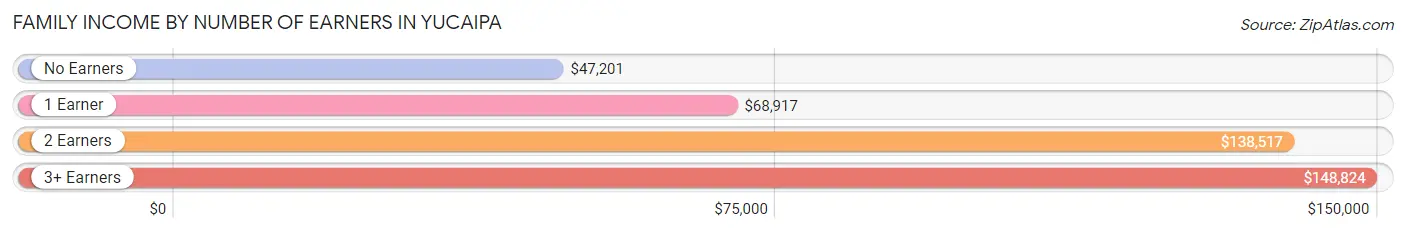
| Number of Earners | # Families | Median Income |
| No Earners | 1,804 (13.1%) | $47,201 |
| 1 Earner | 4,278 (30.9%) | $68,917 |
| 2 Earners | 5,392 (39.0%) | $138,517 |
| 3+ Earners | 2,352 (17.0%) | $148,824 |
| Total | 13,826 (100.0%) | $108,106 |
Household Income in Yucaipa
Household Income Brackets in Yucaipa
With 3,533 households falling in the category, the $100,000 to $149,999 income range is the most frequent in Yucaipa, accounting for 19.0% of all households. In contrast, only 632 households (3.4%) fall into the $10,000 to $14,999 income bracket, making it the least populous group.
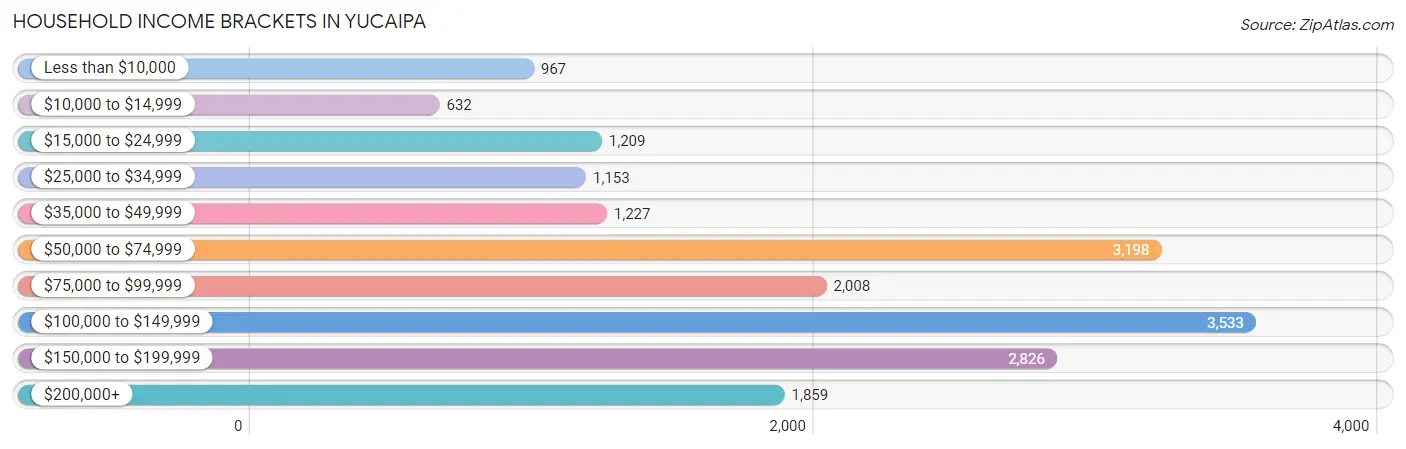
| Income Bracket | # Households | % Households |
| Less than $10,000 | 967 | 5.2% |
| $10,000 to $14,999 | 632 | 3.4% |
| $15,000 to $24,999 | 1,209 | 6.5% |
| $25,000 to $34,999 | 1,153 | 6.2% |
| $35,000 to $49,999 | 1,227 | 6.6% |
| $50,000 to $74,999 | 3,198 | 17.2% |
| $75,000 to $99,999 | 2,008 | 10.8% |
| $100,000 to $149,999 | 3,533 | 19.0% |
| $150,000 to $199,999 | 2,826 | 15.2% |
| $200,000+ | 1,859 | 10.0% |
Household Income by Householder Age in Yucaipa
The median household income in Yucaipa is $85,075, with the highest median household income of $113,163 found in the 45 to 64 years age bracket for the primary householder. A total of 7,759 households (41.7%) fall into this category. Meanwhile, the 65+ years age bracket for the primary householder has the lowest median household income of $50,925, with 5,170 households (27.8%) in this group.
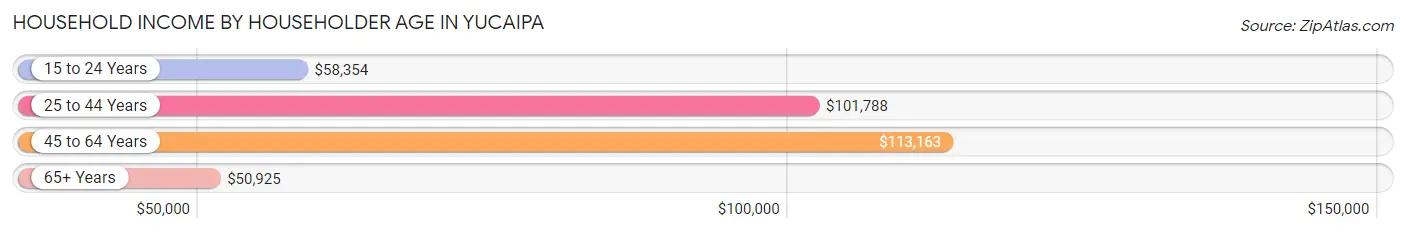
| Income Bracket | # Households | Median Income |
| 15 to 24 Years | 212 (1.1%) | $58,354 |
| 25 to 44 Years | 5,452 (29.3%) | $101,788 |
| 45 to 64 Years | 7,759 (41.7%) | $113,163 |
| 65+ Years | 5,170 (27.8%) | $50,925 |
| Total | 18,593 (100.0%) | $85,075 |
Poverty in Yucaipa
Income Below Poverty by Sex and Age in Yucaipa
With 7.7% poverty level for males and 9.3% for females among the residents of Yucaipa, 65 to 74 year old males and 75 year old and over females are the most vulnerable to poverty, with 416 males (16.7%) and 442 females (22.7%) in their respective age groups living below the poverty level.
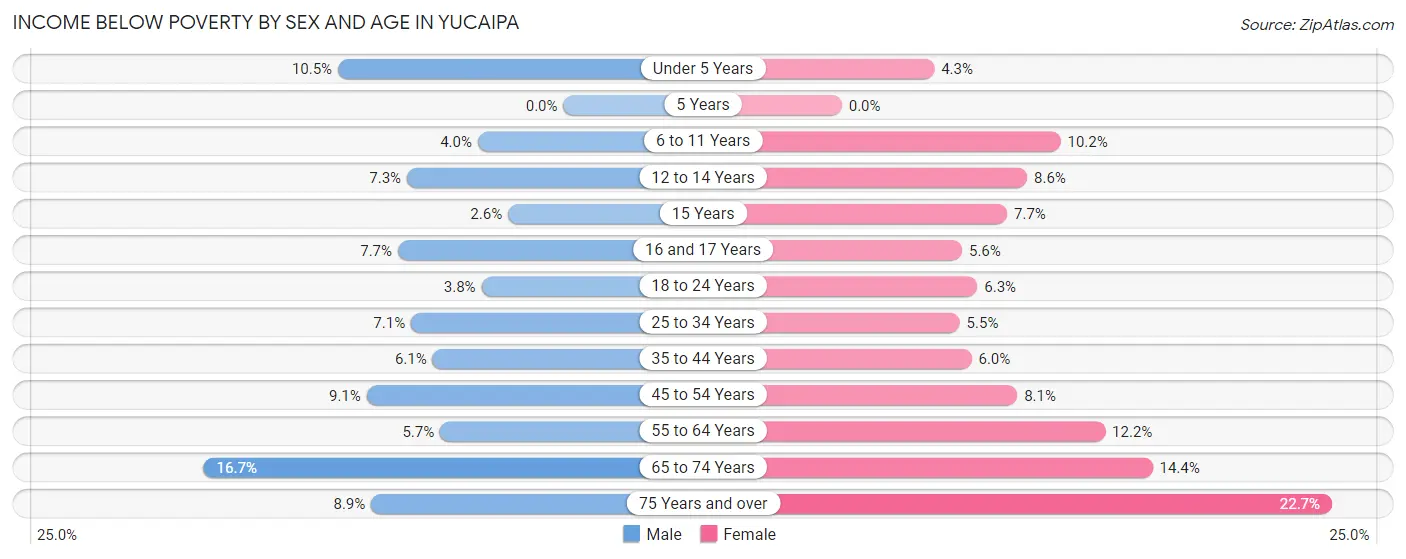
| Age Bracket | Male | Female |
| Under 5 Years | 188 (10.5%) | 82 (4.3%) |
| 5 Years | 0 (0.0%) | 0 (0.0%) |
| 6 to 11 Years | 81 (4.0%) | 241 (10.2%) |
| 12 to 14 Years | 78 (7.3%) | 103 (8.6%) |
| 15 Years | 12 (2.6%) | 29 (7.7%) |
| 16 and 17 Years | 72 (7.7%) | 35 (5.6%) |
| 18 to 24 Years | 91 (3.8%) | 136 (6.3%) |
| 25 to 34 Years | 273 (7.1%) | 207 (5.5%) |
| 35 to 44 Years | 166 (6.1%) | 161 (6.0%) |
| 45 to 54 Years | 361 (9.1%) | 265 (8.1%) |
| 55 to 64 Years | 183 (5.7%) | 452 (12.2%) |
| 65 to 74 Years | 416 (16.7%) | 410 (14.4%) |
| 75 Years and over | 100 (8.9%) | 442 (22.7%) |
| Total | 2,021 (7.7%) | 2,563 (9.3%) |
Income Above Poverty by Sex and Age in Yucaipa
According to the poverty statistics in Yucaipa, males aged 5 years and females aged 5 years are the age groups that are most secure financially, with 100.0% of males and 100.0% of females in these age groups living above the poverty line.
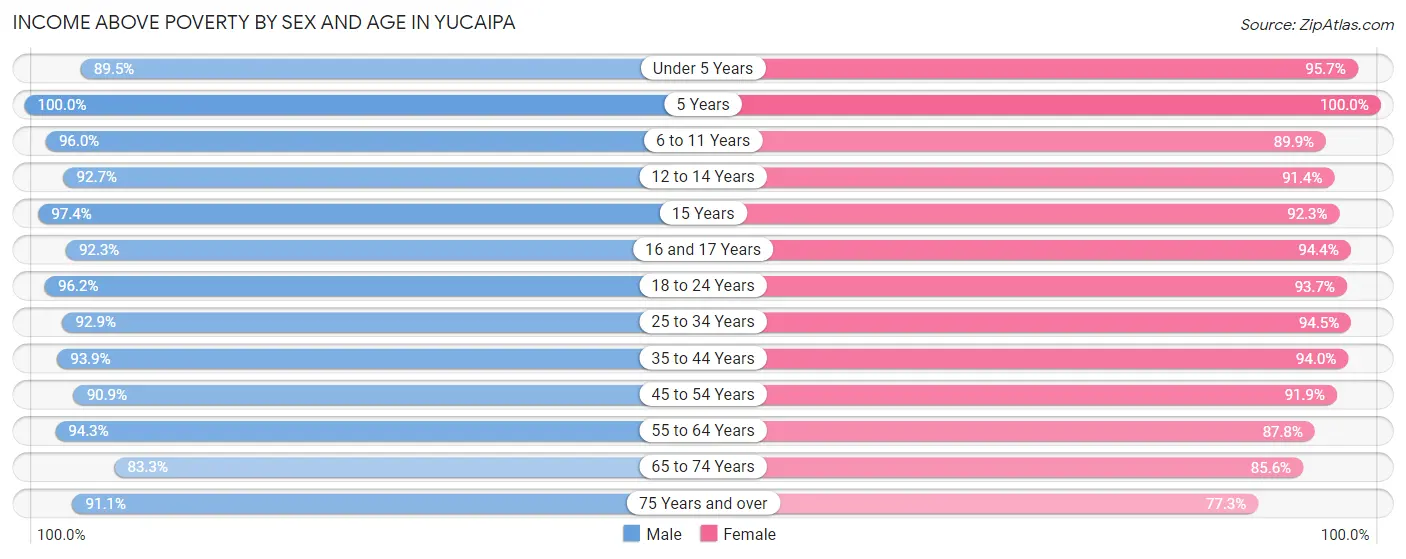
| Age Bracket | Male | Female |
| Under 5 Years | 1,610 (89.5%) | 1,828 (95.7%) |
| 5 Years | 248 (100.0%) | 820 (100.0%) |
| 6 to 11 Years | 1,960 (96.0%) | 2,133 (89.8%) |
| 12 to 14 Years | 996 (92.7%) | 1,095 (91.4%) |
| 15 Years | 455 (97.4%) | 349 (92.3%) |
| 16 and 17 Years | 865 (92.3%) | 592 (94.4%) |
| 18 to 24 Years | 2,305 (96.2%) | 2,025 (93.7%) |
| 25 to 34 Years | 3,590 (92.9%) | 3,576 (94.5%) |
| 35 to 44 Years | 2,570 (93.9%) | 2,515 (94.0%) |
| 45 to 54 Years | 3,593 (90.9%) | 2,990 (91.9%) |
| 55 to 64 Years | 3,017 (94.3%) | 3,248 (87.8%) |
| 65 to 74 Years | 2,076 (83.3%) | 2,433 (85.6%) |
| 75 Years and over | 1,021 (91.1%) | 1,502 (77.3%) |
| Total | 24,306 (92.3%) | 25,106 (90.7%) |
Income Below Poverty Among Married-Couple Families in Yucaipa
The poverty statistics for married-couple families in Yucaipa show that 5.5% or 586 of the total 10,665 families live below the poverty line. Families with no children have the highest poverty rate of 6.1%, comprising of 342 families. On the other hand, families with 5 or more children have the lowest poverty rate of 0.0%, which includes 0 families.
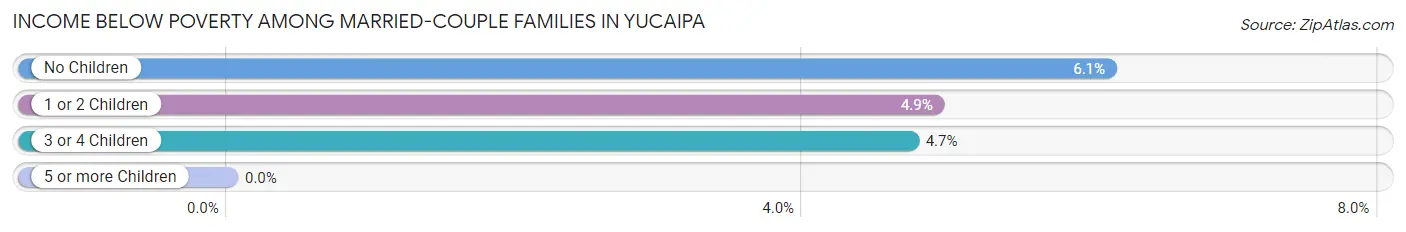
| Children | Above Poverty | Below Poverty |
| No Children | 5,246 (93.9%) | 342 (6.1%) |
| 1 or 2 Children | 3,536 (95.1%) | 183 (4.9%) |
| 3 or 4 Children | 1,226 (95.3%) | 61 (4.7%) |
| 5 or more Children | 71 (100.0%) | 0 (0.0%) |
| Total | 10,079 (94.5%) | 586 (5.5%) |
Income Below Poverty Among Single-Parent Households in Yucaipa
According to the poverty data in Yucaipa, 4.8% or 45 single-father households and 13.8% or 306 single-mother households are living below the poverty line. Among single-father households, those with no children have the highest poverty rate, with 34 households (9.7%) experiencing poverty. Likewise, among single-mother households, those with 3 or 4 children have the highest poverty rate, with 33 households (22.5%) falling below the poverty line.
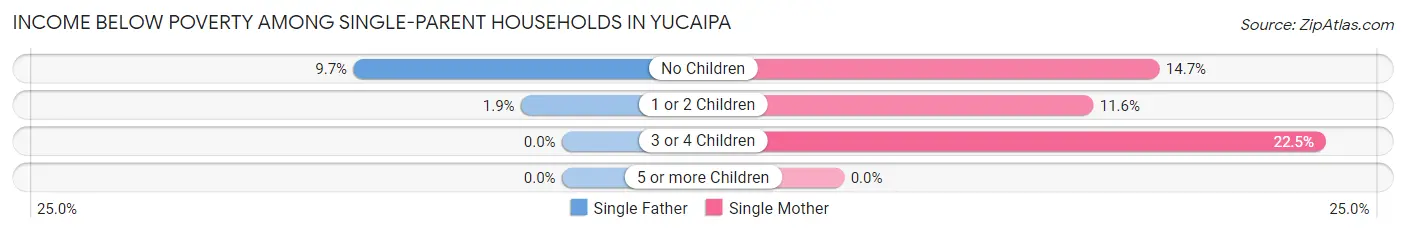
| Children | Single Father | Single Mother |
| No Children | 34 (9.7%) | 159 (14.7%) |
| 1 or 2 Children | 11 (1.9%) | 114 (11.6%) |
| 3 or 4 Children | 0 (0.0%) | 33 (22.5%) |
| 5 or more Children | 0 (0.0%) | 0 (0.0%) |
| Total | 45 (4.8%) | 306 (13.8%) |
Income Below Poverty Among Married-Couple vs Single-Parent Households in Yucaipa
The poverty data for Yucaipa shows that 586 of the married-couple family households (5.5%) and 351 of the single-parent households (11.1%) are living below the poverty level. Within the married-couple family households, those with no children have the highest poverty rate, with 342 households (6.1%) falling below the poverty line. Among the single-parent households, those with 3 or 4 children have the highest poverty rate, with 33 household (19.5%) living below poverty.
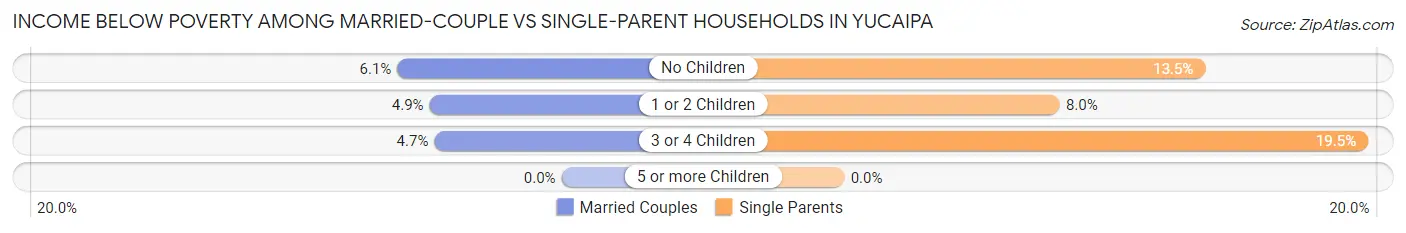
| Children | Married-Couple Families | Single-Parent Households |
| No Children | 342 (6.1%) | 193 (13.5%) |
| 1 or 2 Children | 183 (4.9%) | 125 (8.0%) |
| 3 or 4 Children | 61 (4.7%) | 33 (19.5%) |
| 5 or more Children | 0 (0.0%) | 0 (0.0%) |
| Total | 586 (5.5%) | 351 (11.1%) |
Race in Yucaipa
The most populous races in Yucaipa are White / Caucasian (38,922 | 71.5%), Hispanic or Latino (18,418 | 33.8%), and Two or more Races (6,618 | 12.2%).
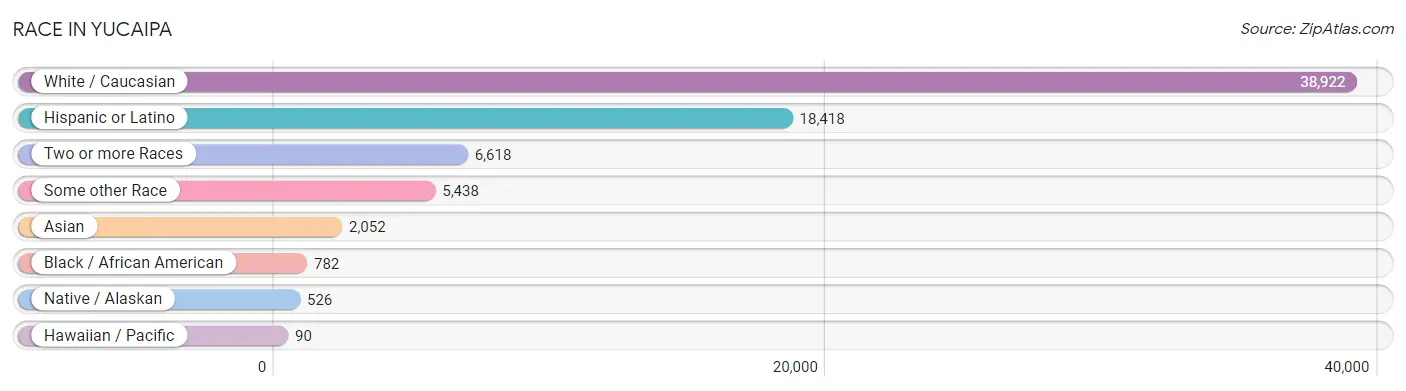
| Race | # Population | % Population |
| Asian | 2,052 | 3.8% |
| Black / African American | 782 | 1.4% |
| Hawaiian / Pacific | 90 | 0.2% |
| Hispanic or Latino | 18,418 | 33.8% |
| Native / Alaskan | 526 | 1.0% |
| White / Caucasian | 38,922 | 71.5% |
| Two or more Races | 6,618 | 12.2% |
| Some other Race | 5,438 | 10.0% |
| Total | 54,428 | 100.0% |
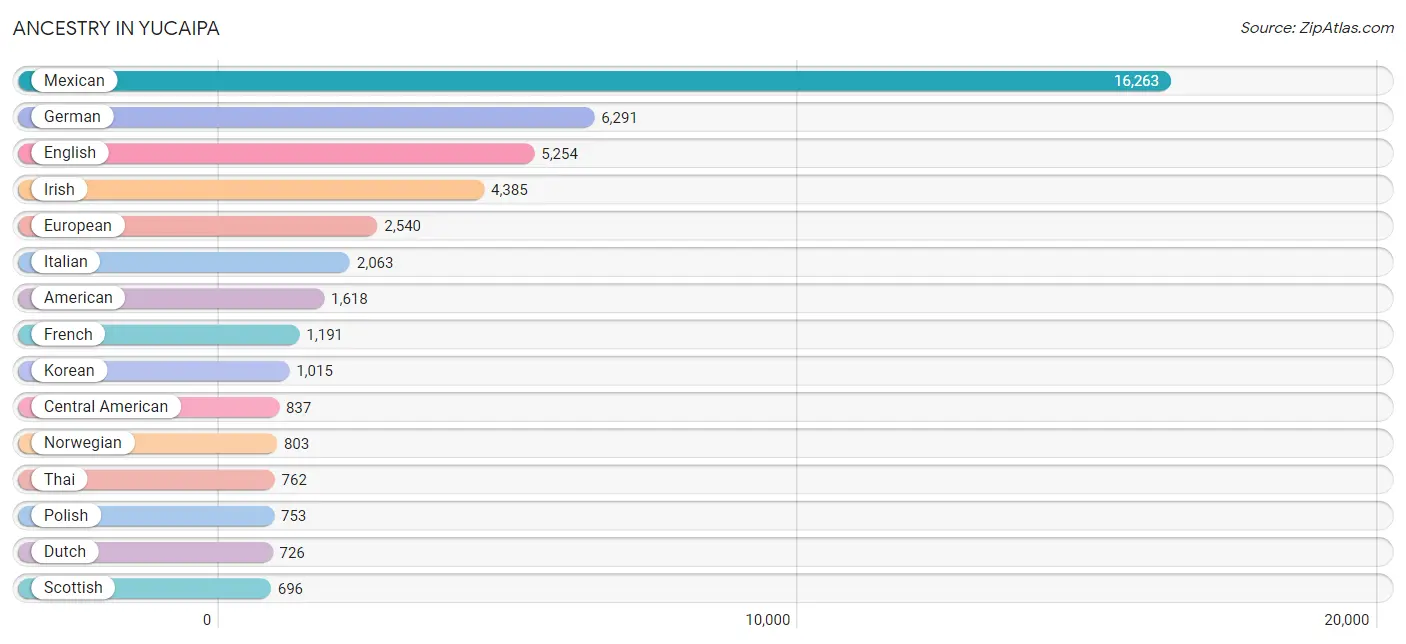
Ancestry in Yucaipa
The most populous ancestries reported in Yucaipa are Mexican (16,263 | 29.9%), German (6,291 | 11.6%), English (5,254 | 9.7%), Irish (4,385 | 8.1%), and European (2,540 | 4.7%), together accounting for 63.8% of all Yucaipa residents.
| Ancestry | # Population | % Population |
| African | 374 | 0.7% |
| American | 1,618 | 3.0% |
| Arab | 101 | 0.2% |
| Argentinean | 17 | 0.0% |
| Australian | 39 | 0.1% |
| Austrian | 12 | 0.0% |
| Belgian | 97 | 0.2% |
| Bhutanese | 60 | 0.1% |
| Blackfeet | 9 | 0.0% |
| British | 175 | 0.3% |
| British West Indian | 37 | 0.1% |
| Burmese | 243 | 0.4% |
| Canadian | 141 | 0.3% |
| Central American | 837 | 1.5% |
| Central American Indian | 97 | 0.2% |
| Cherokee | 426 | 0.8% |
| Chickasaw | 31 | 0.1% |
| Chilean | 15 | 0.0% |
| Choctaw | 26 | 0.1% |
| Colombian | 195 | 0.4% |
| Comanche | 51 | 0.1% |
| Costa Rican | 73 | 0.1% |
| Croatian | 10 | 0.0% |
| Cuban | 142 | 0.3% |
| Czech | 64 | 0.1% |
| Czechoslovakian | 45 | 0.1% |
| Danish | 288 | 0.5% |
| Dutch | 726 | 1.3% |
| Eastern European | 17 | 0.0% |
| Ecuadorian | 131 | 0.2% |
| English | 5,254 | 9.7% |
| European | 2,540 | 4.7% |
| Filipino | 8 | 0.0% |
| Finnish | 322 | 0.6% |
| French | 1,191 | 2.2% |
| French American Indian | 26 | 0.1% |
| French Canadian | 169 | 0.3% |
| German | 6,291 | 11.6% |
| Greek | 133 | 0.2% |
| Guamanian / Chamorro | 99 | 0.2% |
| Guatemalan | 396 | 0.7% |
| Honduran | 38 | 0.1% |
| Hopi | 65 | 0.1% |
| Hungarian | 317 | 0.6% |
| Icelander | 21 | 0.0% |
| Indian (Asian) | 263 | 0.5% |
| Irish | 4,385 | 8.1% |
| Italian | 2,063 | 3.8% |
| Japanese | 15 | 0.0% |
| Jordanian | 36 | 0.1% |
| Korean | 1,015 | 1.9% |
| Laotian | 65 | 0.1% |
| Latvian | 27 | 0.1% |
| Lebanese | 40 | 0.1% |
| Lithuanian | 117 | 0.2% |
| Macedonian | 34 | 0.1% |
| Malaysian | 110 | 0.2% |
| Mexican | 16,263 | 29.9% |
| Mexican American Indian | 267 | 0.5% |
| Mongolian | 211 | 0.4% |
| Native Hawaiian | 13 | 0.0% |
| Navajo | 52 | 0.1% |
| Nicaraguan | 84 | 0.2% |
| Northern European | 53 | 0.1% |
| Norwegian | 803 | 1.5% |
| Pakistani | 24 | 0.0% |
| Palestinian | 25 | 0.1% |
| Peruvian | 22 | 0.0% |
| Polish | 753 | 1.4% |
| Portuguese | 307 | 0.6% |
| Pueblo | 119 | 0.2% |
| Puerto Rican | 104 | 0.2% |
| Romanian | 148 | 0.3% |
| Russian | 125 | 0.2% |
| Salvadoran | 246 | 0.4% |
| Samoan | 56 | 0.1% |
| Scandinavian | 233 | 0.4% |
| Scotch-Irish | 328 | 0.6% |
| Scottish | 696 | 1.3% |
| Slavic | 12 | 0.0% |
| Slovak | 38 | 0.1% |
| Slovene | 19 | 0.0% |
| South American | 380 | 0.7% |
| Spaniard | 67 | 0.1% |
| Spanish | 208 | 0.4% |
| Sri Lankan | 140 | 0.3% |
| Subsaharan African | 374 | 0.7% |
| Swedish | 696 | 1.3% |
| Swiss | 45 | 0.1% |
| Thai | 762 | 1.4% |
| Ukrainian | 76 | 0.1% |
| Welsh | 267 | 0.5% |
| West Indian | 18 | 0.0% |
| Yugoslavian | 25 | 0.1% | View All 94 Rows |
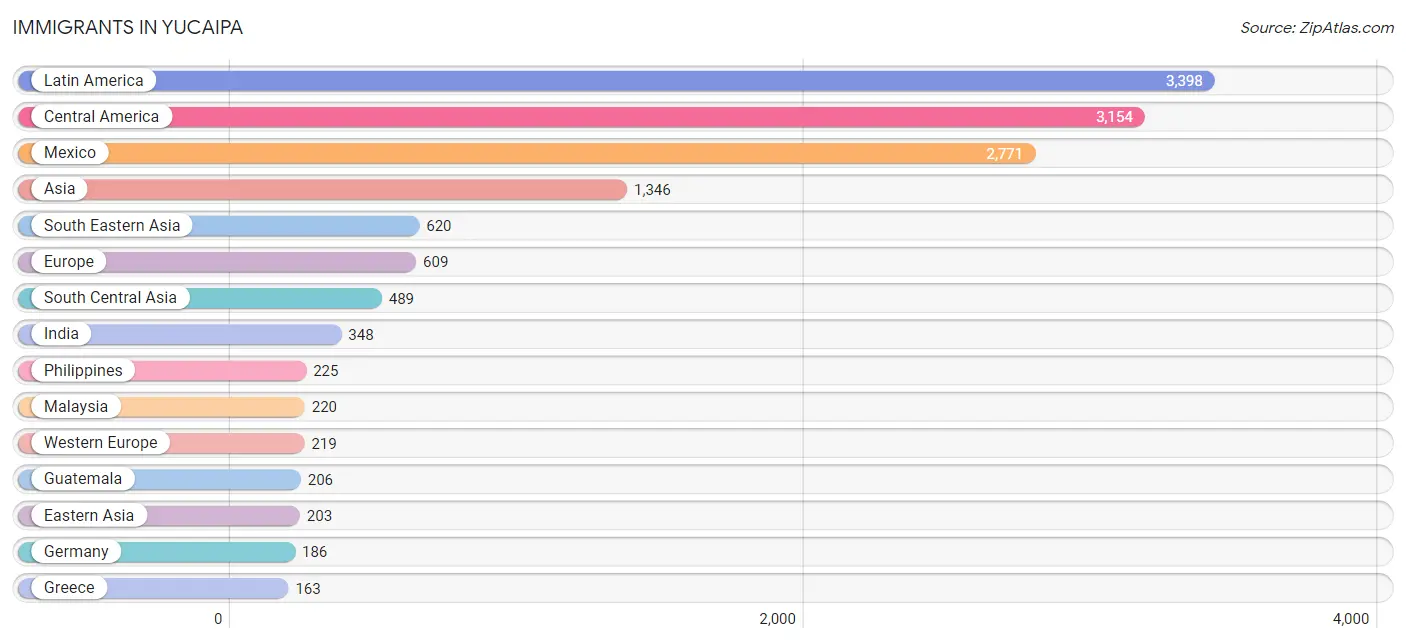
Immigrants in Yucaipa
The most numerous immigrant groups reported in Yucaipa came from Latin America (3,398 | 6.2%), Central America (3,154 | 5.8%), Mexico (2,771 | 5.1%), Asia (1,346 | 2.5%), and South Eastern Asia (620 | 1.1%), together accounting for 20.7% of all Yucaipa residents.
| Immigration Origin | # Population | % Population |
| Africa | 22 | 0.0% |
| Argentina | 32 | 0.1% |
| Asia | 1,346 | 2.5% |
| Australia | 29 | 0.1% |
| Austria | 1 | 0.0% |
| Brazil | 16 | 0.0% |
| Cambodia | 93 | 0.2% |
| Canada | 58 | 0.1% |
| Caribbean | 106 | 0.2% |
| Central America | 3,154 | 5.8% |
| China | 64 | 0.1% |
| Costa Rica | 20 | 0.0% |
| Cuba | 97 | 0.2% |
| Eastern Asia | 203 | 0.4% |
| Eastern Europe | 140 | 0.3% |
| Ecuador | 80 | 0.2% |
| El Salvador | 115 | 0.2% |
| England | 12 | 0.0% |
| Europe | 609 | 1.1% |
| Germany | 186 | 0.3% |
| Greece | 163 | 0.3% |
| Guatemala | 206 | 0.4% |
| Honduras | 10 | 0.0% |
| Hong Kong | 53 | 0.1% |
| India | 348 | 0.6% |
| Indonesia | 19 | 0.0% |
| Japan | 9 | 0.0% |
| Jordan | 34 | 0.1% |
| Kazakhstan | 58 | 0.1% |
| Korea | 130 | 0.2% |
| Latin America | 3,398 | 6.2% |
| Lithuania | 6 | 0.0% |
| Malaysia | 220 | 0.4% |
| Mexico | 2,771 | 5.1% |
| Netherlands | 26 | 0.1% |
| Nicaragua | 32 | 0.1% |
| North Macedonia | 32 | 0.1% |
| Northern Africa | 22 | 0.0% |
| Northern Europe | 87 | 0.2% |
| Oceania | 39 | 0.1% |
| Peru | 10 | 0.0% |
| Philippines | 225 | 0.4% |
| Romania | 29 | 0.1% |
| Russia | 26 | 0.1% |
| Scotland | 29 | 0.1% |
| South America | 138 | 0.3% |
| South Central Asia | 489 | 0.9% |
| South Eastern Asia | 620 | 1.1% |
| Southern Europe | 163 | 0.3% |
| Sri Lanka | 83 | 0.2% |
| Sweden | 10 | 0.0% |
| Switzerland | 6 | 0.0% |
| Thailand | 42 | 0.1% |
| Vietnam | 21 | 0.0% |
| Western Asia | 34 | 0.1% |
| Western Europe | 219 | 0.4% | View All 56 Rows |
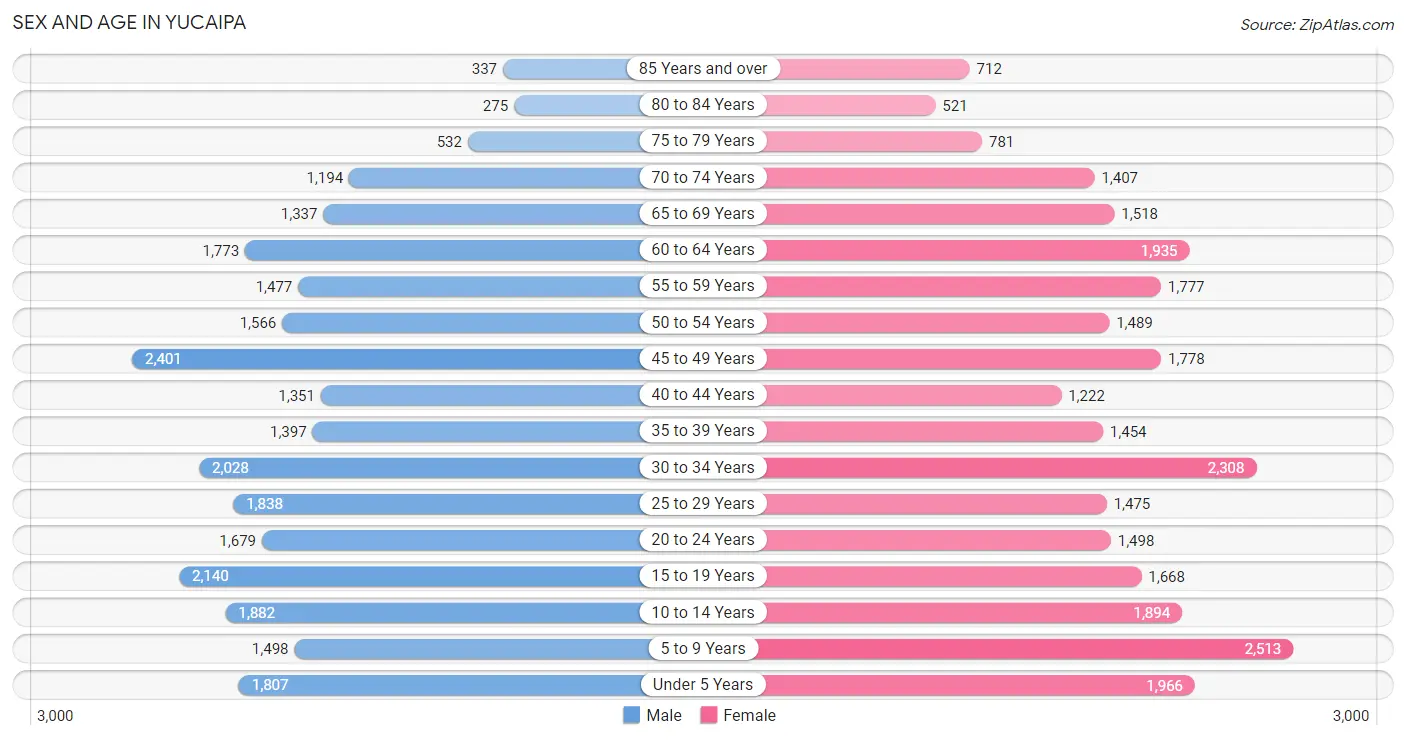
Sex and Age in Yucaipa
Sex and Age in Yucaipa
The most populous age groups in Yucaipa are 45 to 49 Years (2,401 | 9.1%) for men and 5 to 9 Years (2,513 | 9.0%) for women.
| Age Bracket | Male | Female |
| Under 5 Years | 1,807 (6.8%) | 1,966 (7.0%) |
| 5 to 9 Years | 1,498 (5.7%) | 2,513 (9.0%) |
| 10 to 14 Years | 1,882 (7.1%) | 1,894 (6.8%) |
| 15 to 19 Years | 2,140 (8.1%) | 1,668 (6.0%) |
| 20 to 24 Years | 1,679 (6.3%) | 1,498 (5.4%) |
| 25 to 29 Years | 1,838 (6.9%) | 1,475 (5.3%) |
| 30 to 34 Years | 2,028 (7.6%) | 2,308 (8.3%) |
| 35 to 39 Years | 1,397 (5.3%) | 1,454 (5.2%) |
| 40 to 44 Years | 1,351 (5.1%) | 1,222 (4.4%) |
| 45 to 49 Years | 2,401 (9.1%) | 1,778 (6.4%) |
| 50 to 54 Years | 1,566 (5.9%) | 1,489 (5.3%) |
| 55 to 59 Years | 1,477 (5.6%) | 1,777 (6.4%) |
| 60 to 64 Years | 1,773 (6.7%) | 1,935 (6.9%) |
| 65 to 69 Years | 1,337 (5.0%) | 1,518 (5.4%) |
| 70 to 74 Years | 1,194 (4.5%) | 1,407 (5.0%) |
| 75 to 79 Years | 532 (2.0%) | 781 (2.8%) |
| 80 to 84 Years | 275 (1.0%) | 521 (1.9%) |
| 85 Years and over | 337 (1.3%) | 712 (2.5%) |
| Total | 26,512 (100.0%) | 27,916 (100.0%) |
Families and Households in Yucaipa
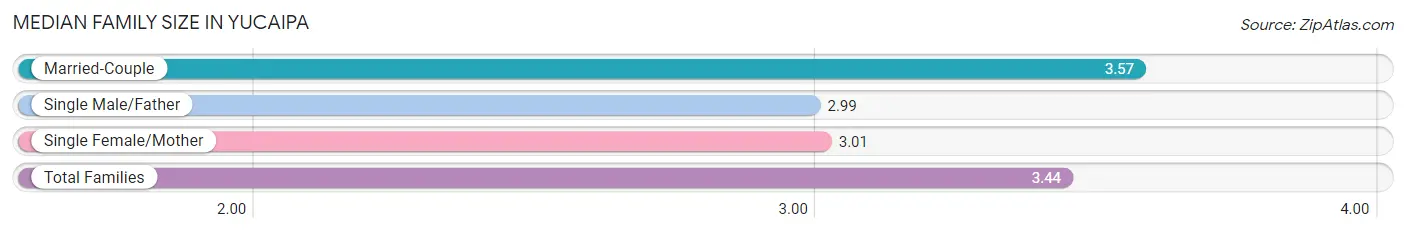
Median Family Size in Yucaipa
The median family size in Yucaipa is 3.44 persons per family, with married-couple families (10,665 | 77.1%) accounting for the largest median family size of 3.57 persons per family. On the other hand, single male/father families (948 | 6.9%) represent the smallest median family size with 2.99 persons per family.
| Family Type | # Families | Family Size |
| Married-Couple | 10,665 (77.1%) | 3.57 |
| Single Male/Father | 948 (6.9%) | 2.99 |
| Single Female/Mother | 2,213 (16.0%) | 3.01 |
| Total Families | 13,826 (100.0%) | 3.44 |
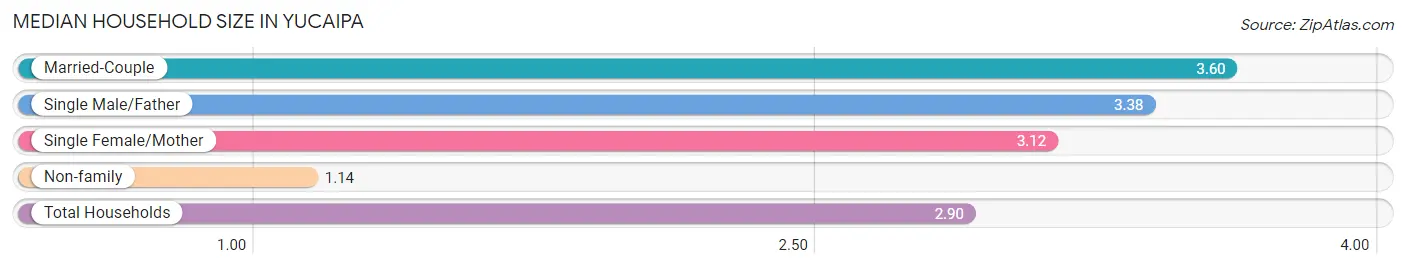
Median Household Size in Yucaipa
The median household size in Yucaipa is 2.90 persons per household, with married-couple households (10,665 | 57.4%) accounting for the largest median household size of 3.6 persons per household. non-family households (4,767 | 25.6%) represent the smallest median household size with 1.14 persons per household.
| Household Type | # Households | Household Size |
| Married-Couple | 10,665 (57.4%) | 3.60 |
| Single Male/Father | 948 (5.1%) | 3.38 |
| Single Female/Mother | 2,213 (11.9%) | 3.12 |
| Non-family | 4,767 (25.6%) | 1.14 |
| Total Households | 18,593 (100.0%) | 2.90 |
Household Size by Marriage Status in Yucaipa
Out of a total of 18,593 households in Yucaipa, 13,826 (74.4%) are family households, while 4,767 (25.6%) are nonfamily households. The most numerous type of family households are 2-person households, comprising 5,188, and the most common type of nonfamily households are 1-person households, comprising 4,203.
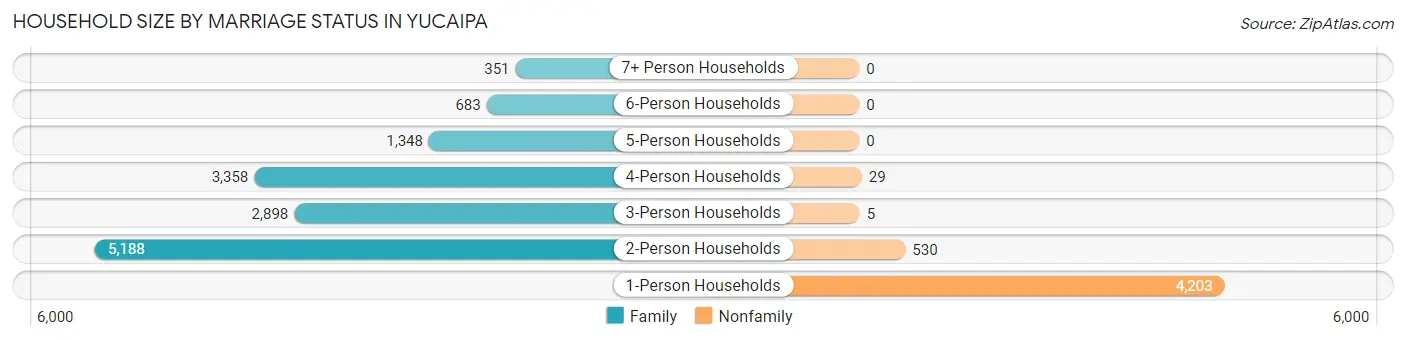
| Household Size | Family Households | Nonfamily Households |
| 1-Person Households | - | 4,203 (22.6%) |
| 2-Person Households | 5,188 (27.9%) | 530 (2.9%) |
| 3-Person Households | 2,898 (15.6%) | 5 (0.0%) |
| 4-Person Households | 3,358 (18.1%) | 29 (0.2%) |
| 5-Person Households | 1,348 (7.2%) | 0 (0.0%) |
| 6-Person Households | 683 (3.7%) | 0 (0.0%) |
| 7+ Person Households | 351 (1.9%) | 0 (0.0%) |
| Total | 13,826 (74.4%) | 4,767 (25.6%) |
Female Fertility in Yucaipa
Fertility by Age in Yucaipa
Average fertility rate in Yucaipa is 62.0 births per 1,000 women. Women in the age bracket of 20 to 34 years have the highest fertility rate with 111.0 births per 1,000 women. Women in the age bracket of 20 to 34 years acount for 81.1% of all women with births.
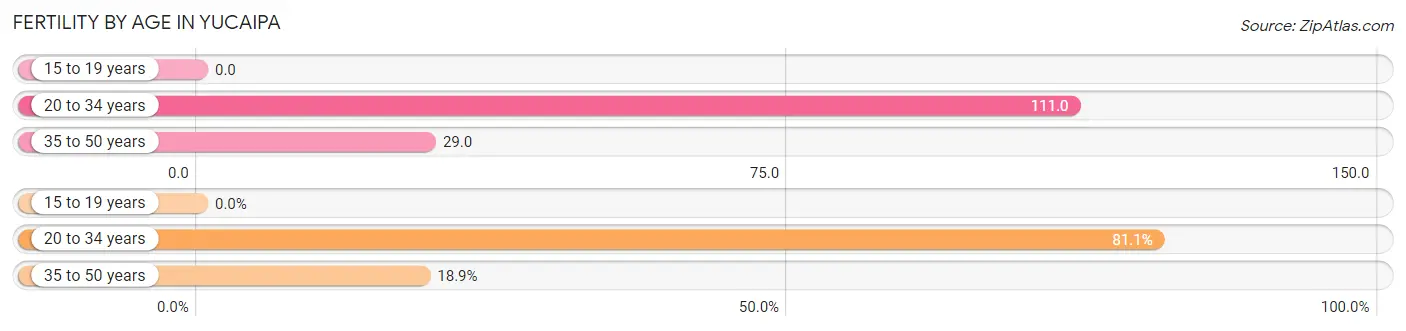
| Age Bracket | Women with Births | Births / 1,000 Women |
| 15 to 19 years | 0 (0.0%) | 0.0 |
| 20 to 34 years | 585 (81.1%) | 111.0 |
| 35 to 50 years | 136 (18.9%) | 29.0 |
| Total | 721 (100.0%) | 62.0 |
Fertility by Age by Marriage Status in Yucaipa
79.9% of women with births (721) in Yucaipa are married. The highest percentage of unmarried women with births falls into 35 to 50 years age bracket with 22.8% of them unmarried at the time of birth, while the lowest percentage of unmarried women with births belong to 20 to 34 years age bracket with 19.5% of them unmarried.
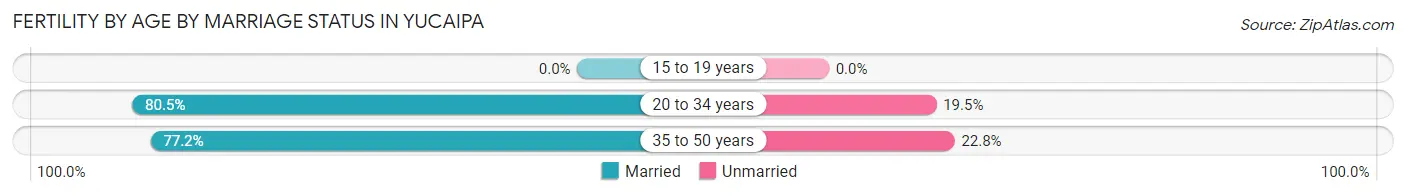
| Age Bracket | Married | Unmarried |
| 15 to 19 years | 0 (0.0%) | 0 (0.0%) |
| 20 to 34 years | 471 (80.5%) | 114 (19.5%) |
| 35 to 50 years | 105 (77.2%) | 31 (22.8%) |
| Total | 576 (79.9%) | 145 (20.1%) |
Fertility by Education in Yucaipa
Average fertility rate in Yucaipa is 62.0 births per 1,000 women. Women with the education attainment of bachelor's degree have the highest fertility rate of 126.0 births per 1,000 women, while women with the education attainment of less than high school have the lowest fertility at 11.0 births per 1,000 women. Women with the education attainment of college or associate's degree represent 37.7% of all women with births.
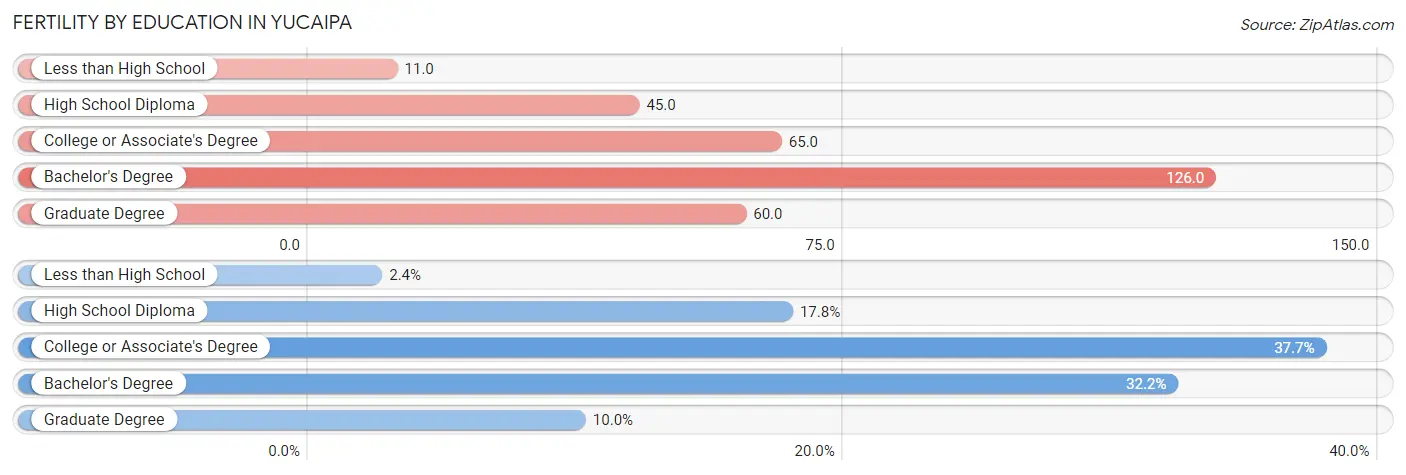
| Educational Attainment | Women with Births | Births / 1,000 Women |
| Less than High School | 17 (2.4%) | 11.0 |
| High School Diploma | 128 (17.7%) | 45.0 |
| College or Associate's Degree | 272 (37.7%) | 65.0 |
| Bachelor's Degree | 232 (32.2%) | 126.0 |
| Graduate Degree | 72 (10.0%) | 60.0 |
| Total | 721 (100.0%) | 62.0 |
Fertility by Education by Marriage Status in Yucaipa
20.1% of women with births in Yucaipa are unmarried. Women with the educational attainment of less than high school are most likely to be married with 100.0% of them married at childbirth, while women with the educational attainment of bachelor's degree are least likely to be married with 33.2% of them unmarried at childbirth.
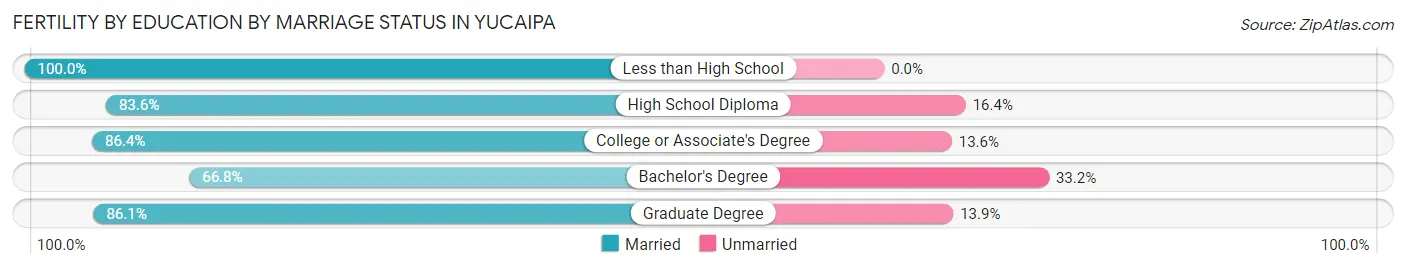
| Educational Attainment | Married | Unmarried |
| Less than High School | 17 (100.0%) | 0 (0.0%) |
| High School Diploma | 107 (83.6%) | 21 (16.4%) |
| College or Associate's Degree | 235 (86.4%) | 37 (13.6%) |
| Bachelor's Degree | 155 (66.8%) | 77 (33.2%) |
| Graduate Degree | 62 (86.1%) | 10 (13.9%) |
| Total | 576 (79.9%) | 145 (20.1%) |
Employment Characteristics in Yucaipa
Employment by Class of Employer in Yucaipa
Among the 23,547 employed individuals in Yucaipa, private company employees (14,582 | 61.9%), local government employees (3,502 | 14.9%), and not-for-profit organizations (2,013 | 8.6%) make up the most common classes of employment.
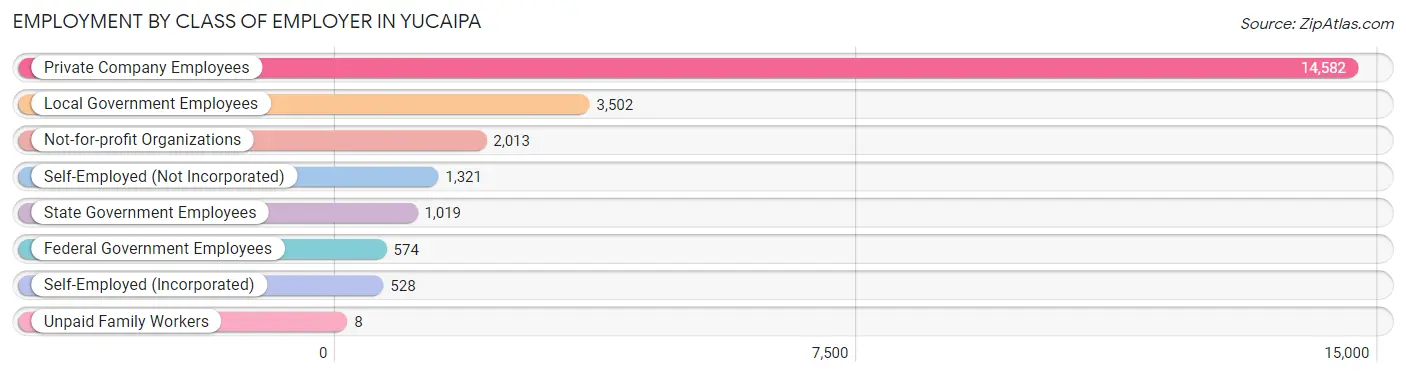
| Employer Class | # Employees | % Employees |
| Private Company Employees | 14,582 | 61.9% |
| Self-Employed (Incorporated) | 528 | 2.2% |
| Self-Employed (Not Incorporated) | 1,321 | 5.6% |
| Not-for-profit Organizations | 2,013 | 8.6% |
| Local Government Employees | 3,502 | 14.9% |
| State Government Employees | 1,019 | 4.3% |
| Federal Government Employees | 574 | 2.4% |
| Unpaid Family Workers | 8 | 0.0% |
| Total | 23,547 | 100.0% |
Employment Status by Age in Yucaipa
According to the labor force statistics for Yucaipa, out of the total population over 16 years of age (42,017), 61.8% or 25,967 individuals are in the labor force, with 6.8% or 1,766 of them unemployed. The age group with the highest labor force participation rate is 35 to 44 years, with 85.1% or 4,616 individuals in the labor force. Within the labor force, the 20 to 24 years age range has the highest percentage of unemployed individuals, with 24.9% or 648 of them being unemployed.
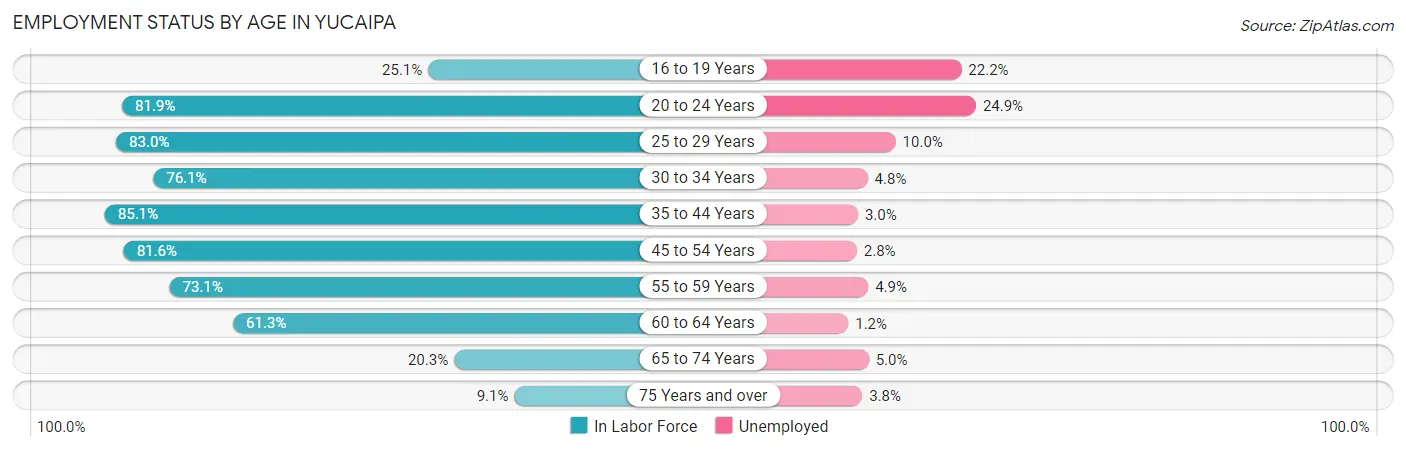
| Age Bracket | In Labor Force | Unemployed |
| 16 to 19 Years | 742 (25.1%) | 165 (22.2%) |
| 20 to 24 Years | 2,602 (81.9%) | 648 (24.9%) |
| 25 to 29 Years | 2,750 (83.0%) | 275 (10.0%) |
| 30 to 34 Years | 3,300 (76.1%) | 158 (4.8%) |
| 35 to 44 Years | 4,616 (85.1%) | 138 (3.0%) |
| 45 to 54 Years | 5,903 (81.6%) | 165 (2.8%) |
| 55 to 59 Years | 2,379 (73.1%) | 117 (4.9%) |
| 60 to 64 Years | 2,273 (61.3%) | 27 (1.2%) |
| 65 to 74 Years | 1,108 (20.3%) | 55 (5.0%) |
| 75 Years and over | 287 (9.1%) | 11 (3.8%) |
| Total | 25,967 (61.8%) | 1,766 (6.8%) |
Employment Status by Educational Attainment in Yucaipa
According to labor force statistics for Yucaipa, 77.8% of individuals (21,215) out of the total population between 25 and 64 years of age (27,269) are in the labor force, with 4.2% or 891 of them being unemployed. The group with the highest labor force participation rate are those with the educational attainment of bachelor's degree or higher, with 80.7% or 6,312 individuals in the labor force. Within the labor force, individuals with less than high school education have the highest percentage of unemployment, with 7.6% or 141 of them being unemployed.
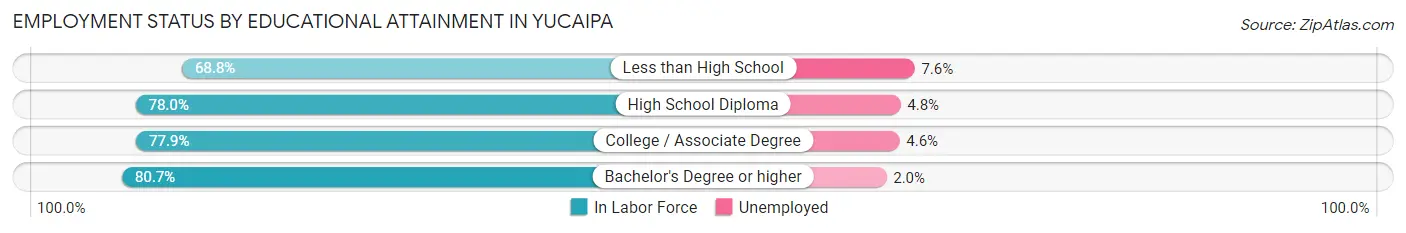
| Educational Attainment | In Labor Force | Unemployed |
| Less than High School | 1,860 (68.8%) | 205 (7.6%) |
| High School Diploma | 5,826 (78.0%) | 359 (4.8%) |
| College / Associate Degree | 7,225 (77.9%) | 427 (4.6%) |
| Bachelor's Degree or higher | 6,312 (80.7%) | 156 (2.0%) |
| Total | 21,215 (77.8%) | 1,145 (4.2%) |
Employment Occupations by Sex in Yucaipa
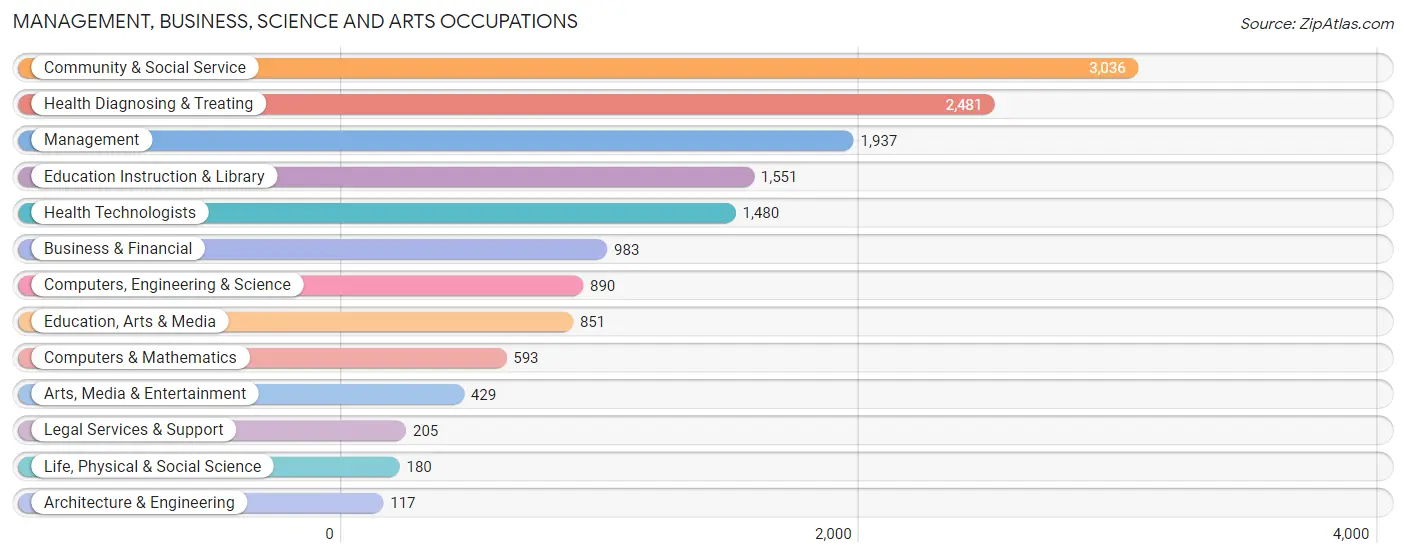
Management, Business, Science and Arts Occupations
The most common Management, Business, Science and Arts occupations in Yucaipa are Community & Social Service (3,036 | 12.6%), Health Diagnosing & Treating (2,481 | 10.3%), Management (1,937 | 8.0%), Education Instruction & Library (1,551 | 6.4%), and Health Technologists (1,480 | 6.1%).
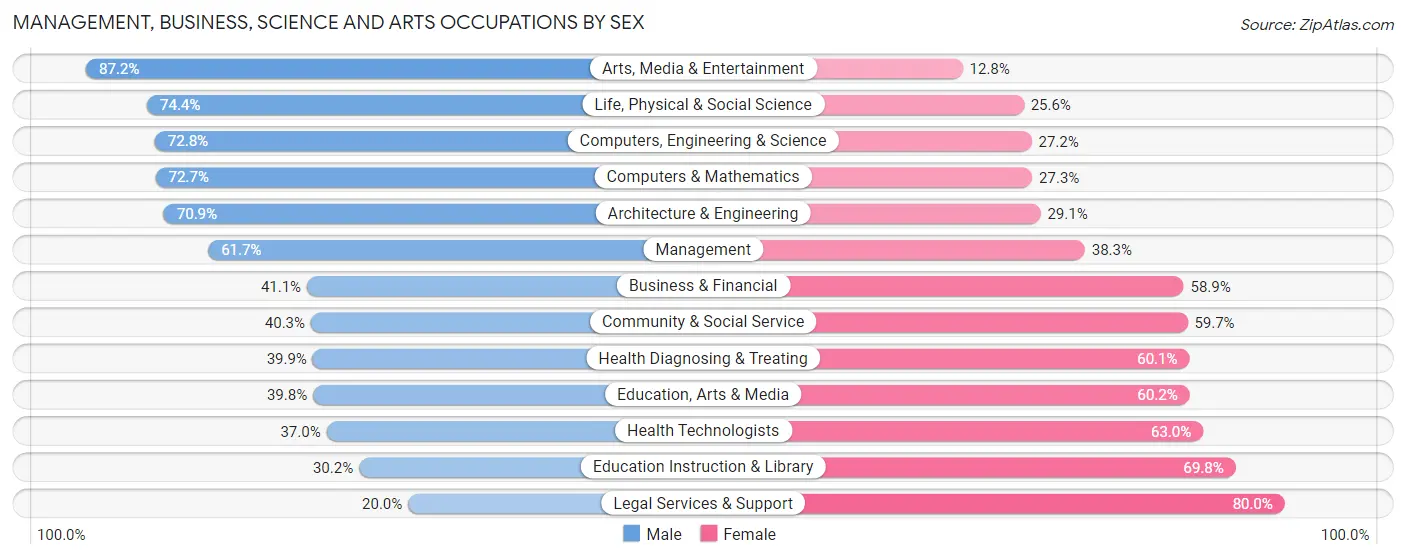
Management, Business, Science and Arts Occupations by Sex
Within the Management, Business, Science and Arts occupations in Yucaipa, the most male-oriented occupations are Arts, Media & Entertainment (87.2%), Life, Physical & Social Science (74.4%), and Computers, Engineering & Science (72.8%), while the most female-oriented occupations are Legal Services & Support (80.0%), Education Instruction & Library (69.8%), and Health Technologists (63.0%).
| Occupation | Male | Female |
| Management | 1,195 (61.7%) | 742 (38.3%) |
| Business & Financial | 404 (41.1%) | 579 (58.9%) |
| Computers, Engineering & Science | 648 (72.8%) | 242 (27.2%) |
| Computers & Mathematics | 431 (72.7%) | 162 (27.3%) |
| Architecture & Engineering | 83 (70.9%) | 34 (29.1%) |
| Life, Physical & Social Science | 134 (74.4%) | 46 (25.6%) |
| Community & Social Service | 1,223 (40.3%) | 1,813 (59.7%) |
| Education, Arts & Media | 339 (39.8%) | 512 (60.2%) |
| Legal Services & Support | 41 (20.0%) | 164 (80.0%) |
| Education Instruction & Library | 469 (30.2%) | 1,082 (69.8%) |
| Arts, Media & Entertainment | 374 (87.2%) | 55 (12.8%) |
| Health Diagnosing & Treating | 990 (39.9%) | 1,491 (60.1%) |
| Health Technologists | 548 (37.0%) | 932 (63.0%) |
| Total (Category) | 4,460 (47.8%) | 4,867 (52.2%) |
| Total (Overall) | 12,702 (52.6%) | 11,439 (47.4%) |
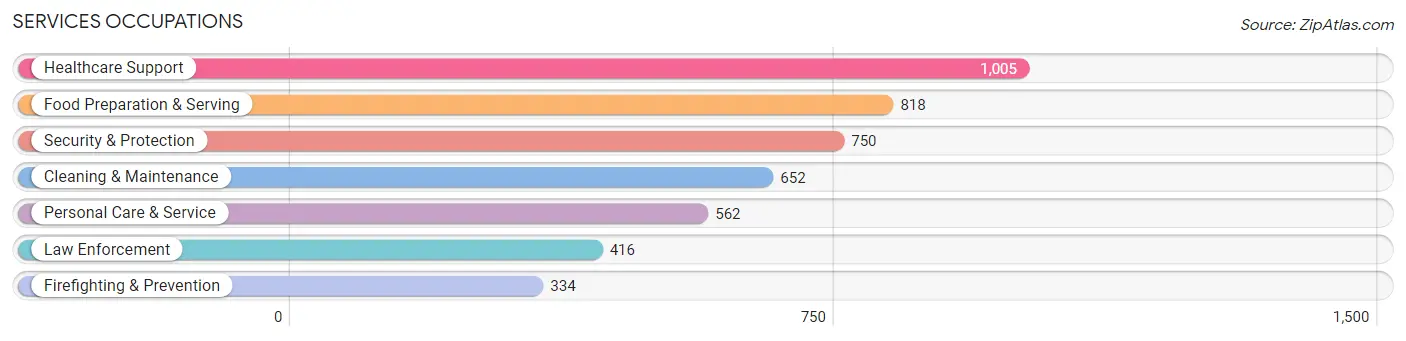
Services Occupations
The most common Services occupations in Yucaipa are Healthcare Support (1,005 | 4.2%), Food Preparation & Serving (818 | 3.4%), Security & Protection (750 | 3.1%), Cleaning & Maintenance (652 | 2.7%), and Personal Care & Service (562 | 2.3%).
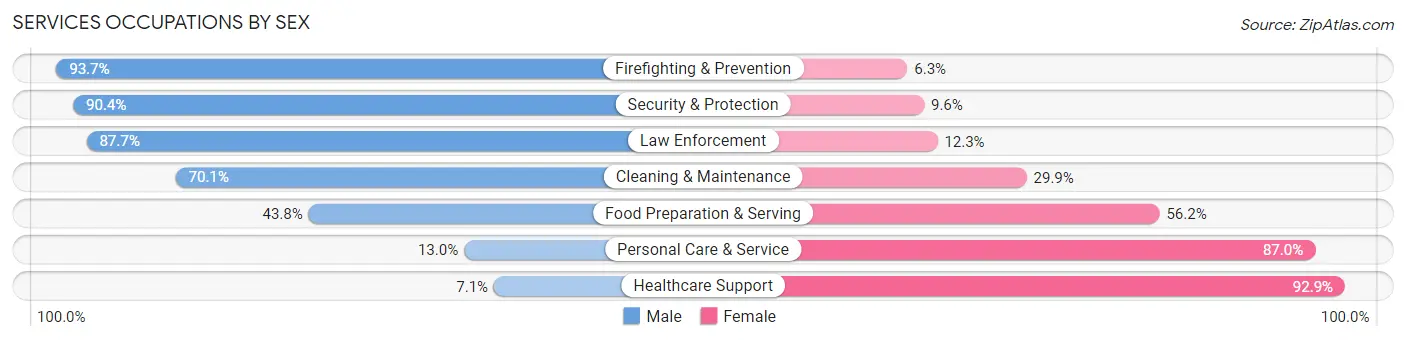
Services Occupations by Sex
Within the Services occupations in Yucaipa, the most male-oriented occupations are Firefighting & Prevention (93.7%), Security & Protection (90.4%), and Law Enforcement (87.7%), while the most female-oriented occupations are Healthcare Support (92.9%), Personal Care & Service (87.0%), and Food Preparation & Serving (56.2%).
| Occupation | Male | Female |
| Healthcare Support | 71 (7.1%) | 934 (92.9%) |
| Security & Protection | 678 (90.4%) | 72 (9.6%) |
| Firefighting & Prevention | 313 (93.7%) | 21 (6.3%) |
| Law Enforcement | 365 (87.7%) | 51 (12.3%) |
| Food Preparation & Serving | 358 (43.8%) | 460 (56.2%) |
| Cleaning & Maintenance | 457 (70.1%) | 195 (29.9%) |
| Personal Care & Service | 73 (13.0%) | 489 (87.0%) |
| Total (Category) | 1,637 (43.2%) | 2,150 (56.8%) |
| Total (Overall) | 12,702 (52.6%) | 11,439 (47.4%) |
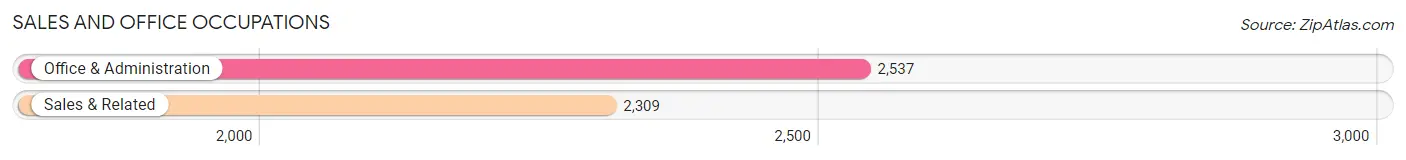
Sales and Office Occupations
The most common Sales and Office occupations in Yucaipa are Office & Administration (2,537 | 10.5%), and Sales & Related (2,309 | 9.6%).
Sales and Office Occupations by Sex
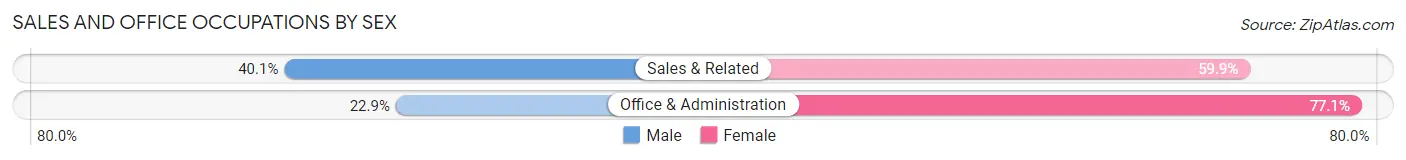
| Occupation | Male | Female |
| Sales & Related | 925 (40.1%) | 1,384 (59.9%) |
| Office & Administration | 581 (22.9%) | 1,956 (77.1%) |
| Total (Category) | 1,506 (31.1%) | 3,340 (68.9%) |
| Total (Overall) | 12,702 (52.6%) | 11,439 (47.4%) |
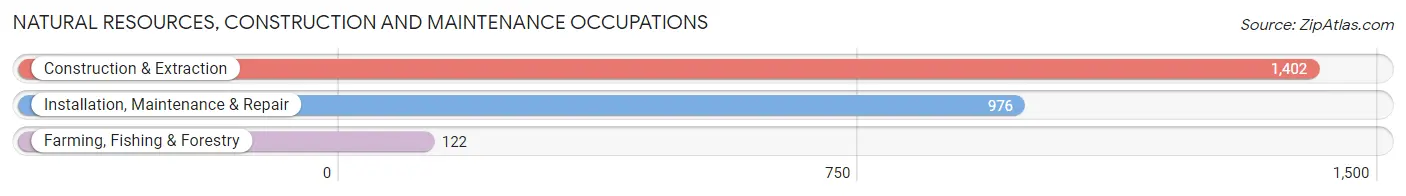
Natural Resources, Construction and Maintenance Occupations
The most common Natural Resources, Construction and Maintenance occupations in Yucaipa are Construction & Extraction (1,402 | 5.8%), Installation, Maintenance & Repair (976 | 4.0%), and Farming, Fishing & Forestry (122 | 0.5%).
Natural Resources, Construction and Maintenance Occupations by Sex
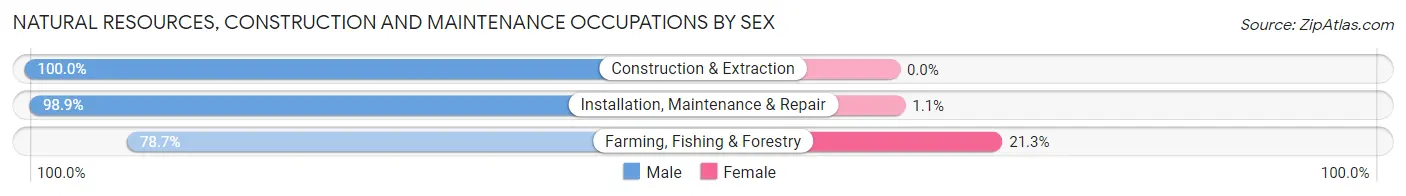
| Occupation | Male | Female |
| Farming, Fishing & Forestry | 96 (78.7%) | 26 (21.3%) |
| Construction & Extraction | 1,402 (100.0%) | 0 (0.0%) |
| Installation, Maintenance & Repair | 965 (98.9%) | 11 (1.1%) |
| Total (Category) | 2,463 (98.5%) | 37 (1.5%) |
| Total (Overall) | 12,702 (52.6%) | 11,439 (47.4%) |
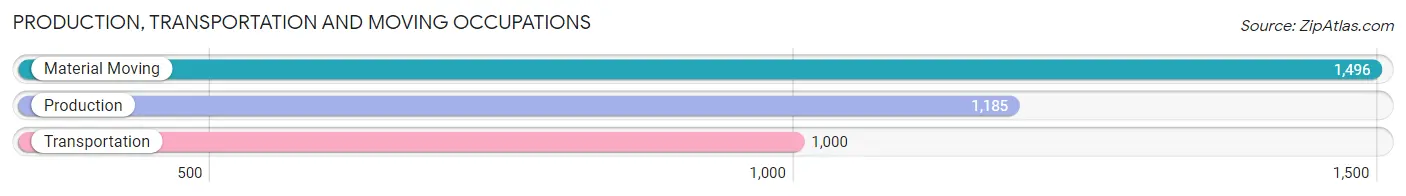
Production, Transportation and Moving Occupations
The most common Production, Transportation and Moving occupations in Yucaipa are Material Moving (1,496 | 6.2%), Production (1,185 | 4.9%), and Transportation (1,000 | 4.1%).
Production, Transportation and Moving Occupations by Sex
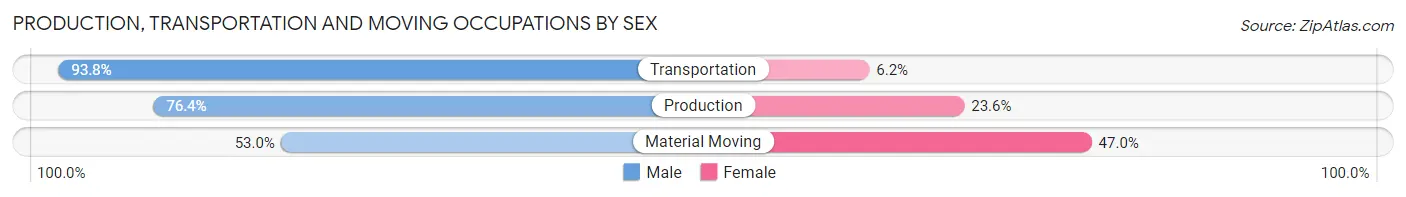
| Occupation | Male | Female |
| Production | 905 (76.4%) | 280 (23.6%) |
| Transportation | 938 (93.8%) | 62 (6.2%) |
| Material Moving | 793 (53.0%) | 703 (47.0%) |
| Total (Category) | 2,636 (71.6%) | 1,045 (28.4%) |
| Total (Overall) | 12,702 (52.6%) | 11,439 (47.4%) |
Employment Industries by Sex in Yucaipa
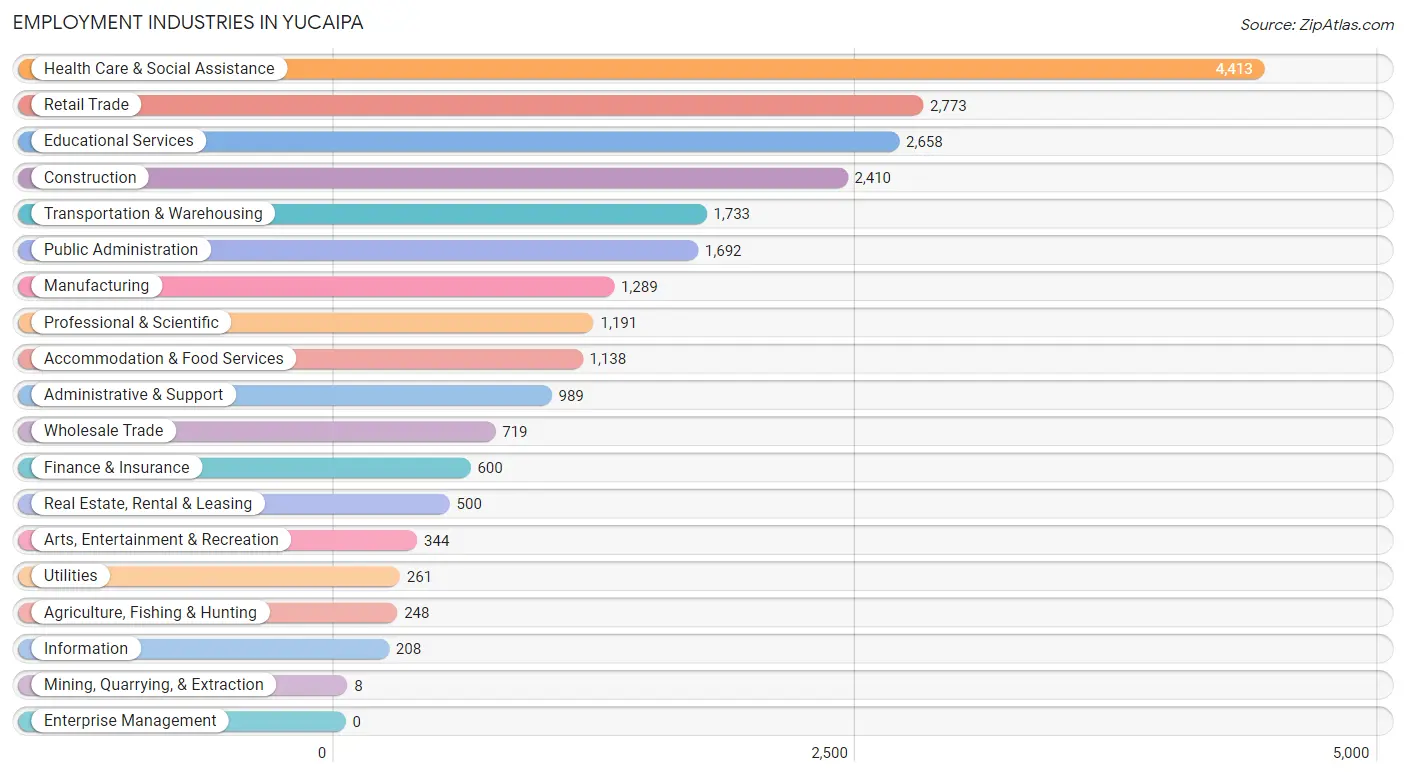
Employment Industries in Yucaipa
The major employment industries in Yucaipa include Health Care & Social Assistance (4,413 | 18.3%), Retail Trade (2,773 | 11.5%), Educational Services (2,658 | 11.0%), Construction (2,410 | 10.0%), and Transportation & Warehousing (1,733 | 7.2%).
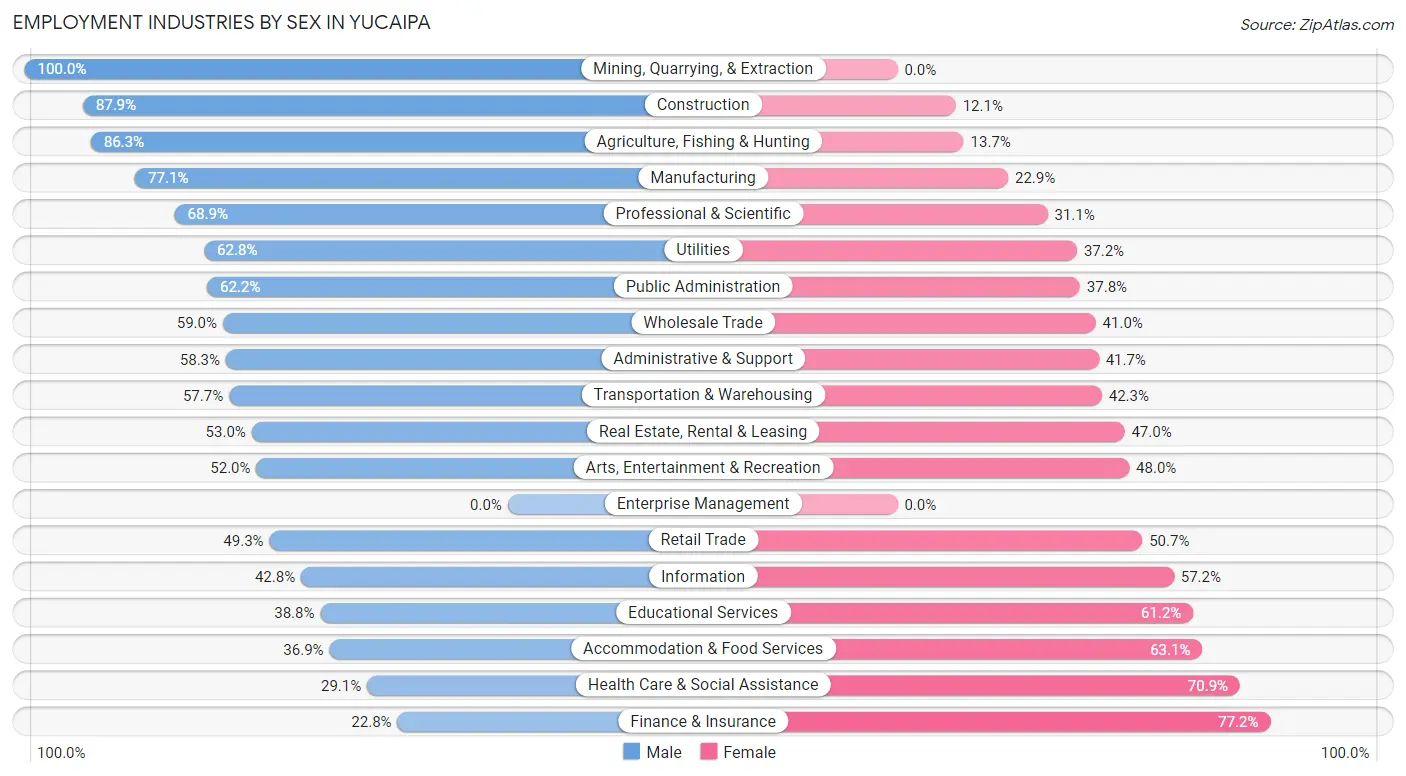
Employment Industries by Sex in Yucaipa
The Yucaipa industries that see more men than women are Mining, Quarrying, & Extraction (100.0%), Construction (87.9%), and Agriculture, Fishing & Hunting (86.3%), whereas the industries that tend to have a higher number of women are Finance & Insurance (77.2%), Health Care & Social Assistance (70.9%), and Accommodation & Food Services (63.1%).
| Industry | Male | Female |
| Agriculture, Fishing & Hunting | 214 (86.3%) | 34 (13.7%) |
| Mining, Quarrying, & Extraction | 8 (100.0%) | 0 (0.0%) |
| Construction | 2,119 (87.9%) | 291 (12.1%) |
| Manufacturing | 994 (77.1%) | 295 (22.9%) |
| Wholesale Trade | 424 (59.0%) | 295 (41.0%) |
| Retail Trade | 1,368 (49.3%) | 1,405 (50.7%) |
| Transportation & Warehousing | 1,000 (57.7%) | 733 (42.3%) |
| Utilities | 164 (62.8%) | 97 (37.2%) |
| Information | 89 (42.8%) | 119 (57.2%) |
| Finance & Insurance | 137 (22.8%) | 463 (77.2%) |
| Real Estate, Rental & Leasing | 265 (53.0%) | 235 (47.0%) |
| Professional & Scientific | 821 (68.9%) | 370 (31.1%) |
| Enterprise Management | 0 (0.0%) | 0 (0.0%) |
| Administrative & Support | 577 (58.3%) | 412 (41.7%) |
| Educational Services | 1,031 (38.8%) | 1,627 (61.2%) |
| Health Care & Social Assistance | 1,285 (29.1%) | 3,128 (70.9%) |
| Arts, Entertainment & Recreation | 179 (52.0%) | 165 (48.0%) |
| Accommodation & Food Services | 420 (36.9%) | 718 (63.1%) |
| Public Administration | 1,053 (62.2%) | 639 (37.8%) |
| Total | 12,702 (52.6%) | 11,439 (47.4%) |
Education in Yucaipa
School Enrollment in Yucaipa
The most common levels of schooling among the 13,850 students in Yucaipa are college / undergraduate (3,041 | 22.0%), high school (2,894 | 20.9%), and middle school (2,881 | 20.8%).
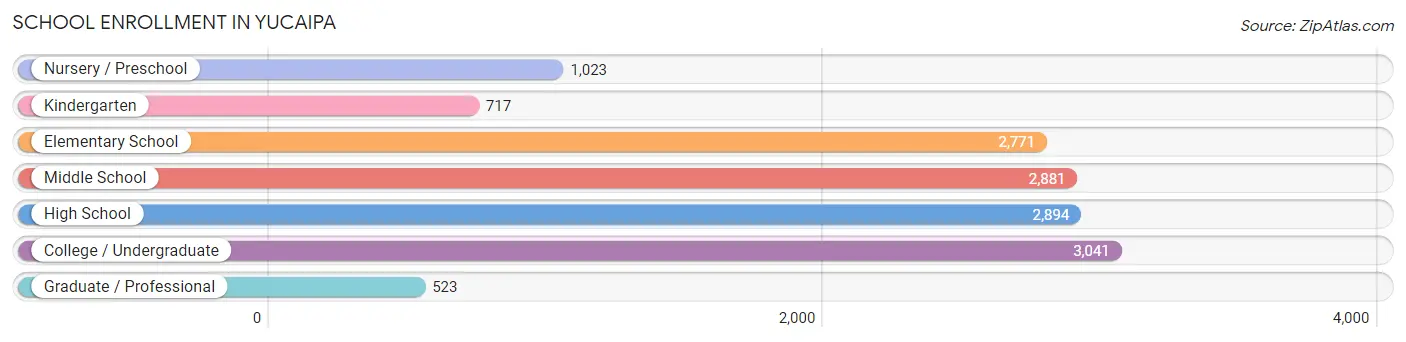
| School Level | # Students | % Students |
| Nursery / Preschool | 1,023 | 7.4% |
| Kindergarten | 717 | 5.2% |
| Elementary School | 2,771 | 20.0% |
| Middle School | 2,881 | 20.8% |
| High School | 2,894 | 20.9% |
| College / Undergraduate | 3,041 | 22.0% |
| Graduate / Professional | 523 | 3.8% |
| Total | 13,850 | 100.0% |
School Enrollment by Age by Funding Source in Yucaipa
Out of a total of 13,850 students who are enrolled in schools in Yucaipa, 3,269 (23.6%) attend a private institution, while the remaining 10,581 (76.4%) are enrolled in public schools. The age group of 3 to 4 year olds has the highest likelihood of being enrolled in private schools, with 376 (85.8% in the age bracket) enrolled. Conversely, the age group of 20 to 24 year olds has the lowest likelihood of being enrolled in a private school, with 1,045 (90.0% in the age bracket) attending a public institution.
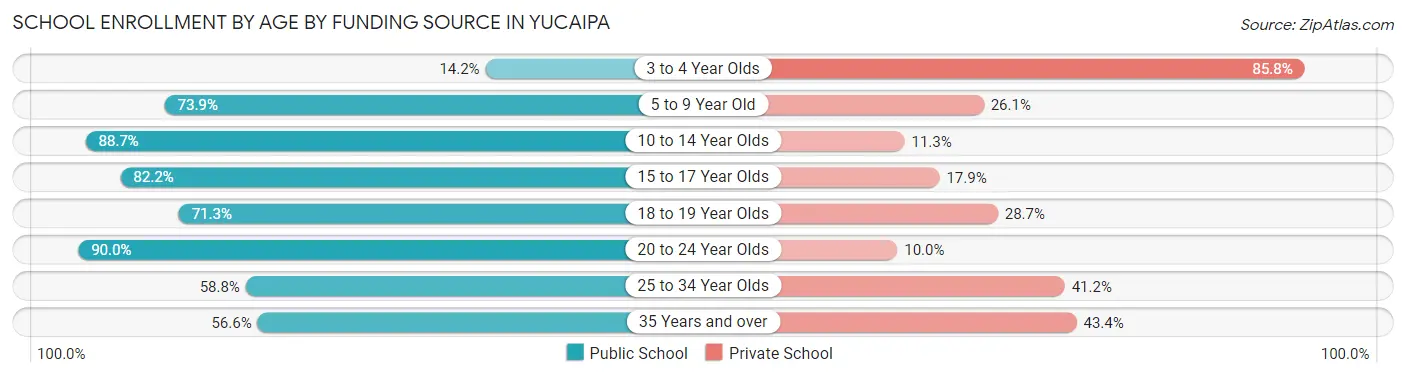
| Age Bracket | Public School | Private School |
| 3 to 4 Year Olds | 62 (14.2%) | 376 (85.8%) |
| 5 to 9 Year Old | 2,825 (73.9%) | 997 (26.1%) |
| 10 to 14 Year Olds | 3,112 (88.7%) | 398 (11.3%) |
| 15 to 17 Year Olds | 1,873 (82.2%) | 407 (17.8%) |
| 18 to 19 Year Olds | 730 (71.3%) | 294 (28.7%) |
| 20 to 24 Year Olds | 1,045 (90.0%) | 116 (10.0%) |
| 25 to 34 Year Olds | 630 (58.8%) | 441 (41.2%) |
| 35 Years and over | 308 (56.6%) | 236 (43.4%) |
| Total | 10,581 (76.4%) | 3,269 (23.6%) |
Educational Attainment by Field of Study in Yucaipa
Business (1,425 | 13.7%), science & technology (1,382 | 13.3%), social sciences (1,230 | 11.8%), arts & humanities (994 | 9.6%), and education (841 | 8.1%) are the most common fields of study among 10,404 individuals in Yucaipa who have obtained a bachelor's degree or higher.
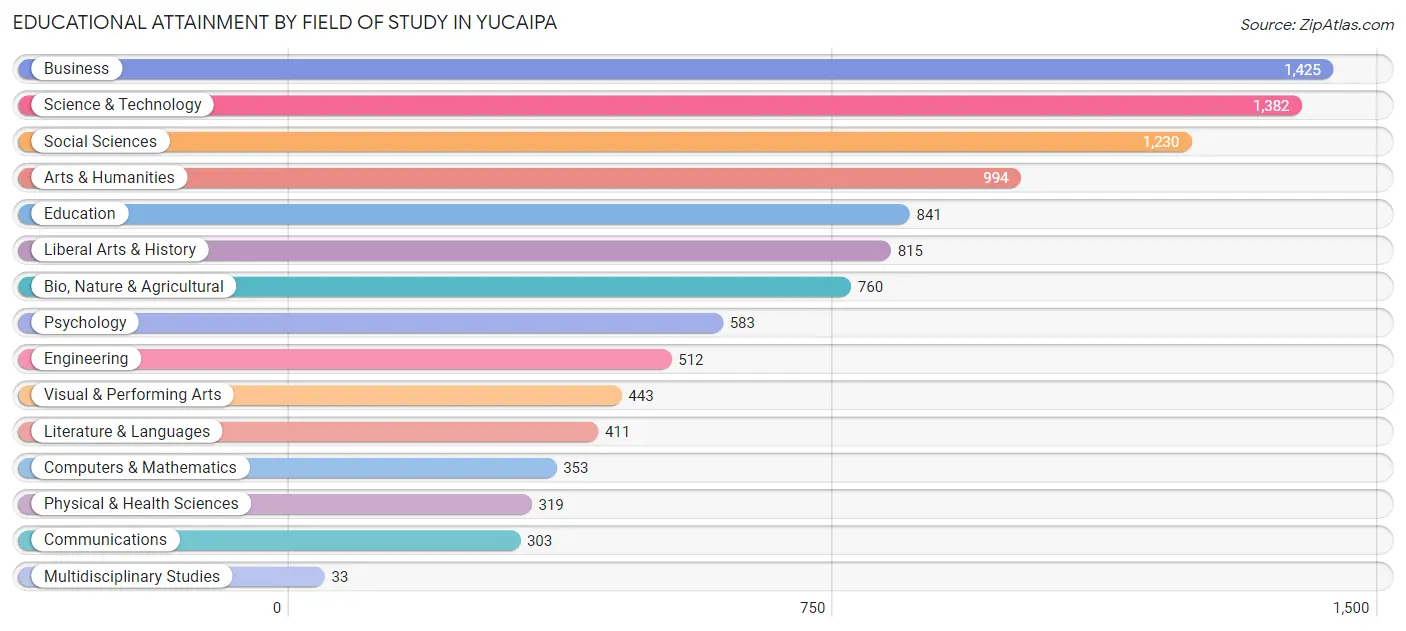
| Field of Study | # Graduates | % Graduates |
| Computers & Mathematics | 353 | 3.4% |
| Bio, Nature & Agricultural | 760 | 7.3% |
| Physical & Health Sciences | 319 | 3.1% |
| Psychology | 583 | 5.6% |
| Social Sciences | 1,230 | 11.8% |
| Engineering | 512 | 4.9% |
| Multidisciplinary Studies | 33 | 0.3% |
| Science & Technology | 1,382 | 13.3% |
| Business | 1,425 | 13.7% |
| Education | 841 | 8.1% |
| Literature & Languages | 411 | 4.0% |
| Liberal Arts & History | 815 | 7.8% |
| Visual & Performing Arts | 443 | 4.3% |
| Communications | 303 | 2.9% |
| Arts & Humanities | 994 | 9.6% |
| Total | 10,404 | 100.0% |
Transportation & Commute in Yucaipa
Vehicle Availability by Sex in Yucaipa
The most prevalent vehicle ownership categories in Yucaipa are males with 2 vehicles (4,079, accounting for 33.3%) and females with 2 vehicles (3,945, making up 36.3%).
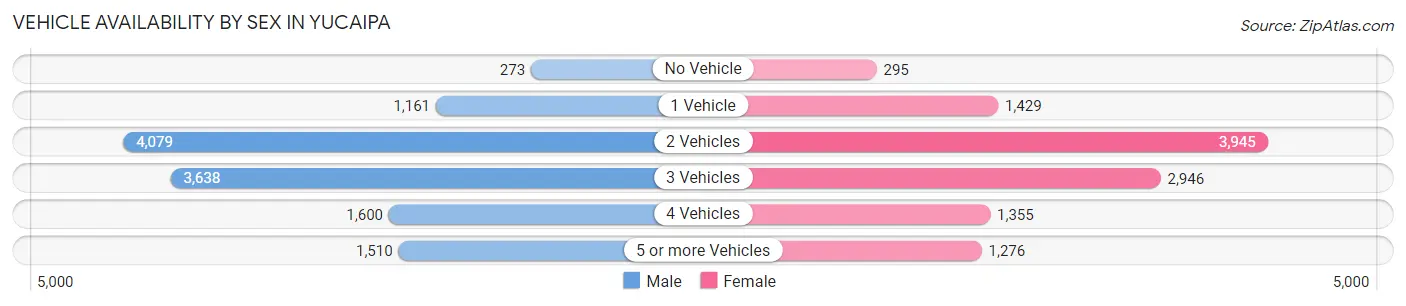
| Vehicles Available | Male | Female |
| No Vehicle | 273 (2.2%) | 295 (2.6%) |
| 1 Vehicle | 1,161 (9.5%) | 1,429 (12.7%) |
| 2 Vehicles | 4,079 (33.3%) | 3,945 (35.1%) |
| 3 Vehicles | 3,638 (29.7%) | 2,946 (26.2%) |
| 4 Vehicles | 1,600 (13.1%) | 1,355 (12.0%) |
| 5 or more Vehicles | 1,510 (12.3%) | 1,276 (11.4%) |
| Total | 12,261 (100.0%) | 11,246 (100.0%) |
Commute Time in Yucaipa
The most frequently occuring commute durations in Yucaipa are 20 to 24 minutes (3,987 commuters, 18.6%), 30 to 34 minutes (3,779 commuters, 17.7%), and 15 to 19 minutes (2,462 commuters, 11.5%).
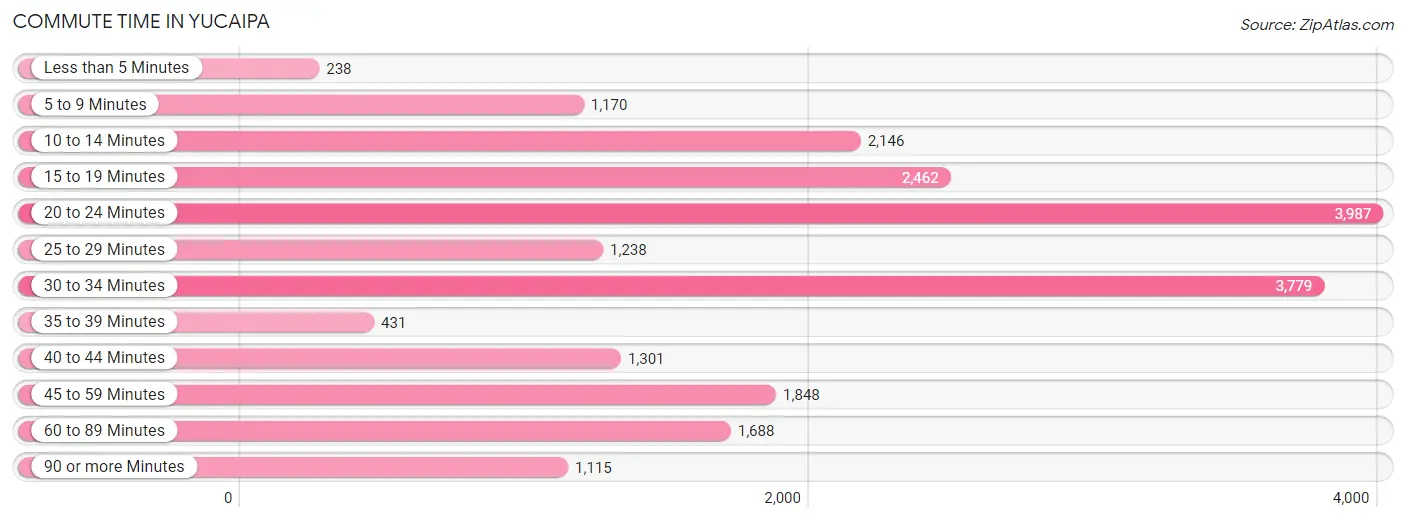
| Commute Time | # Commuters | % Commuters |
| Less than 5 Minutes | 238 | 1.1% |
| 5 to 9 Minutes | 1,170 | 5.5% |
| 10 to 14 Minutes | 2,146 | 10.0% |
| 15 to 19 Minutes | 2,462 | 11.5% |
| 20 to 24 Minutes | 3,987 | 18.6% |
| 25 to 29 Minutes | 1,238 | 5.8% |
| 30 to 34 Minutes | 3,779 | 17.7% |
| 35 to 39 Minutes | 431 | 2.0% |
| 40 to 44 Minutes | 1,301 | 6.1% |
| 45 to 59 Minutes | 1,848 | 8.6% |
| 60 to 89 Minutes | 1,688 | 7.9% |
| 90 or more Minutes | 1,115 | 5.2% |
Commute Time by Sex in Yucaipa
The most common commute times in Yucaipa are 30 to 34 minutes (2,193 commuters, 19.6%) for males and 20 to 24 minutes (2,204 commuters, 21.5%) for females.
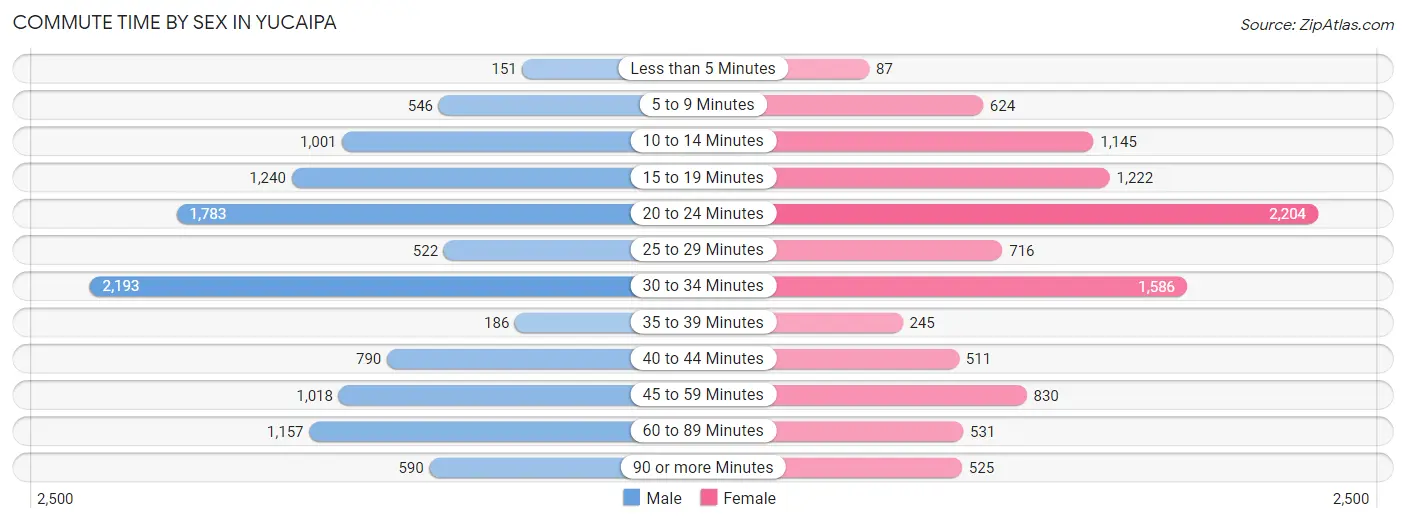
| Commute Time | Male | Female |
| Less than 5 Minutes | 151 (1.3%) | 87 (0.9%) |
| 5 to 9 Minutes | 546 (4.9%) | 624 (6.1%) |
| 10 to 14 Minutes | 1,001 (9.0%) | 1,145 (11.2%) |
| 15 to 19 Minutes | 1,240 (11.1%) | 1,222 (11.9%) |
| 20 to 24 Minutes | 1,783 (16.0%) | 2,204 (21.5%) |
| 25 to 29 Minutes | 522 (4.7%) | 716 (7.0%) |
| 30 to 34 Minutes | 2,193 (19.6%) | 1,586 (15.5%) |
| 35 to 39 Minutes | 186 (1.7%) | 245 (2.4%) |
| 40 to 44 Minutes | 790 (7.1%) | 511 (5.0%) |
| 45 to 59 Minutes | 1,018 (9.1%) | 830 (8.1%) |
| 60 to 89 Minutes | 1,157 (10.3%) | 531 (5.2%) |
| 90 or more Minutes | 590 (5.3%) | 525 (5.1%) |
Time of Departure to Work by Sex in Yucaipa
The most frequent times of departure to work in Yucaipa are 7:00 AM to 7:29 AM (1,457, 13.0%) for males and 8:00 AM to 8:29 AM (1,695, 16.6%) for females.
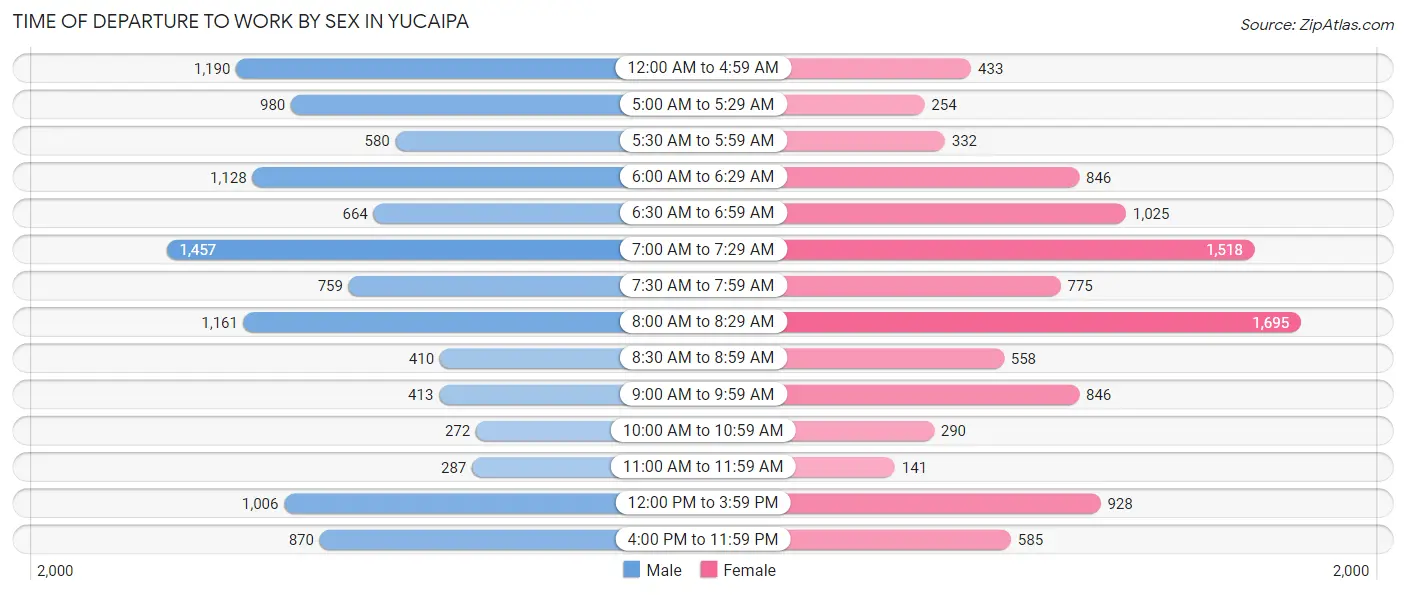
| Time of Departure | Male | Female |
| 12:00 AM to 4:59 AM | 1,190 (10.6%) | 433 (4.2%) |
| 5:00 AM to 5:29 AM | 980 (8.8%) | 254 (2.5%) |
| 5:30 AM to 5:59 AM | 580 (5.2%) | 332 (3.3%) |
| 6:00 AM to 6:29 AM | 1,128 (10.1%) | 846 (8.3%) |
| 6:30 AM to 6:59 AM | 664 (5.9%) | 1,025 (10.0%) |
| 7:00 AM to 7:29 AM | 1,457 (13.0%) | 1,518 (14.8%) |
| 7:30 AM to 7:59 AM | 759 (6.8%) | 775 (7.6%) |
| 8:00 AM to 8:29 AM | 1,161 (10.4%) | 1,695 (16.6%) |
| 8:30 AM to 8:59 AM | 410 (3.7%) | 558 (5.5%) |
| 9:00 AM to 9:59 AM | 413 (3.7%) | 846 (8.3%) |
| 10:00 AM to 10:59 AM | 272 (2.4%) | 290 (2.8%) |
| 11:00 AM to 11:59 AM | 287 (2.6%) | 141 (1.4%) |
| 12:00 PM to 3:59 PM | 1,006 (9.0%) | 928 (9.1%) |
| 4:00 PM to 11:59 PM | 870 (7.8%) | 585 (5.7%) |
| Total | 11,177 (100.0%) | 10,226 (100.0%) |
Housing Occupancy in Yucaipa
Occupancy by Ownership in Yucaipa
Of the total 18,593 dwellings in Yucaipa, owner-occupied units account for 13,641 (73.4%), while renter-occupied units make up 4,952 (26.6%).
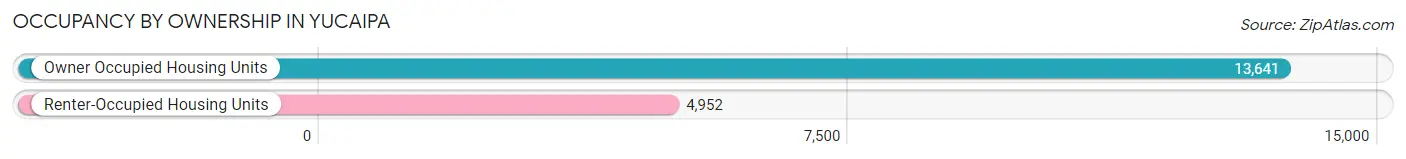
| Occupancy | # Housing Units | % Housing Units |
| Owner Occupied Housing Units | 13,641 | 73.4% |
| Renter-Occupied Housing Units | 4,952 | 26.6% |
| Total Occupied Housing Units | 18,593 | 100.0% |
Occupancy by Household Size in Yucaipa
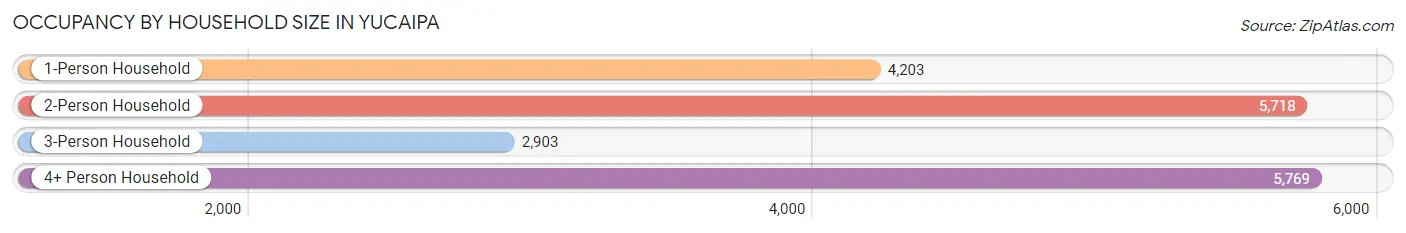
| Household Size | # Housing Units | % Housing Units |
| 1-Person Household | 4,203 | 22.6% |
| 2-Person Household | 5,718 | 30.7% |
| 3-Person Household | 2,903 | 15.6% |
| 4+ Person Household | 5,769 | 31.0% |
| Total Housing Units | 18,593 | 100.0% |
Occupancy by Ownership by Household Size in Yucaipa
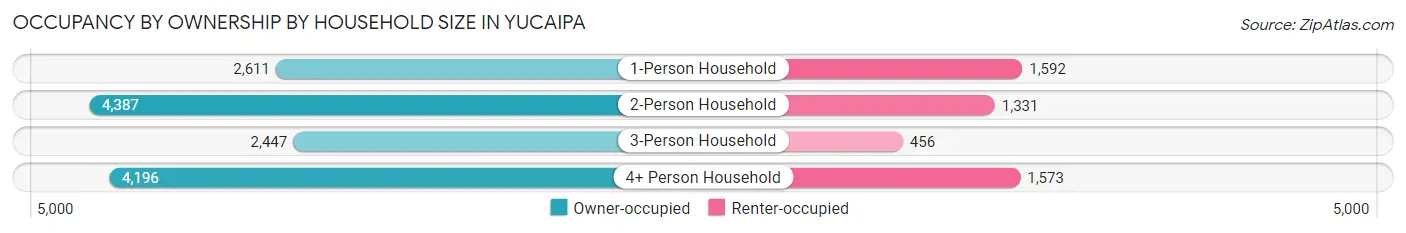
| Household Size | Owner-occupied | Renter-occupied |
| 1-Person Household | 2,611 (62.1%) | 1,592 (37.9%) |
| 2-Person Household | 4,387 (76.7%) | 1,331 (23.3%) |
| 3-Person Household | 2,447 (84.3%) | 456 (15.7%) |
| 4+ Person Household | 4,196 (72.7%) | 1,573 (27.3%) |
| Total Housing Units | 13,641 (73.4%) | 4,952 (26.6%) |
Occupancy by Educational Attainment in Yucaipa
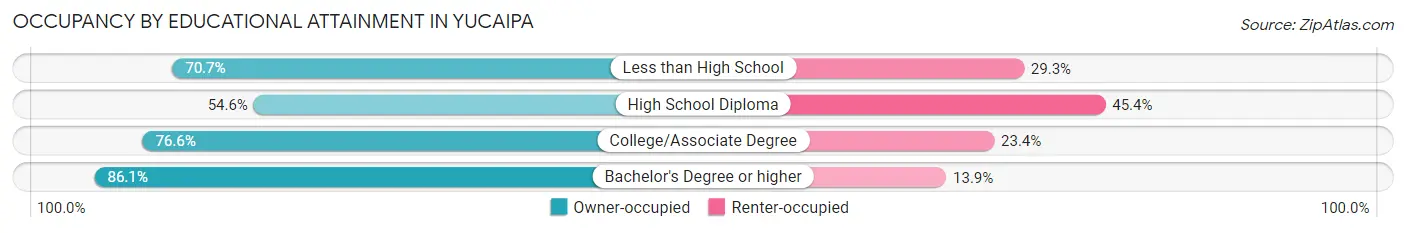
| Household Size | Owner-occupied | Renter-occupied |
| Less than High School | 1,323 (70.7%) | 548 (29.3%) |
| High School Diploma | 2,411 (54.6%) | 2,006 (45.4%) |
| College/Associate Degree | 5,568 (76.6%) | 1,699 (23.4%) |
| Bachelor's Degree or higher | 4,339 (86.1%) | 699 (13.9%) |
Occupancy by Age of Householder in Yucaipa
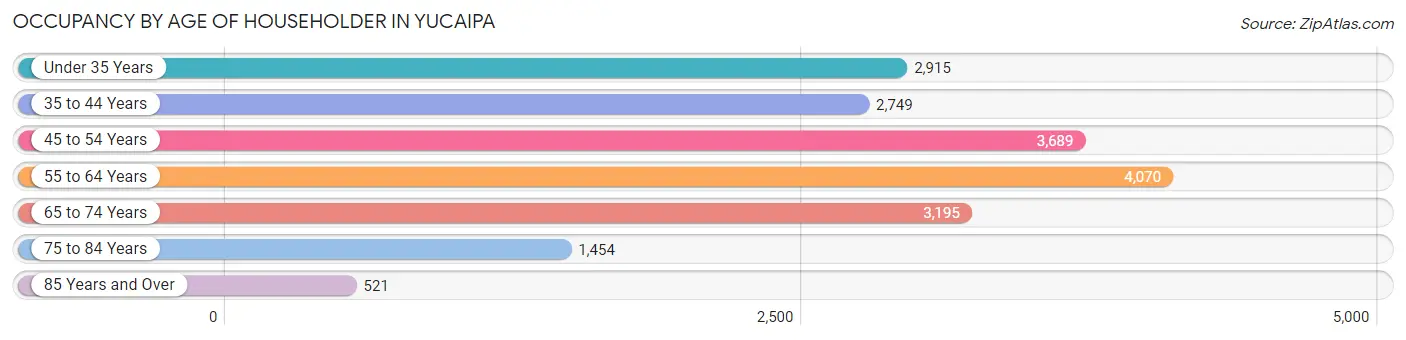
| Age Bracket | # Households | % Households |
| Under 35 Years | 2,915 | 15.7% |
| 35 to 44 Years | 2,749 | 14.8% |
| 45 to 54 Years | 3,689 | 19.8% |
| 55 to 64 Years | 4,070 | 21.9% |
| 65 to 74 Years | 3,195 | 17.2% |
| 75 to 84 Years | 1,454 | 7.8% |
| 85 Years and Over | 521 | 2.8% |
| Total | 18,593 | 100.0% |
Housing Finances in Yucaipa
Median Income by Occupancy in Yucaipa
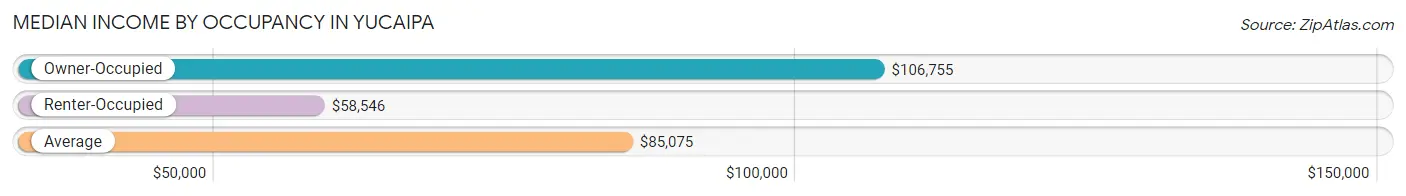
| Occupancy Type | # Households | Median Income |
| Owner-Occupied | 13,641 (73.4%) | $106,755 |
| Renter-Occupied | 4,952 (26.6%) | $58,546 |
| Average | 18,593 (100.0%) | $85,075 |
Occupancy by Householder Income Bracket in Yucaipa
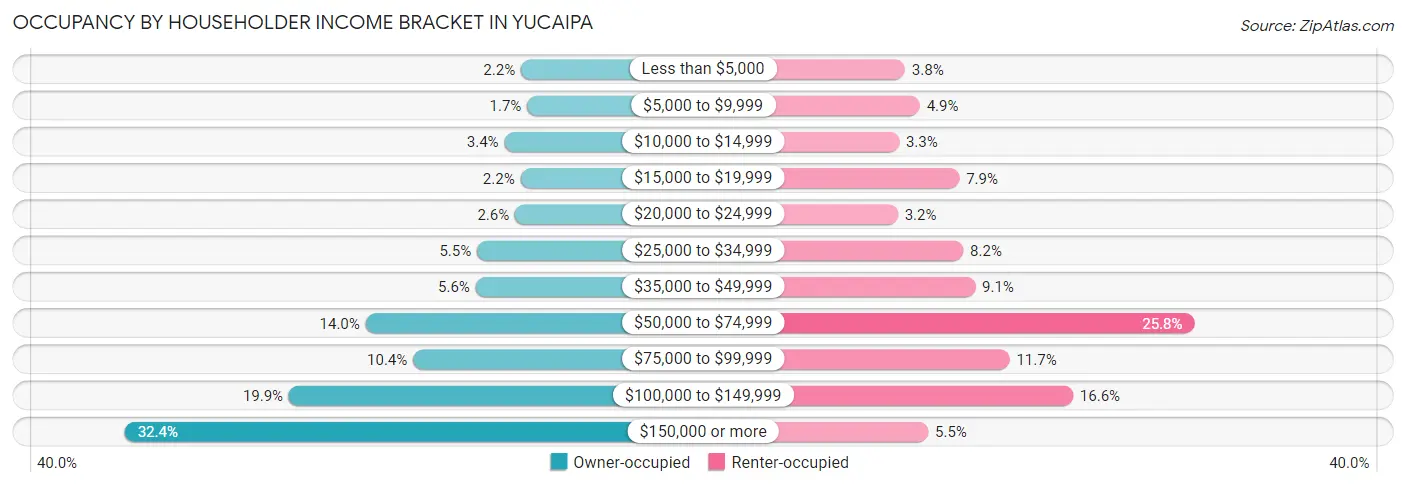
| Income Bracket | Owner-occupied | Renter-occupied |
| Less than $5,000 | 297 (2.2%) | 186 (3.8%) |
| $5,000 to $9,999 | 233 (1.7%) | 242 (4.9%) |
| $10,000 to $14,999 | 469 (3.4%) | 164 (3.3%) |
| $15,000 to $19,999 | 303 (2.2%) | 391 (7.9%) |
| $20,000 to $24,999 | 359 (2.6%) | 159 (3.2%) |
| $25,000 to $34,999 | 755 (5.5%) | 406 (8.2%) |
| $35,000 to $49,999 | 768 (5.6%) | 451 (9.1%) |
| $50,000 to $74,999 | 1,913 (14.0%) | 1,278 (25.8%) |
| $75,000 to $99,999 | 1,419 (10.4%) | 581 (11.7%) |
| $100,000 to $149,999 | 2,709 (19.9%) | 820 (16.6%) |
| $150,000 or more | 4,416 (32.4%) | 274 (5.5%) |
| Total | 13,641 (100.0%) | 4,952 (100.0%) |
Monthly Housing Cost Tiers in Yucaipa
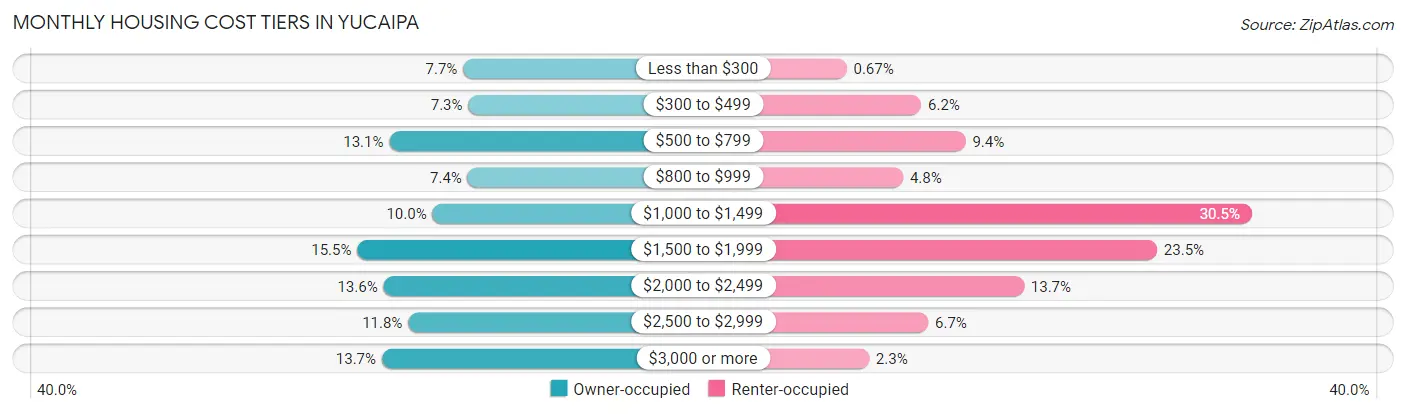
| Monthly Cost | Owner-occupied | Renter-occupied |
| Less than $300 | 1,051 (7.7%) | 33 (0.7%) |
| $300 to $499 | 998 (7.3%) | 305 (6.2%) |
| $500 to $799 | 1,793 (13.1%) | 467 (9.4%) |
| $800 to $999 | 1,005 (7.4%) | 239 (4.8%) |
| $1,000 to $1,499 | 1,359 (10.0%) | 1,511 (30.5%) |
| $1,500 to $1,999 | 2,114 (15.5%) | 1,165 (23.5%) |
| $2,000 to $2,499 | 1,851 (13.6%) | 680 (13.7%) |
| $2,500 to $2,999 | 1,603 (11.7%) | 331 (6.7%) |
| $3,000 or more | 1,867 (13.7%) | 115 (2.3%) |
| Total | 13,641 (100.0%) | 4,952 (100.0%) |
Physical Housing Characteristics in Yucaipa
Housing Structures in Yucaipa
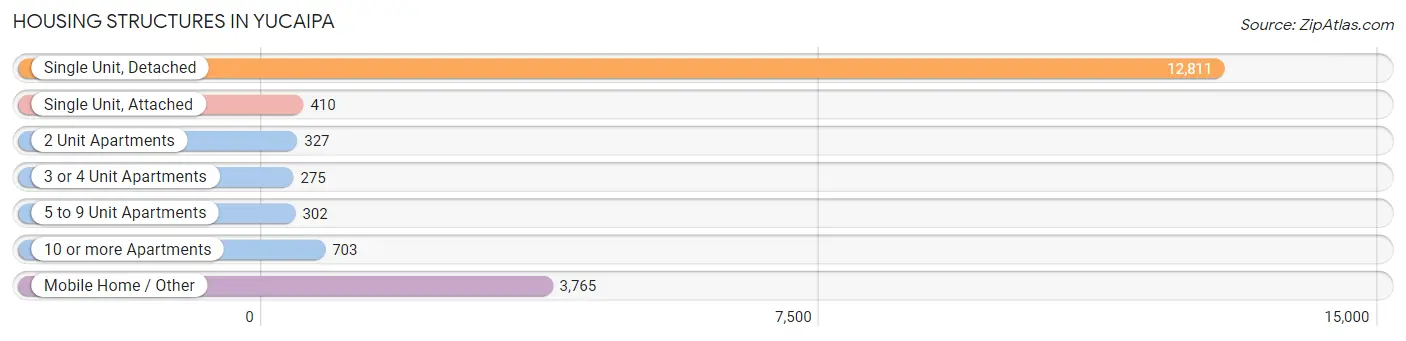
| Structure Type | # Housing Units | % Housing Units |
| Single Unit, Detached | 12,811 | 68.9% |
| Single Unit, Attached | 410 | 2.2% |
| 2 Unit Apartments | 327 | 1.8% |
| 3 or 4 Unit Apartments | 275 | 1.5% |
| 5 to 9 Unit Apartments | 302 | 1.6% |
| 10 or more Apartments | 703 | 3.8% |
| Mobile Home / Other | 3,765 | 20.3% |
| Total | 18,593 | 100.0% |
Housing Structures by Occupancy in Yucaipa
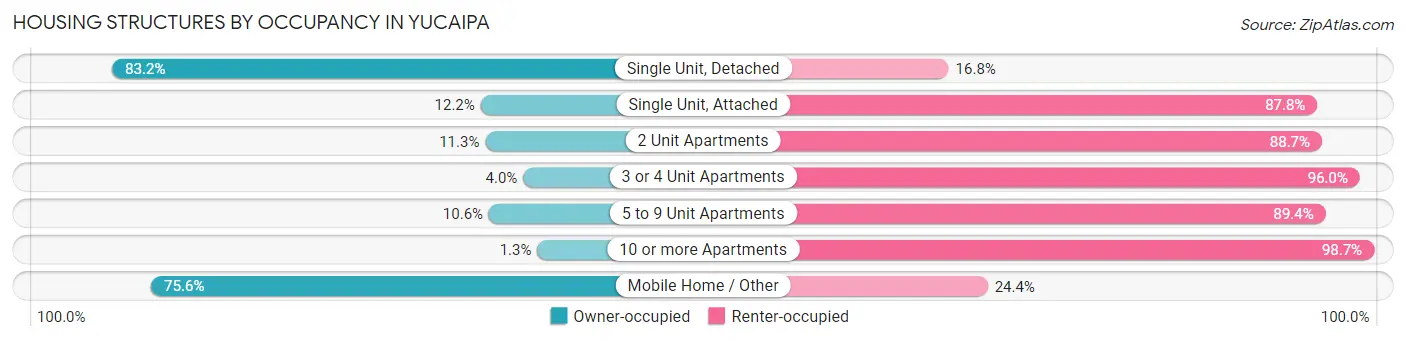
| Structure Type | Owner-occupied | Renter-occupied |
| Single Unit, Detached | 10,654 (83.2%) | 2,157 (16.8%) |
| Single Unit, Attached | 50 (12.2%) | 360 (87.8%) |
| 2 Unit Apartments | 37 (11.3%) | 290 (88.7%) |
| 3 or 4 Unit Apartments | 11 (4.0%) | 264 (96.0%) |
| 5 to 9 Unit Apartments | 32 (10.6%) | 270 (89.4%) |
| 10 or more Apartments | 9 (1.3%) | 694 (98.7%) |
| Mobile Home / Other | 2,848 (75.6%) | 917 (24.4%) |
| Total | 13,641 (73.4%) | 4,952 (26.6%) |
Housing Structures by Number of Rooms in Yucaipa
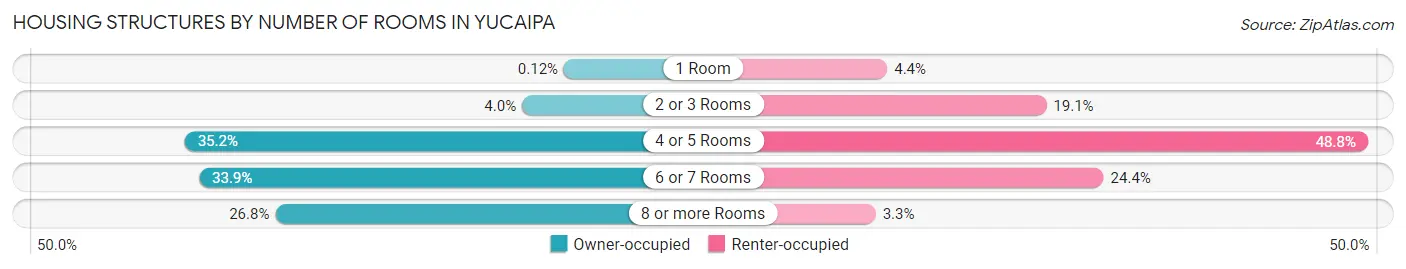
| Number of Rooms | Owner-occupied | Renter-occupied |
| 1 Room | 17 (0.1%) | 217 (4.4%) |
| 2 or 3 Rooms | 546 (4.0%) | 946 (19.1%) |
| 4 or 5 Rooms | 4,800 (35.2%) | 2,417 (48.8%) |
| 6 or 7 Rooms | 4,619 (33.9%) | 1,208 (24.4%) |
| 8 or more Rooms | 3,659 (26.8%) | 164 (3.3%) |
| Total | 13,641 (100.0%) | 4,952 (100.0%) |
Housing Structure by Heating Type in Yucaipa
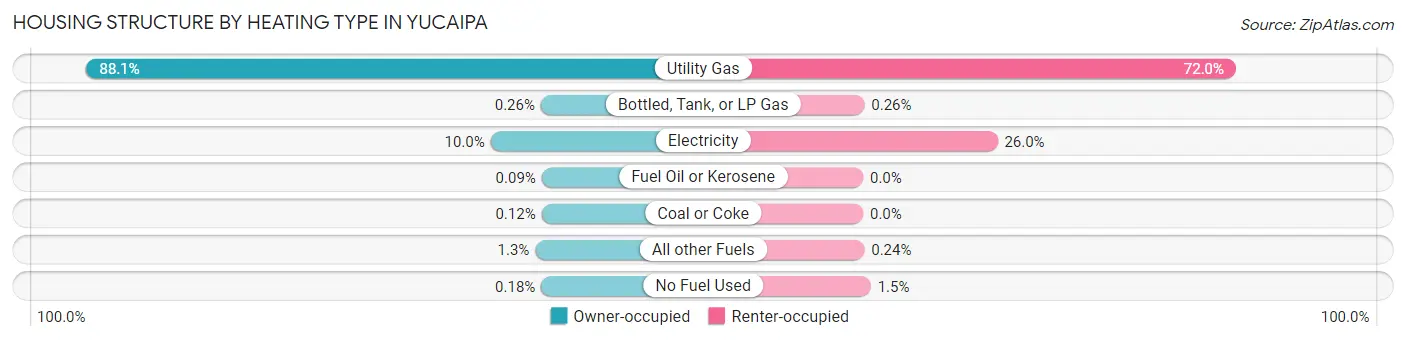
| Heating Type | Owner-occupied | Renter-occupied |
| Utility Gas | 12,012 (88.1%) | 3,567 (72.0%) |
| Bottled, Tank, or LP Gas | 35 (0.3%) | 13 (0.3%) |
| Electricity | 1,360 (10.0%) | 1,286 (26.0%) |
| Fuel Oil or Kerosene | 12 (0.1%) | 0 (0.0%) |
| Coal or Coke | 16 (0.1%) | 0 (0.0%) |
| All other Fuels | 181 (1.3%) | 12 (0.2%) |
| No Fuel Used | 25 (0.2%) | 74 (1.5%) |
| Total | 13,641 (100.0%) | 4,952 (100.0%) |
Household Vehicle Usage in Yucaipa
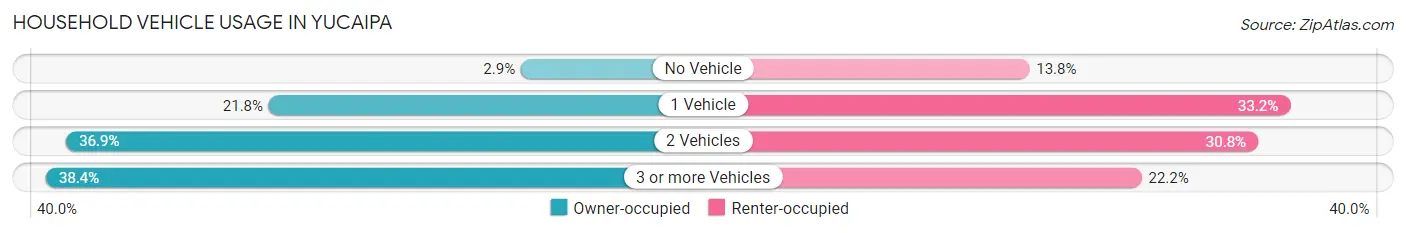
| Vehicles per Household | Owner-occupied | Renter-occupied |
| No Vehicle | 400 (2.9%) | 682 (13.8%) |
| 1 Vehicle | 2,968 (21.8%) | 1,646 (33.2%) |
| 2 Vehicles | 5,034 (36.9%) | 1,527 (30.8%) |
| 3 or more Vehicles | 5,239 (38.4%) | 1,097 (22.2%) |
| Total | 13,641 (100.0%) | 4,952 (100.0%) |
Real Estate & Mortgages in Yucaipa
Real Estate and Mortgage Overview in Yucaipa
| Characteristic | Without Mortgage | With Mortgage |
| Housing Units | 4,914 | 8,727 |
| Median Property Value | $204,900 | $465,900 |
| Median Household Income | $53,411 | $3,624 |
| Monthly Housing Costs | $563 | $1,858 |
| Real Estate Taxes | $1,639 | $233 |
Property Value by Mortgage Status in Yucaipa
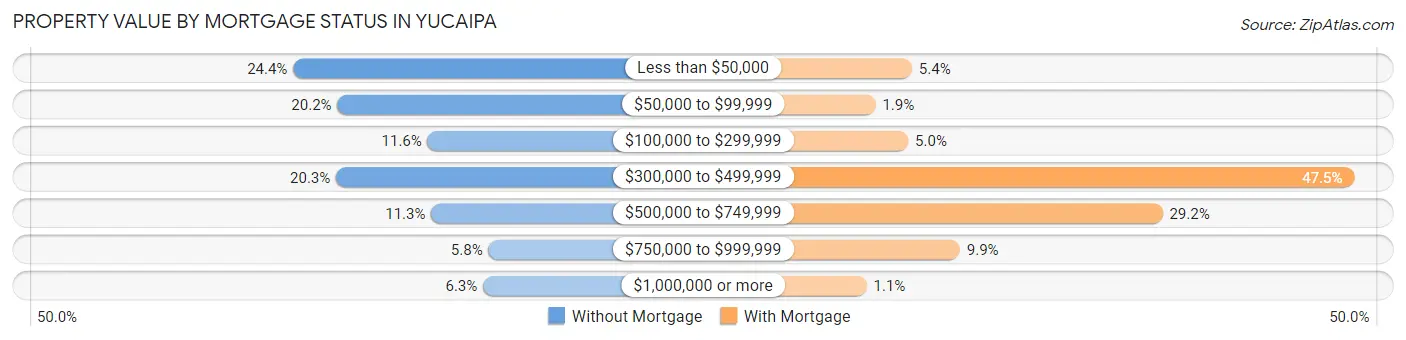
| Property Value | Without Mortgage | With Mortgage |
| Less than $50,000 | 1,200 (24.4%) | 469 (5.4%) |
| $50,000 to $99,999 | 993 (20.2%) | 166 (1.9%) |
| $100,000 to $299,999 | 571 (11.6%) | 437 (5.0%) |
| $300,000 to $499,999 | 999 (20.3%) | 4,145 (47.5%) |
| $500,000 to $749,999 | 554 (11.3%) | 2,551 (29.2%) |
| $750,000 to $999,999 | 286 (5.8%) | 867 (9.9%) |
| $1,000,000 or more | 311 (6.3%) | 92 (1.1%) |
| Total | 4,914 (100.0%) | 8,727 (100.0%) |
Household Income by Mortgage Status in Yucaipa
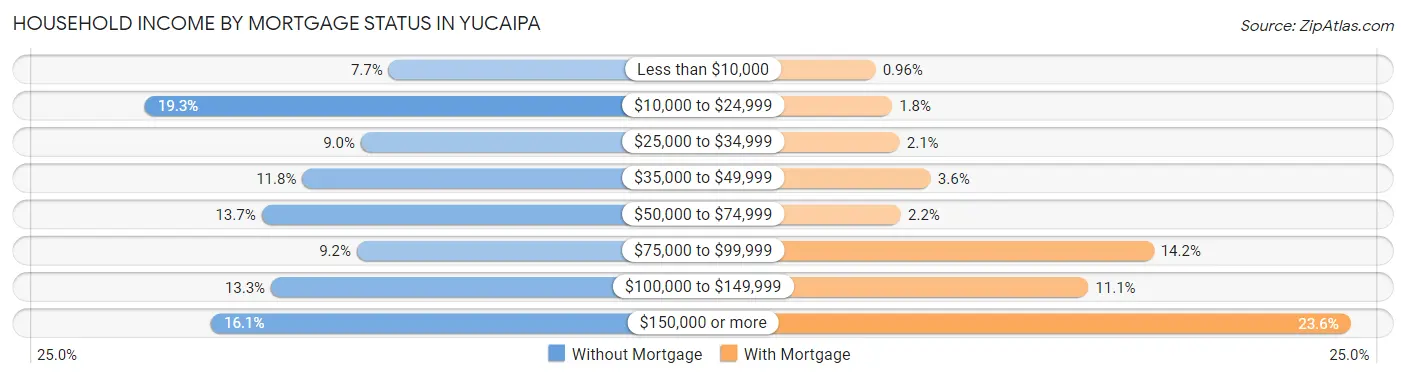
| Household Income | Without Mortgage | With Mortgage |
| Less than $10,000 | 377 (7.7%) | 84 (1.0%) |
| $10,000 to $24,999 | 947 (19.3%) | 153 (1.8%) |
| $25,000 to $34,999 | 442 (9.0%) | 184 (2.1%) |
| $35,000 to $49,999 | 579 (11.8%) | 313 (3.6%) |
| $50,000 to $74,999 | 674 (13.7%) | 189 (2.2%) |
| $75,000 to $99,999 | 451 (9.2%) | 1,239 (14.2%) |
| $100,000 to $149,999 | 652 (13.3%) | 968 (11.1%) |
| $150,000 or more | 792 (16.1%) | 2,057 (23.6%) |
| Total | 4,914 (100.0%) | 8,727 (100.0%) |
Property Value to Household Income Ratio in Yucaipa
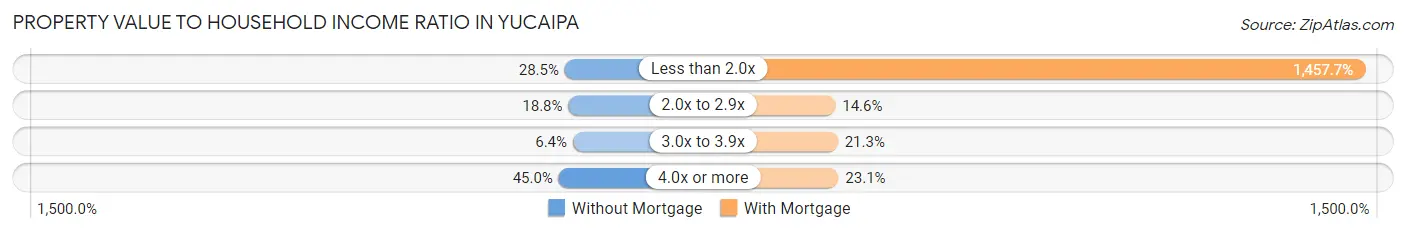
| Value-to-Income Ratio | Without Mortgage | With Mortgage |
| Less than 2.0x | 1,400 (28.5%) | 127,213 (1,457.7%) |
| 2.0x to 2.9x | 922 (18.8%) | 1,274 (14.6%) |
| 3.0x to 3.9x | 315 (6.4%) | 1,855 (21.3%) |
| 4.0x or more | 2,211 (45.0%) | 2,015 (23.1%) |
| Total | 4,914 (100.0%) | 8,727 (100.0%) |
Real Estate Taxes by Mortgage Status in Yucaipa
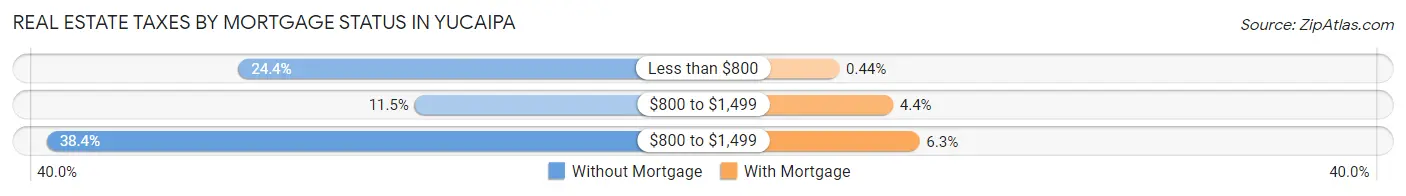
| Property Taxes | Without Mortgage | With Mortgage |
| Less than $800 | 1,198 (24.4%) | 38 (0.4%) |
| $800 to $1,499 | 565 (11.5%) | 381 (4.4%) |
| $800 to $1,499 | 1,886 (38.4%) | 551 (6.3%) |
| Total | 4,914 (100.0%) | 8,727 (100.0%) |
Health & Disability in Yucaipa
Health Insurance Coverage by Age in Yucaipa
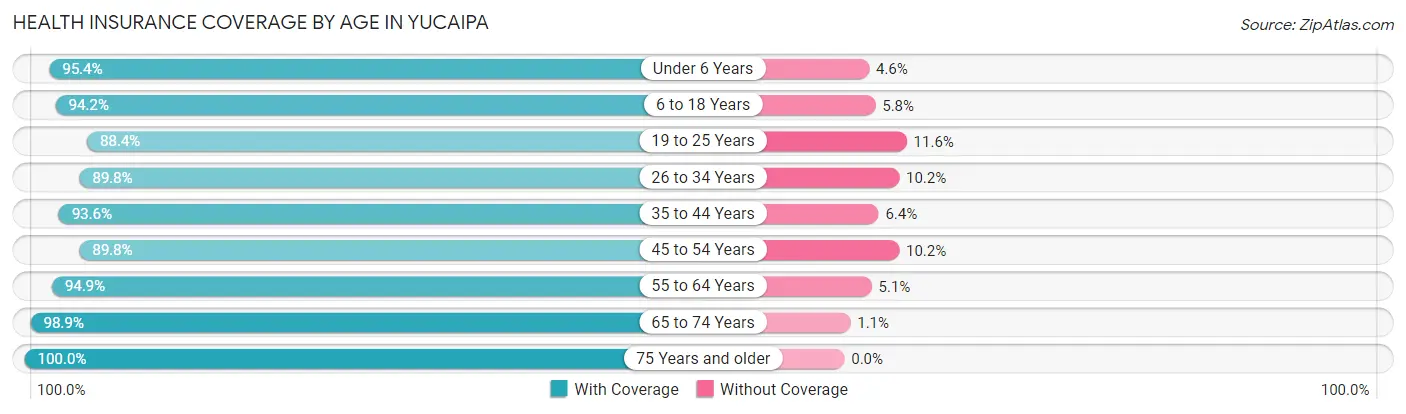
| Age Bracket | With Coverage | Without Coverage |
| Under 6 Years | 4,618 (95.4%) | 223 (4.6%) |
| 6 to 18 Years | 9,294 (94.2%) | 570 (5.8%) |
| 19 to 25 Years | 4,011 (88.4%) | 528 (11.6%) |
| 26 to 34 Years | 6,156 (89.8%) | 700 (10.2%) |
| 35 to 44 Years | 5,067 (93.6%) | 345 (6.4%) |
| 45 to 54 Years | 6,473 (89.8%) | 736 (10.2%) |
| 55 to 64 Years | 6,549 (94.9%) | 351 (5.1%) |
| 65 to 74 Years | 5,275 (98.9%) | 60 (1.1%) |
| 75 Years and older | 3,065 (100.0%) | 0 (0.0%) |
| Total | 50,508 (93.5%) | 3,513 (6.5%) |
Health Insurance Coverage by Citizenship Status in Yucaipa
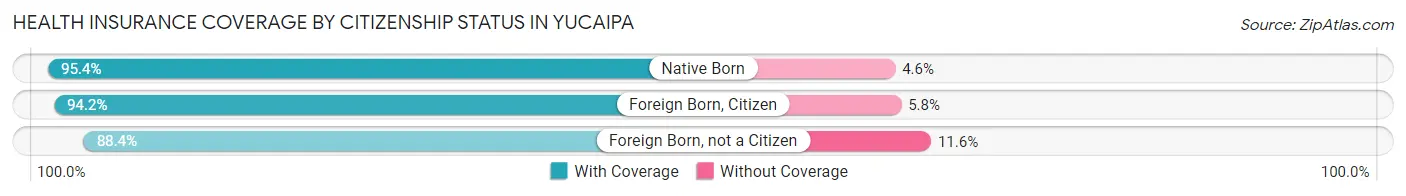
| Citizenship Status | With Coverage | Without Coverage |
| Native Born | 4,618 (95.4%) | 223 (4.6%) |
| Foreign Born, Citizen | 9,294 (94.2%) | 570 (5.8%) |
| Foreign Born, not a Citizen | 4,011 (88.4%) | 528 (11.6%) |
Health Insurance Coverage by Household Income in Yucaipa
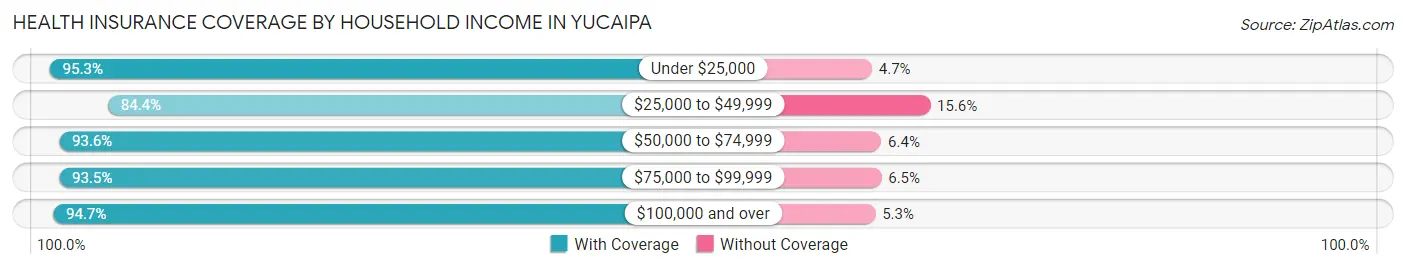
| Household Income | With Coverage | Without Coverage |
| Under $25,000 | 4,391 (95.3%) | 216 (4.7%) |
| $25,000 to $49,999 | 3,983 (84.4%) | 737 (15.6%) |
| $50,000 to $74,999 | 9,441 (93.6%) | 650 (6.4%) |
| $75,000 to $99,999 | 5,529 (93.5%) | 382 (6.5%) |
| $100,000 and over | 27,054 (94.7%) | 1,522 (5.3%) |
Public vs Private Health Insurance Coverage by Age in Yucaipa
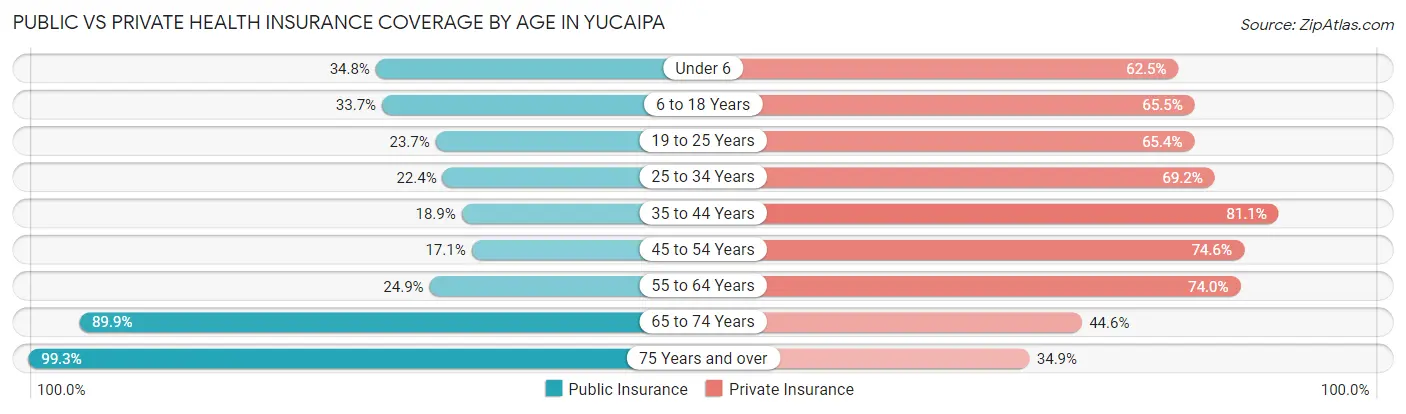
| Age Bracket | Public Insurance | Private Insurance |
| Under 6 | 1,686 (34.8%) | 3,024 (62.5%) |
| 6 to 18 Years | 3,322 (33.7%) | 6,459 (65.5%) |
| 19 to 25 Years | 1,077 (23.7%) | 2,969 (65.4%) |
| 25 to 34 Years | 1,538 (22.4%) | 4,744 (69.2%) |
| 35 to 44 Years | 1,023 (18.9%) | 4,388 (81.1%) |
| 45 to 54 Years | 1,229 (17.1%) | 5,378 (74.6%) |
| 55 to 64 Years | 1,715 (24.9%) | 5,103 (74.0%) |
| 65 to 74 Years | 4,796 (89.9%) | 2,381 (44.6%) |
| 75 Years and over | 3,044 (99.3%) | 1,070 (34.9%) |
| Total | 19,430 (36.0%) | 35,516 (65.7%) |
Disability Status by Sex by Age in Yucaipa
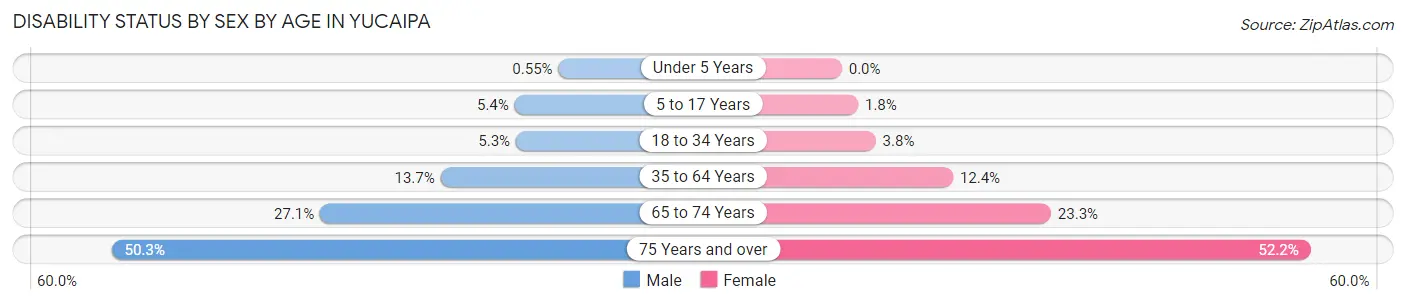
| Age Bracket | Male | Female |
| Under 5 Years | 10 (0.5%) | 0 (0.0%) |
| 5 to 17 Years | 259 (5.4%) | 98 (1.8%) |
| 18 to 34 Years | 330 (5.3%) | 222 (3.8%) |
| 35 to 64 Years | 1,353 (13.7%) | 1,192 (12.4%) |
| 65 to 74 Years | 675 (27.1%) | 662 (23.3%) |
| 75 Years and over | 564 (50.3%) | 1,015 (52.2%) |
Disability Class by Sex by Age in Yucaipa
Disability Class: Hearing Difficulty
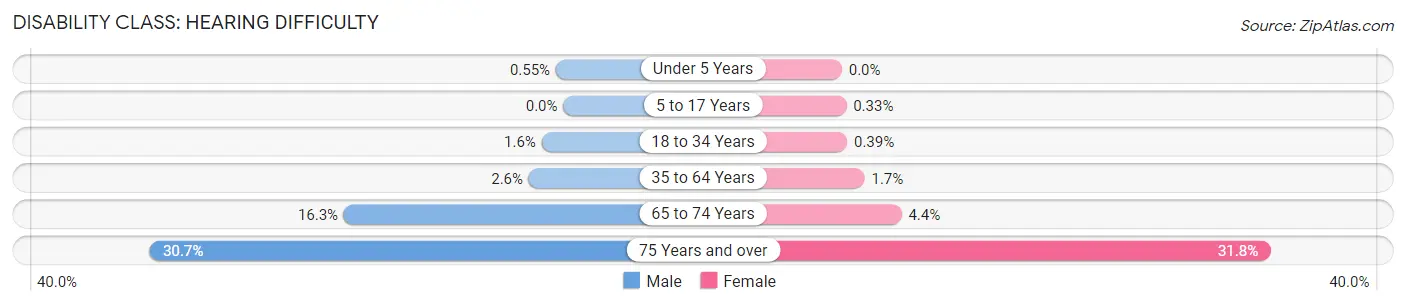
| Age Bracket | Male | Female |
| Under 5 Years | 10 (0.5%) | 0 (0.0%) |
| 5 to 17 Years | 0 (0.0%) | 18 (0.3%) |
| 18 to 34 Years | 101 (1.6%) | 23 (0.4%) |
| 35 to 64 Years | 253 (2.6%) | 163 (1.7%) |
| 65 to 74 Years | 406 (16.3%) | 126 (4.4%) |
| 75 Years and over | 344 (30.7%) | 618 (31.8%) |
Disability Class: Vision Difficulty
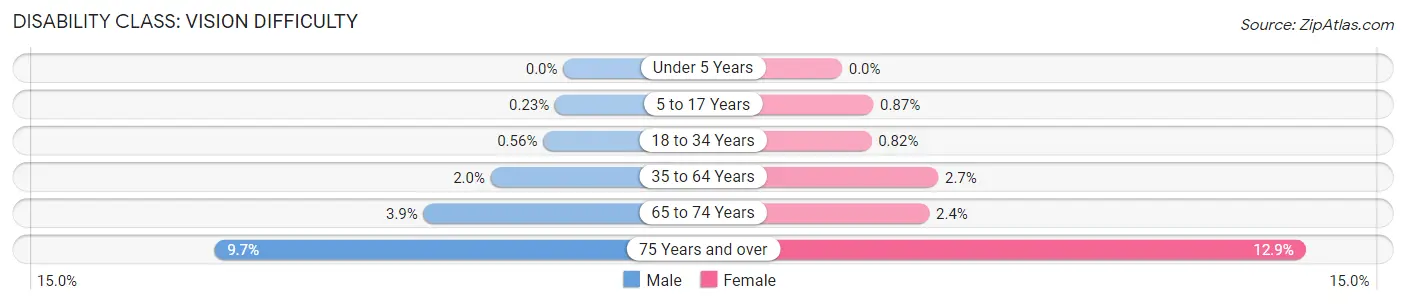
| Age Bracket | Male | Female |
| Under 5 Years | 0 (0.0%) | 0 (0.0%) |
| 5 to 17 Years | 11 (0.2%) | 47 (0.9%) |
| 18 to 34 Years | 35 (0.6%) | 48 (0.8%) |
| 35 to 64 Years | 200 (2.0%) | 258 (2.7%) |
| 65 to 74 Years | 97 (3.9%) | 69 (2.4%) |
| 75 Years and over | 109 (9.7%) | 251 (12.9%) |
Disability Class: Cognitive Difficulty
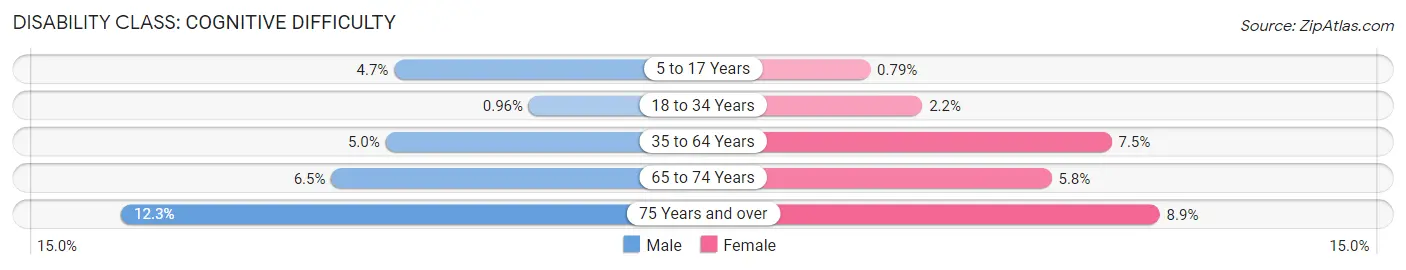
| Age Bracket | Male | Female |
| 5 to 17 Years | 225 (4.7%) | 43 (0.8%) |
| 18 to 34 Years | 60 (1.0%) | 132 (2.2%) |
| 35 to 64 Years | 490 (5.0%) | 723 (7.5%) |
| 65 to 74 Years | 161 (6.5%) | 166 (5.8%) |
| 75 Years and over | 138 (12.3%) | 172 (8.8%) |
Disability Class: Ambulatory Difficulty
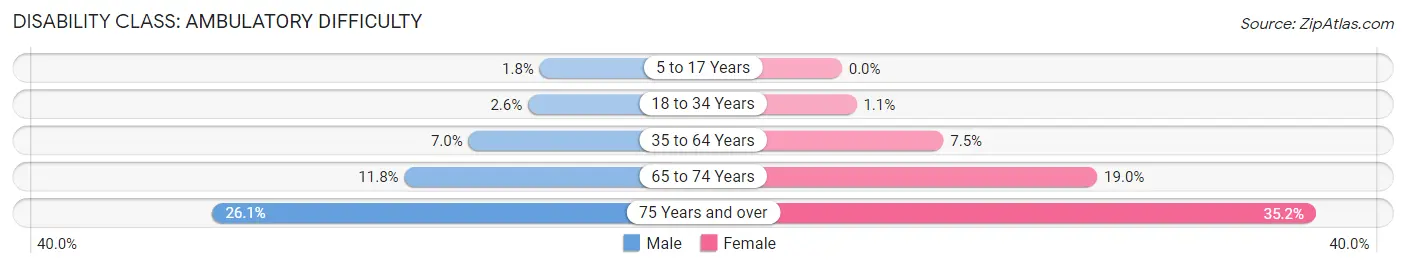
| Age Bracket | Male | Female |
| 5 to 17 Years | 84 (1.8%) | 0 (0.0%) |
| 18 to 34 Years | 164 (2.6%) | 64 (1.1%) |
| 35 to 64 Years | 696 (7.0%) | 726 (7.5%) |
| 65 to 74 Years | 294 (11.8%) | 539 (19.0%) |
| 75 Years and over | 292 (26.1%) | 684 (35.2%) |
Disability Class: Self-Care Difficulty
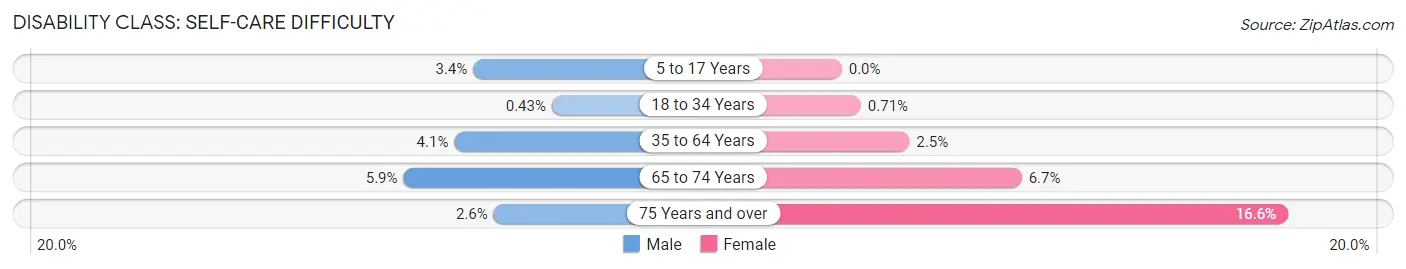
| Age Bracket | Male | Female |
| 5 to 17 Years | 160 (3.4%) | 0 (0.0%) |
| 18 to 34 Years | 27 (0.4%) | 42 (0.7%) |
| 35 to 64 Years | 401 (4.1%) | 242 (2.5%) |
| 65 to 74 Years | 148 (5.9%) | 190 (6.7%) |
| 75 Years and over | 29 (2.6%) | 322 (16.6%) |
Technology Access in Yucaipa
Computing Device Access in Yucaipa
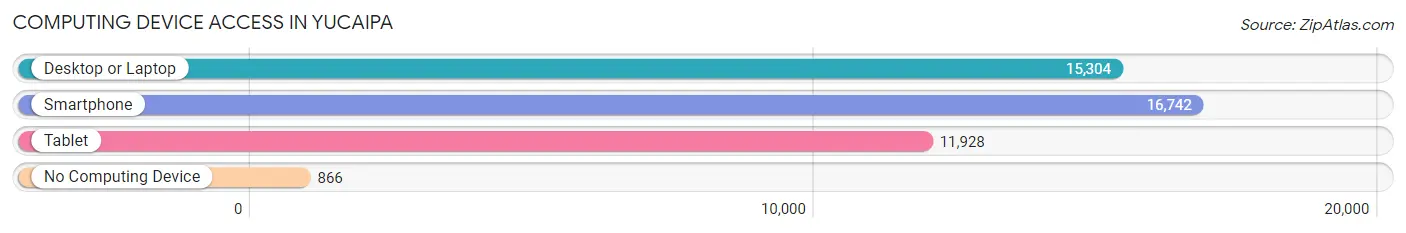
| Device Type | # Households | % Households |
| Desktop or Laptop | 15,304 | 82.3% |
| Smartphone | 16,742 | 90.0% |
| Tablet | 11,928 | 64.1% |
| No Computing Device | 866 | 4.7% |
| Total | 18,593 | 100.0% |
Internet Access in Yucaipa
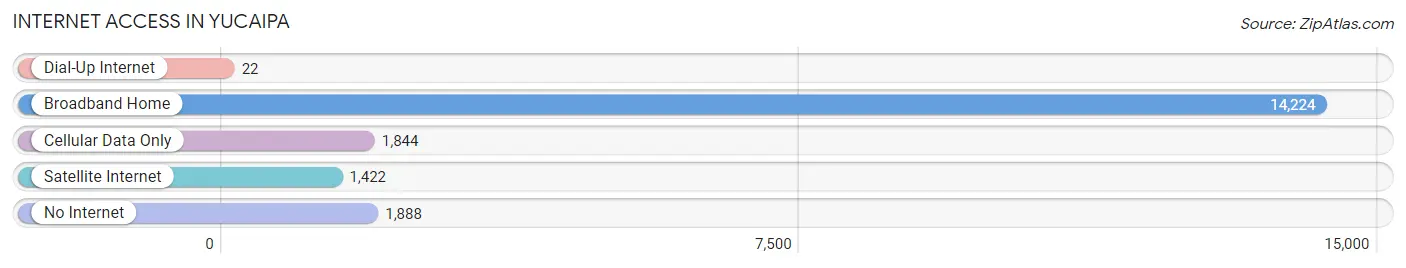
| Internet Type | # Households | % Households |
| Dial-Up Internet | 22 | 0.1% |
| Broadband Home | 14,224 | 76.5% |
| Cellular Data Only | 1,844 | 9.9% |
| Satellite Internet | 1,422 | 7.6% |
| No Internet | 1,888 | 10.2% |
| Total | 18,593 | 100.0% |
Yucaipa Summary
Yucaipa, California is a city located in San Bernardino County, California. It is situated in the foothills of the San Bernardino Mountains, approximately 10 miles east of San Bernardino. The city has a population of 51,367 as of the 2010 census, making it the largest city in the county.
History
Yucaipa was founded in 1887 by the Yucaipa Valley Land and Water Company. The company was formed by Benjamin Barton, a former mayor of San Bernardino, and his brother-in-law, John Brown. The two men purchased the land from the San Bernardino Valley Land and Water Company, which had been formed in 1883. The land was used for cattle ranching and farming.
In the early 1900s, the area began to experience a population boom as people moved to the area to take advantage of the fertile soil and mild climate. The city was incorporated in 1910 and the population continued to grow.
In the 1920s, the city experienced a period of growth and development. The city was home to a number of businesses, including a movie theater, a hotel, and a bank. The city also had a number of churches, schools, and a library.
In the 1950s, the city experienced a period of decline as people moved away from the area. The population decreased from a peak of 8,000 in 1950 to just over 5,000 in 1970.
In the 1970s, the city began to experience a period of revitalization. The city was home to a number of new businesses, including a shopping center and a movie theater. The city also had a number of new parks and recreational facilities.
In the 1980s, the city experienced a period of growth and development. The population increased from 5,000 in 1970 to over 10,000 in 1990. The city was home to a number of new businesses, including a shopping center and a movie theater. The city also had a number of new parks and recreational facilities.
Geography
Yucaipa is located in the foothills of the San Bernardino Mountains, approximately 10 miles east of San Bernardino. The city has a total area of 16.2 square miles, of which 16.1 square miles is land and 0.1 square miles is water.
The city is located at an elevation of 2,845 feet above sea level. The city is located in a semi-arid climate zone, with hot summers and mild winters. The average annual temperature is 68 degrees Fahrenheit.
Economy
Yucaipa is home to a number of businesses, including retail stores, restaurants, and professional services. The city is also home to a number of manufacturing companies, including a furniture manufacturer and a plastics manufacturer.
The city is home to a number of educational institutions, including Crafton Hills College and Yucaipa Valley College. The city is also home to a number of healthcare facilities, including a hospital and a number of medical offices.
Demographics
As of the 2010 census, the population of Yucaipa was 51,367. The racial makeup of the city was 75.3% White, 4.2% African American, 0.7% Native American, 1.3% Asian, 0.2% Pacific Islander, 15.2% from other races, and 3.2% from two or more races. Hispanic or Latino of any race were 28.3% of the population.
The median household income in Yucaipa was $50,945, and the median family income was $58,945. The per capita income in Yucaipa was $22,845. About 11.3% of families and 14.2% of the population were below the poverty line, including 19.2% of those under age 18 and 6.7% of those age 65 or over.
Common Questions
What is Per Capita Income in Yucaipa?
Per Capita income in Yucaipa is $36,729.
What is the Median Family Income in Yucaipa?
Median Family Income in Yucaipa is $108,106.
What is the Median Household income in Yucaipa?
Median Household Income in Yucaipa is $85,075.
What is Income or Wage Gap in Yucaipa?
Income or Wage Gap in Yucaipa is 31.7%.
Women in Yucaipa earn 68.3 cents for every dollar earned by a man.
What is Family Income Deficit in Yucaipa?
Family Income Deficit in Yucaipa is $8,660.
Families that are below poverty line in Yucaipa earn $8,660 less on average than the poverty threshold level.
What is Inequality or Gini Index in Yucaipa?
Inequality or Gini Index in Yucaipa is 0.43.
What is the Total Population of Yucaipa?
Total Population of Yucaipa is 54,428.
What is the Total Male Population of Yucaipa?
Total Male Population of Yucaipa is 26,512.
What is the Total Female Population of Yucaipa?
Total Female Population of Yucaipa is 27,916.
What is the Ratio of Males per 100 Females in Yucaipa?
There are 94.97 Males per 100 Females in Yucaipa.
What is the Ratio of Females per 100 Males in Yucaipa?
There are 105.30 Females per 100 Males in Yucaipa.
What is the Median Population Age in Yucaipa?
Median Population Age in Yucaipa is 36.4 Years.
What is the Average Family Size in Yucaipa
Average Family Size in Yucaipa is 3.4 People.
What is the Average Household Size in Yucaipa
Average Household Size in Yucaipa is 2.9 People.
How Large is the Labor Force in Yucaipa?
There are 25,967 People in the Labor Forcein in Yucaipa.
What is the Percentage of People in the Labor Force in Yucaipa?
61.8% of People are in the Labor Force in Yucaipa.
What is the Unemployment Rate in Yucaipa?
Unemployment Rate in Yucaipa is 6.8%.