Cities with the Largest African Community in South Carolina
RELATED REPORTS & OPTIONS
African
South Carolina
Compare Cities
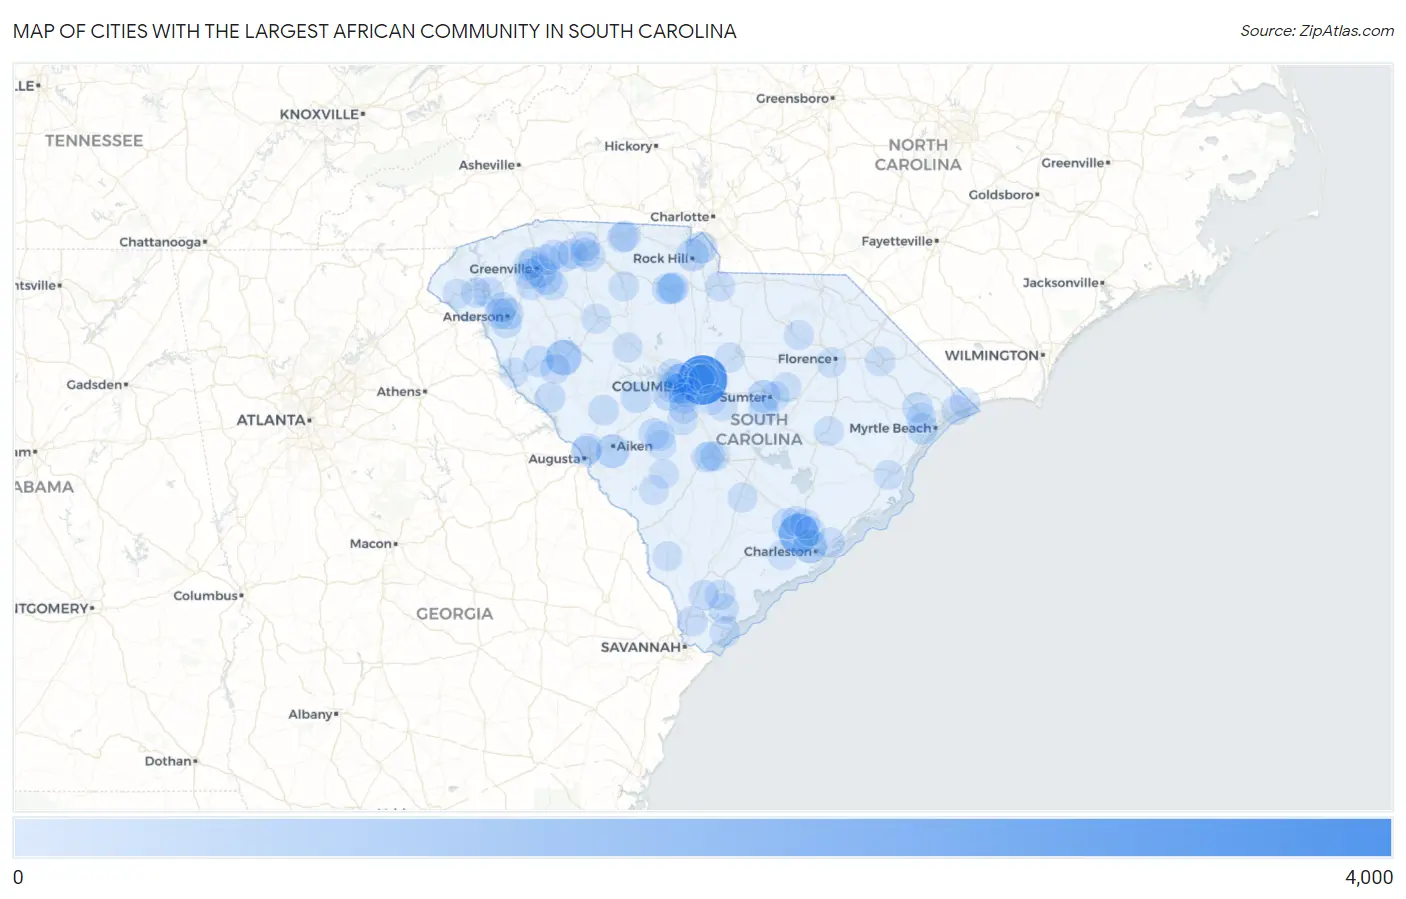
Map of Cities with the Largest African Community in South Carolina
0
4,000
Cities with the Largest African Community in South Carolina
| City | African | vs State | vs National | |
| 1. | Columbia | 3,439 | 38,814(8.86%)#1 | 1,871,898(0.18%)#59 |
| 2. | North Charleston | 1,770 | 38,814(4.56%)#2 | 1,871,898(0.09%)#142 |
| 3. | Greenwood | 969 | 38,814(2.50%)#3 | 1,871,898(0.05%)#261 |
| 4. | Charleston | 696 | 38,814(1.79%)#4 | 1,871,898(0.04%)#382 |
| 5. | Aiken | 611 | 38,814(1.57%)#5 | 1,871,898(0.03%)#446 |
| 6. | Sumter | 512 | 38,814(1.32%)#6 | 1,871,898(0.03%)#550 |
| 7. | Rock Hill | 462 | 38,814(1.19%)#7 | 1,871,898(0.02%)#620 |
| 8. | Greenville | 425 | 38,814(1.09%)#8 | 1,871,898(0.02%)#671 |
| 9. | West Columbia | 394 | 38,814(1.02%)#9 | 1,871,898(0.02%)#720 |
| 10. | Fort Mill | 383 | 38,814(0.99%)#10 | 1,871,898(0.02%)#751 |
| 11. | St Andrews | 382 | 38,814(0.98%)#11 | 1,871,898(0.02%)#754 |
| 12. | Red Bank | 343 | 38,814(0.88%)#12 | 1,871,898(0.02%)#826 |
| 13. | Anderson | 313 | 38,814(0.81%)#13 | 1,871,898(0.02%)#873 |
| 14. | Mauldin | 297 | 38,814(0.77%)#14 | 1,871,898(0.02%)#918 |
| 15. | Seven Oaks | 297 | 38,814(0.77%)#15 | 1,871,898(0.02%)#920 |
| 16. | Dentsville | 290 | 38,814(0.75%)#16 | 1,871,898(0.02%)#934 |
| 17. | Gayle Mill | 286 | 38,814(0.74%)#17 | 1,871,898(0.02%)#949 |
| 18. | Socastee | 263 | 38,814(0.68%)#18 | 1,871,898(0.01%)#1,023 |
| 19. | Batesburg Leesville | 228 | 38,814(0.59%)#19 | 1,871,898(0.01%)#1,178 |
| 20. | Summerville | 223 | 38,814(0.57%)#20 | 1,871,898(0.01%)#1,194 |
| 21. | Abbeville | 222 | 38,814(0.57%)#21 | 1,871,898(0.01%)#1,204 |
| 22. | Eureka Mill | 206 | 38,814(0.53%)#22 | 1,871,898(0.01%)#1,278 |
| 23. | Chester | 203 | 38,814(0.52%)#23 | 1,871,898(0.01%)#1,302 |
| 24. | Forest Acres | 202 | 38,814(0.52%)#24 | 1,871,898(0.01%)#1,304 |
| 25. | Homeland Park | 194 | 38,814(0.50%)#25 | 1,871,898(0.01%)#1,355 |
| 26. | Oak Grove | 193 | 38,814(0.50%)#26 | 1,871,898(0.01%)#1,361 |
| 27. | Wagener | 184 | 38,814(0.47%)#27 | 1,871,898(0.01%)#1,408 |
| 28. | Duncan | 182 | 38,814(0.47%)#28 | 1,871,898(0.01%)#1,420 |
| 29. | Gaffney | 178 | 38,814(0.46%)#29 | 1,871,898(0.01%)#1,455 |
| 30. | Berea | 175 | 38,814(0.45%)#30 | 1,871,898(0.01%)#1,465 |
| 31. | Mccormick | 169 | 38,814(0.44%)#31 | 1,871,898(0.01%)#1,495 |
| 32. | Clemson | 168 | 38,814(0.43%)#32 | 1,871,898(0.01%)#1,501 |
| 33. | Centerville | 168 | 38,814(0.43%)#33 | 1,871,898(0.01%)#1,504 |
| 34. | Conway | 166 | 38,814(0.43%)#34 | 1,871,898(0.01%)#1,512 |
| 35. | Sans Souci | 165 | 38,814(0.43%)#35 | 1,871,898(0.01%)#1,520 |
| 36. | Spartanburg | 164 | 38,814(0.42%)#36 | 1,871,898(0.01%)#1,523 |
| 37. | Belvedere | 163 | 38,814(0.42%)#37 | 1,871,898(0.01%)#1,534 |
| 38. | East Gaffney | 163 | 38,814(0.42%)#38 | 1,871,898(0.01%)#1,536 |
| 39. | Simpsonville | 158 | 38,814(0.41%)#39 | 1,871,898(0.01%)#1,563 |
| 40. | Welcome | 152 | 38,814(0.39%)#40 | 1,871,898(0.01%)#1,605 |
| 41. | Lexington | 149 | 38,814(0.38%)#41 | 1,871,898(0.01%)#1,617 |
| 42. | Taylors | 148 | 38,814(0.38%)#42 | 1,871,898(0.01%)#1,623 |
| 43. | Northlake | 143 | 38,814(0.37%)#43 | 1,871,898(0.01%)#1,668 |
| 44. | Capitol View | 141 | 38,814(0.36%)#44 | 1,871,898(0.01%)#1,687 |
| 45. | Johnston | 134 | 38,814(0.35%)#45 | 1,871,898(0.01%)#1,738 |
| 46. | Ladson | 123 | 38,814(0.32%)#46 | 1,871,898(0.01%)#1,838 |
| 47. | Greer | 119 | 38,814(0.31%)#47 | 1,871,898(0.01%)#1,869 |
| 48. | Swansea | 116 | 38,814(0.30%)#48 | 1,871,898(0.01%)#1,906 |
| 49. | Cayce | 115 | 38,814(0.30%)#49 | 1,871,898(0.01%)#1,915 |
| 50. | Pine Ridge | 115 | 38,814(0.30%)#50 | 1,871,898(0.01%)#1,922 |
| 51. | Promised Land | 110 | 38,814(0.28%)#51 | 1,871,898(0.01%)#1,966 |
| 52. | Hilton Head Island | 107 | 38,814(0.28%)#52 | 1,871,898(0.01%)#1,989 |
| 53. | Goose Creek | 106 | 38,814(0.27%)#53 | 1,871,898(0.01%)#1,996 |
| 54. | Wellford | 104 | 38,814(0.27%)#54 | 1,871,898(0.01%)#2,020 |
| 55. | Port Royal | 102 | 38,814(0.26%)#55 | 1,871,898(0.01%)#2,038 |
| 56. | Laurel Bay | 99 | 38,814(0.26%)#56 | 1,871,898(0.01%)#2,085 |
| 57. | Hardeeville | 91 | 38,814(0.23%)#57 | 1,871,898(0.00%)#2,180 |
| 58. | Ridgeland | 89 | 38,814(0.23%)#58 | 1,871,898(0.00%)#2,210 |
| 59. | Edisto | 89 | 38,814(0.23%)#59 | 1,871,898(0.00%)#2,212 |
| 60. | North Augusta | 87 | 38,814(0.22%)#60 | 1,871,898(0.00%)#2,232 |
| 61. | Valley Falls | 85 | 38,814(0.22%)#61 | 1,871,898(0.00%)#2,282 |
| 62. | Utica | 84 | 38,814(0.22%)#62 | 1,871,898(0.00%)#2,302 |
| 63. | Orangeburg | 77 | 38,814(0.20%)#63 | 1,871,898(0.00%)#2,403 |
| 64. | Little River | 77 | 38,814(0.20%)#64 | 1,871,898(0.00%)#2,407 |
| 65. | Woodfield | 75 | 38,814(0.19%)#65 | 1,871,898(0.00%)#2,448 |
| 66. | Union | 75 | 38,814(0.19%)#66 | 1,871,898(0.00%)#2,451 |
| 67. | Golden Grove | 75 | 38,814(0.19%)#67 | 1,871,898(0.00%)#2,456 |
| 68. | Mount Pleasant | 73 | 38,814(0.19%)#68 | 1,871,898(0.00%)#2,483 |
| 69. | Gaston | 72 | 38,814(0.19%)#69 | 1,871,898(0.00%)#2,527 |
| 70. | Lancaster | 71 | 38,814(0.18%)#70 | 1,871,898(0.00%)#2,537 |
| 71. | Mayesville | 68 | 38,814(0.18%)#71 | 1,871,898(0.00%)#2,603 |
| 72. | Calhoun Falls | 64 | 38,814(0.16%)#72 | 1,871,898(0.00%)#2,676 |
| 73. | Red Hill | 62 | 38,814(0.16%)#73 | 1,871,898(0.00%)#2,708 |
| 74. | Wilkinson Heights | 62 | 38,814(0.16%)#74 | 1,871,898(0.00%)#2,721 |
| 75. | Hanahan | 61 | 38,814(0.16%)#75 | 1,871,898(0.00%)#2,733 |
| 76. | Irmo | 61 | 38,814(0.16%)#76 | 1,871,898(0.00%)#2,737 |
| 77. | Georgetown | 60 | 38,814(0.15%)#77 | 1,871,898(0.00%)#2,761 |
| 78. | Marion | 59 | 38,814(0.15%)#78 | 1,871,898(0.00%)#2,785 |
| 79. | Arkwright | 58 | 38,814(0.15%)#79 | 1,871,898(0.00%)#2,821 |
| 80. | Gadsden | 57 | 38,814(0.15%)#80 | 1,871,898(0.00%)#2,858 |
| 81. | Florence | 54 | 38,814(0.14%)#81 | 1,871,898(0.00%)#2,911 |
| 82. | Clinton | 54 | 38,814(0.14%)#82 | 1,871,898(0.00%)#2,930 |
| 83. | Barnwell | 51 | 38,814(0.13%)#83 | 1,871,898(0.00%)#3,027 |
| 84. | Estill | 50 | 38,814(0.13%)#84 | 1,871,898(0.00%)#3,058 |
| 85. | Salley | 50 | 38,814(0.13%)#85 | 1,871,898(0.00%)#3,064 |
| 86. | Lugoff | 49 | 38,814(0.13%)#86 | 1,871,898(0.00%)#3,095 |
| 87. | Litchfield Beach | 48 | 38,814(0.12%)#87 | 1,871,898(0.00%)#3,122 |
| 88. | Hopkins | 48 | 38,814(0.12%)#88 | 1,871,898(0.00%)#3,135 |
| 89. | Hartsville | 47 | 38,814(0.12%)#89 | 1,871,898(0.00%)#3,155 |
| 90. | Saxon | 47 | 38,814(0.12%)#90 | 1,871,898(0.00%)#3,163 |
| 91. | Newberry | 45 | 38,814(0.12%)#91 | 1,871,898(0.00%)#3,229 |
| 92. | Blackville | 45 | 38,814(0.12%)#92 | 1,871,898(0.00%)#3,239 |
| 93. | St George | 45 | 38,814(0.12%)#93 | 1,871,898(0.00%)#3,240 |
| 94. | Kingstree | 44 | 38,814(0.11%)#94 | 1,871,898(0.00%)#3,274 |
| 95. | East Sumter | 43 | 38,814(0.11%)#95 | 1,871,898(0.00%)#3,310 |
| 96. | Perry | 43 | 38,814(0.11%)#96 | 1,871,898(0.00%)#3,313 |
| 97. | North Myrtle Beach | 41 | 38,814(0.11%)#97 | 1,871,898(0.00%)#3,349 |
| 98. | Hollywood | 41 | 38,814(0.11%)#98 | 1,871,898(0.00%)#3,366 |
| 99. | Westminster | 41 | 38,814(0.11%)#99 | 1,871,898(0.00%)#3,372 |
| 100. | Privateer | 41 | 38,814(0.11%)#100 | 1,871,898(0.00%)#3,373 |
Common Questions
What are the Top 10 Cities with the Largest African Community in South Carolina?
Top 10 Cities with the Largest African Community in South Carolina are:
#1
3,439
#2
1,770
#3
969
#4
696
#5
611
#6
512
#7
462
#8
425
#9
394
#10
383
What city has the Largest African Community in South Carolina?
Columbia has the Largest African Community in South Carolina with 3,439.
What is the Total African Population in the State of South Carolina?
Total African Population in South Carolina is 38,814.
What is the Total African Population in the United States?
Total African Population in the United States is 1,871,898.