Zip Codes with the Highest Percentage of Population Employed in Installation, Maintenance & Repair in Woodinville, WA
RELATED REPORTS & OPTIONS
Installation, Maintenance & Repair
Woodinville
Compare Zip Codes
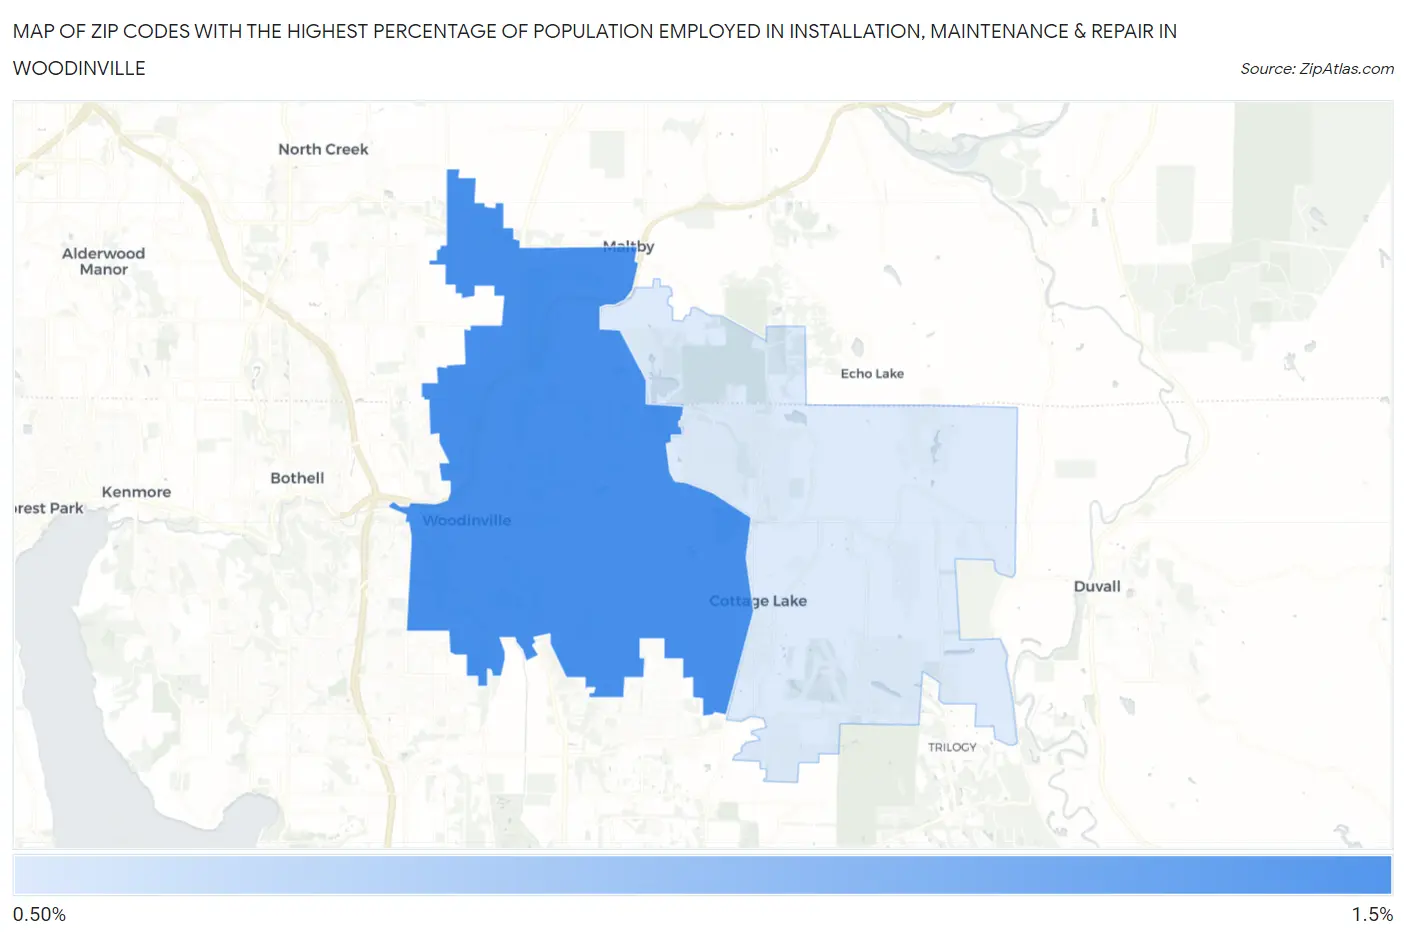
Map of Zip Codes with the Highest Percentage of Population Employed in Installation, Maintenance & Repair in Woodinville
0.78%
1.2%
Zip Codes with the Highest Percentage of Population Employed in Installation, Maintenance & Repair in Woodinville, WA
| Zip Code | % Employed | vs State | vs National | |
| 1. | 98072 | 1.2% | 2.9%(-1.75)#439 | 3.1%(-1.89)#25,338 |
| 2. | 98077 | 0.78% | 2.9%(-2.15)#471 | 3.1%(-2.29)#26,576 |
1
Common Questions
What are the Top Zip Codes with the Highest Percentage of Population Employed in Installation, Maintenance & Repair in Woodinville, WA?
Top Zip Codes with the Highest Percentage of Population Employed in Installation, Maintenance & Repair in Woodinville, WA are:
What zip code has the Highest Percentage of Population Employed in Installation, Maintenance & Repair in Woodinville, WA?
98072 has the Highest Percentage of Population Employed in Installation, Maintenance & Repair in Woodinville, WA with 1.2%.
What is the Percentage of Population Employed in Installation, Maintenance & Repair in Woodinville, WA?
Percentage of Population Employed in Installation, Maintenance & Repair in Woodinville is 0.85%.
What is the Percentage of Population Employed in Installation, Maintenance & Repair in Washington?
Percentage of Population Employed in Installation, Maintenance & Repair in Washington is 2.9%.
What is the Percentage of Population Employed in Installation, Maintenance & Repair in the United States?
Percentage of Population Employed in Installation, Maintenance & Repair in the United States is 3.1%.