Zip Codes with the Highest Percentage of Population Employed in Installation, Maintenance & Repair in Renton, WA
RELATED REPORTS & OPTIONS
Installation, Maintenance & Repair
Renton
Compare Zip Codes
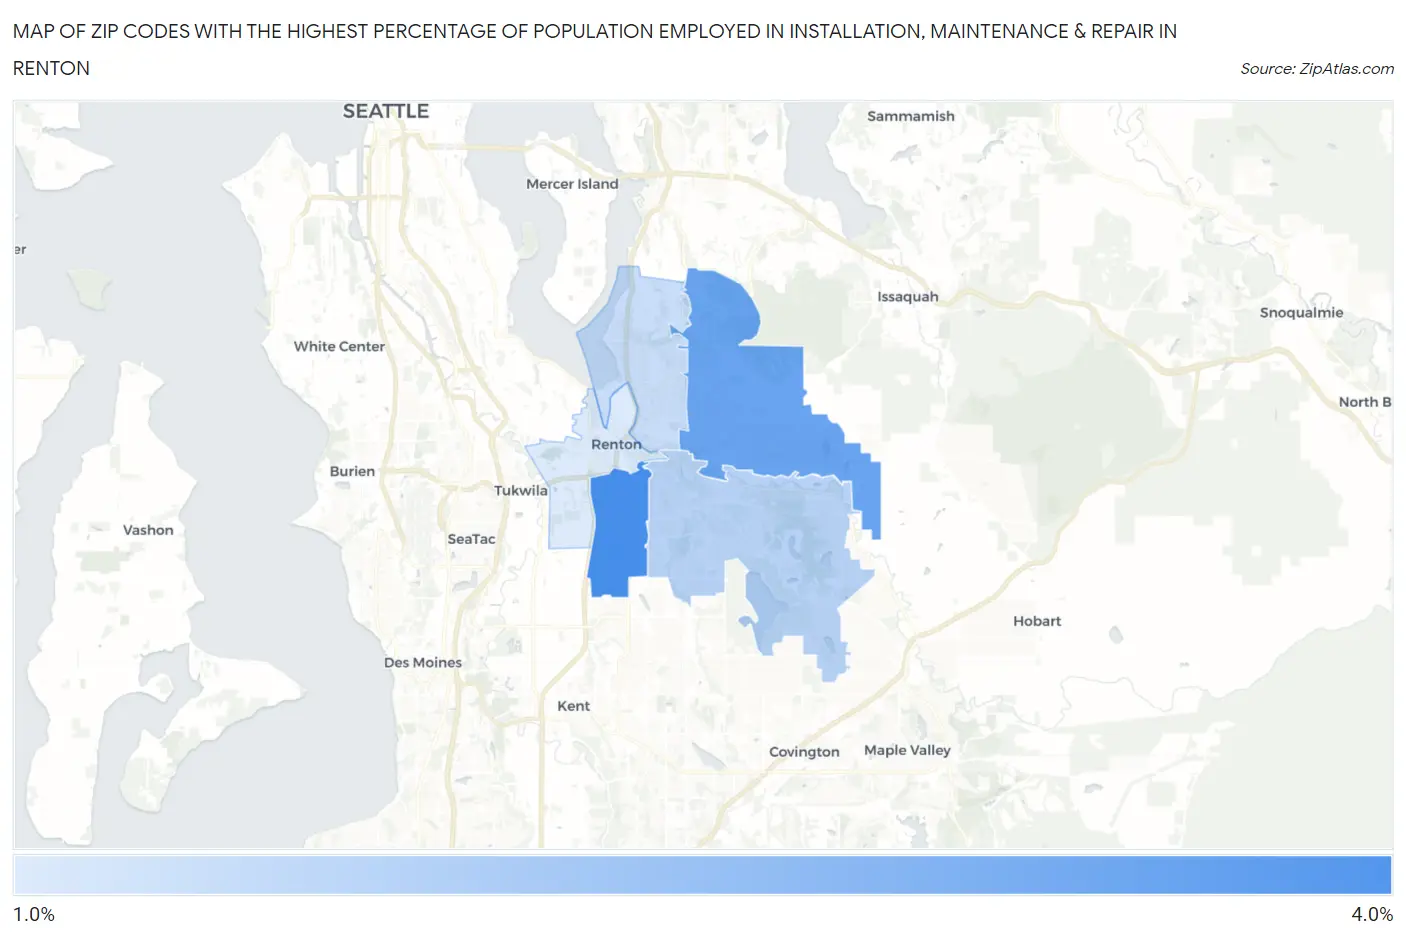
Map of Zip Codes with the Highest Percentage of Population Employed in Installation, Maintenance & Repair in Renton
1.6%
3.0%
Zip Codes with the Highest Percentage of Population Employed in Installation, Maintenance & Repair in Renton, WA
| Zip Code | % Employed | vs State | vs National | |
| 1. | 98055 | 3.0% | 2.9%(+0.110)#275 | 3.1%(-0.029)#16,804 |
| 2. | 98059 | 2.7% | 2.9%(-0.225)#309 | 3.1%(-0.364)#18,525 |
| 3. | 98058 | 1.9% | 2.9%(-0.987)#381 | 3.1%(-1.13)#22,285 |
| 4. | 98056 | 1.8% | 2.9%(-1.15)#396 | 3.1%(-1.29)#23,012 |
| 5. | 98057 | 1.6% | 2.9%(-1.35)#410 | 3.1%(-1.48)#23,833 |
1
Common Questions
What are the Top 3 Zip Codes with the Highest Percentage of Population Employed in Installation, Maintenance & Repair in Renton, WA?
Top 3 Zip Codes with the Highest Percentage of Population Employed in Installation, Maintenance & Repair in Renton, WA are:
What zip code has the Highest Percentage of Population Employed in Installation, Maintenance & Repair in Renton, WA?
98055 has the Highest Percentage of Population Employed in Installation, Maintenance & Repair in Renton, WA with 3.0%.
What is the Percentage of Population Employed in Installation, Maintenance & Repair in Renton, WA?
Percentage of Population Employed in Installation, Maintenance & Repair in Renton is 2.3%.
What is the Percentage of Population Employed in Installation, Maintenance & Repair in Washington?
Percentage of Population Employed in Installation, Maintenance & Repair in Washington is 2.9%.
What is the Percentage of Population Employed in Installation, Maintenance & Repair in the United States?
Percentage of Population Employed in Installation, Maintenance & Repair in the United States is 3.1%.