Zip Codes with the Highest Percentage of Population Employed in Installation, Maintenance & Repair in Edmonds, WA
RELATED REPORTS & OPTIONS
Installation, Maintenance & Repair
Edmonds
Compare Zip Codes
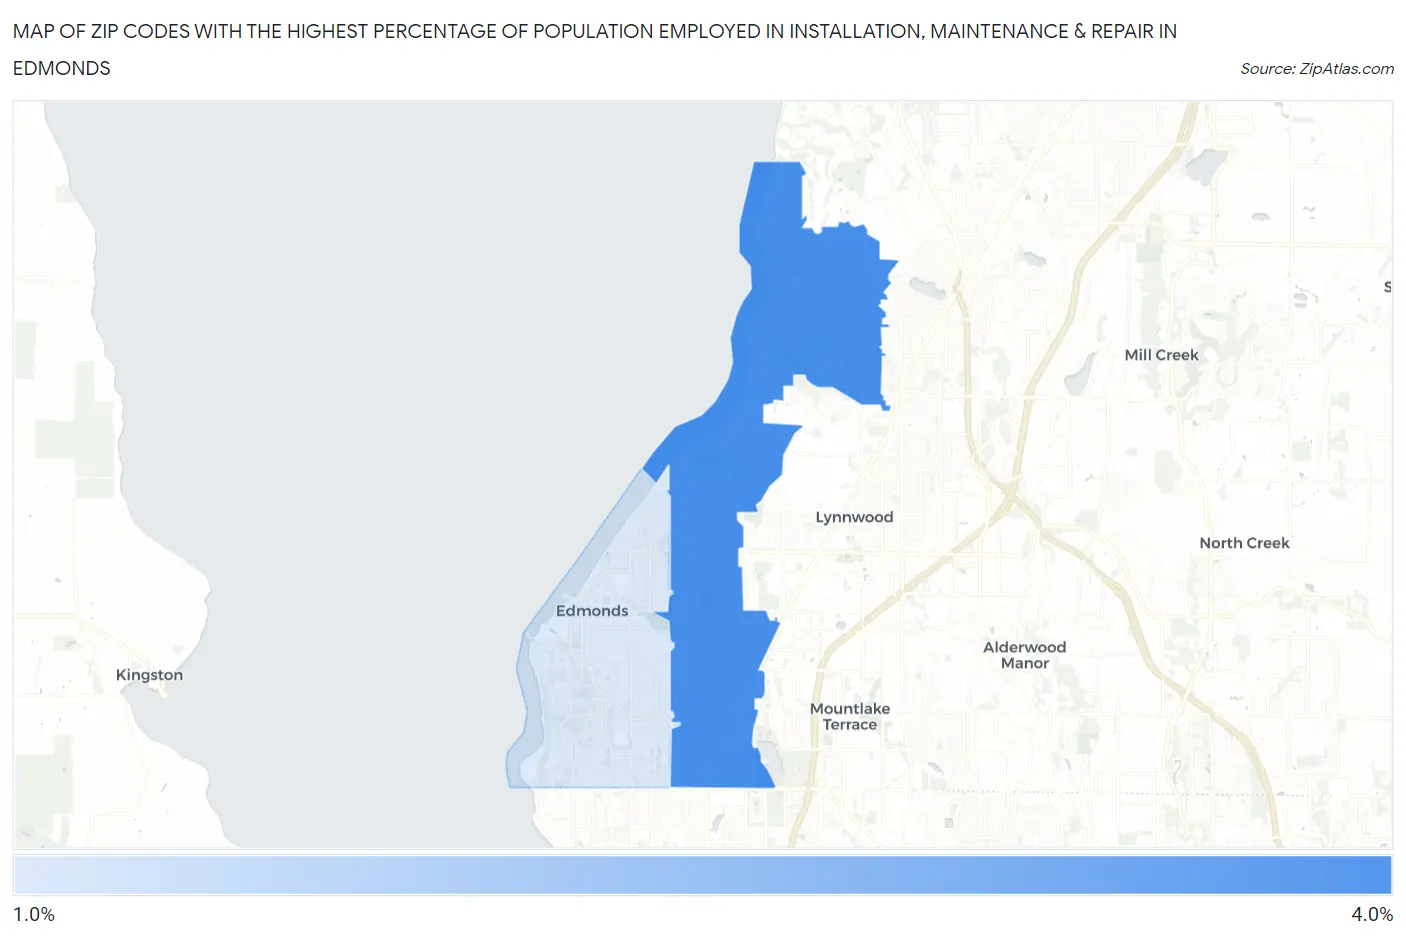
Map of Zip Codes with the Highest Percentage of Population Employed in Installation, Maintenance & Repair in Edmonds
1.9%
3.1%
Zip Codes with the Highest Percentage of Population Employed in Installation, Maintenance & Repair in Edmonds, WA
| Zip Code | % Employed | vs State | vs National | |
| 1. | 98026 | 3.1% | 2.9%(+0.142)#273 | 3.1%(+0.003)#16,662 |
| 2. | 98020 | 1.9% | 2.9%(-0.992)#382 | 3.1%(-1.13)#22,302 |
1
Common Questions
What are the Top Zip Codes with the Highest Percentage of Population Employed in Installation, Maintenance & Repair in Edmonds, WA?
Top Zip Codes with the Highest Percentage of Population Employed in Installation, Maintenance & Repair in Edmonds, WA are:
What zip code has the Highest Percentage of Population Employed in Installation, Maintenance & Repair in Edmonds, WA?
98026 has the Highest Percentage of Population Employed in Installation, Maintenance & Repair in Edmonds, WA with 3.1%.
What is the Percentage of Population Employed in Installation, Maintenance & Repair in Edmonds, WA?
Percentage of Population Employed in Installation, Maintenance & Repair in Edmonds is 2.5%.
What is the Percentage of Population Employed in Installation, Maintenance & Repair in Washington?
Percentage of Population Employed in Installation, Maintenance & Repair in Washington is 2.9%.
What is the Percentage of Population Employed in Installation, Maintenance & Repair in the United States?
Percentage of Population Employed in Installation, Maintenance & Repair in the United States is 3.1%.