Rocky Point, WA Map & Demographics
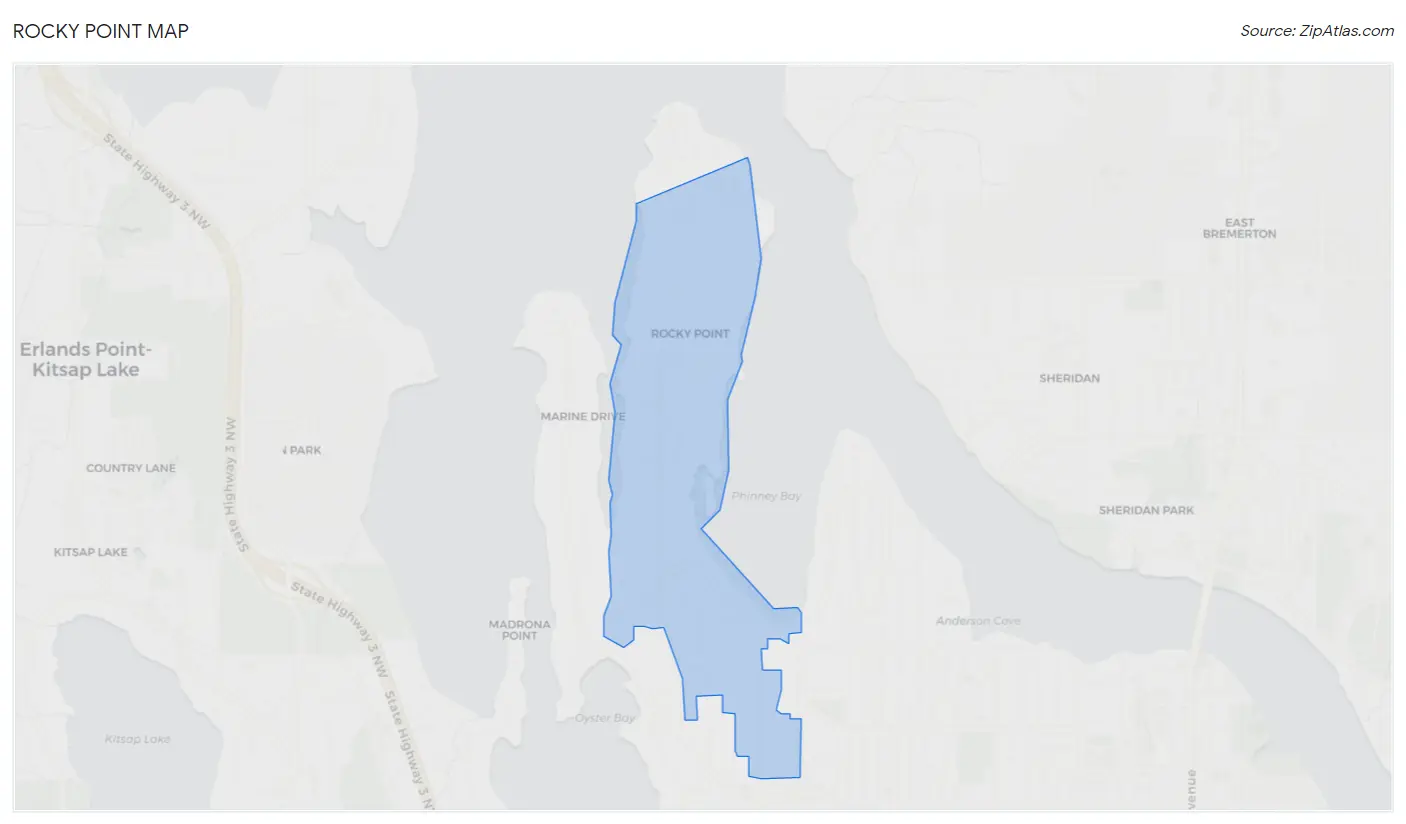
Rocky Point Map
Rocky Point Overview
$48,758
PER CAPITA INCOME
$103,487
AVG FAMILY INCOME
$93,988
AVG HOUSEHOLD INCOME
46.3%
WAGE / INCOME GAP [ % ]
53.7¢/ $1
WAGE / INCOME GAP [ $ ]
0.39
INEQUALITY / GINI INDEX
1,546
TOTAL POPULATION
843
MALE POPULATION
703
FEMALE POPULATION
119.91
MALES / 100 FEMALES
83.39
FEMALES / 100 MALES
44.9
MEDIAN AGE
2.7
AVG FAMILY SIZE
2.3
AVG HOUSEHOLD SIZE
898
LABOR FORCE [ PEOPLE ]
67.1%
PERCENT IN LABOR FORCE
6.8%
UNEMPLOYMENT RATE
Income in Rocky Point
Income Overview in Rocky Point
Per Capita Income in Rocky Point is $48,758, while median incomes of families and households are $103,487 and $93,988 respectively.
| Characteristic | Number | Measure |
| Per Capita Income | 1,546 | $48,758 |
| Median Family Income | 435 | $103,487 |
| Mean Family Income | 435 | $114,561 |
| Median Household Income | 685 | $93,988 |
| Mean Household Income | 685 | $106,994 |
| Income Deficit | 435 | $0 |
| Wage / Income Gap (%) | 1,546 | 46.26% |
| Wage / Income Gap ($) | 1,546 | 53.74¢ per $1 |
| Gini / Inequality Index | 1,546 | 0.39 |
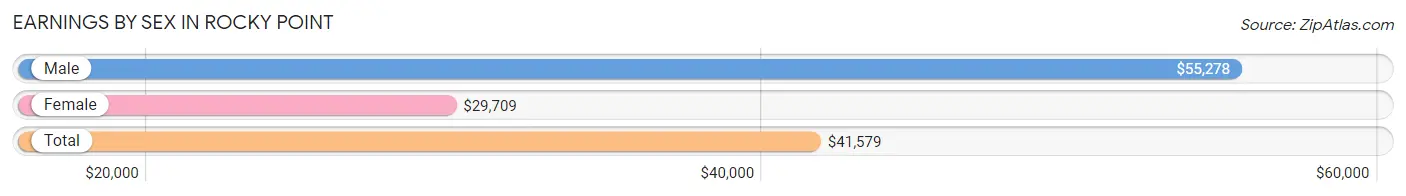
Earnings by Sex in Rocky Point
Average Earnings in Rocky Point are $41,579, $55,278 for men and $29,709 for women, a difference of 46.3%.
| Sex | Number | Average Earnings |
| Male | 514 (56.1%) | $55,278 |
| Female | 402 (43.9%) | $29,709 |
| Total | 916 (100.0%) | $41,579 |
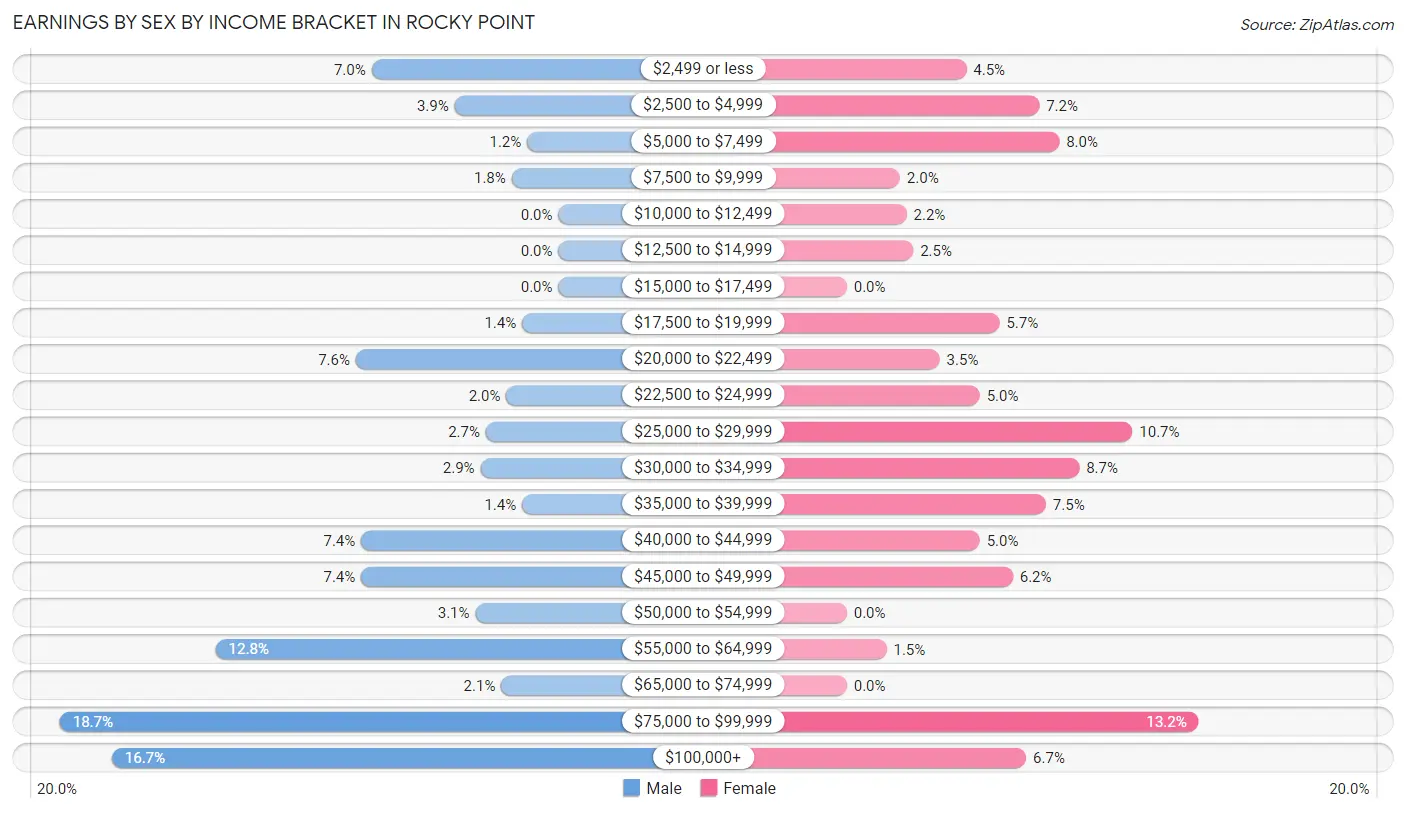
Earnings by Sex by Income Bracket in Rocky Point
The most common earnings brackets in Rocky Point are $75,000 to $99,999 for men (96 | 18.7%) and $75,000 to $99,999 for women (53 | 13.2%).
| Income | Male | Female |
| $2,499 or less | 36 (7.0%) | 18 (4.5%) |
| $2,500 to $4,999 | 20 (3.9%) | 29 (7.2%) |
| $5,000 to $7,499 | 6 (1.2%) | 32 (8.0%) |
| $7,500 to $9,999 | 9 (1.8%) | 8 (2.0%) |
| $10,000 to $12,499 | 0 (0.0%) | 9 (2.2%) |
| $12,500 to $14,999 | 0 (0.0%) | 10 (2.5%) |
| $15,000 to $17,499 | 0 (0.0%) | 0 (0.0%) |
| $17,500 to $19,999 | 7 (1.4%) | 23 (5.7%) |
| $20,000 to $22,499 | 39 (7.6%) | 14 (3.5%) |
| $22,500 to $24,999 | 10 (1.9%) | 20 (5.0%) |
| $25,000 to $29,999 | 14 (2.7%) | 43 (10.7%) |
| $30,000 to $34,999 | 15 (2.9%) | 35 (8.7%) |
| $35,000 to $39,999 | 7 (1.4%) | 30 (7.5%) |
| $40,000 to $44,999 | 38 (7.4%) | 20 (5.0%) |
| $45,000 to $49,999 | 38 (7.4%) | 25 (6.2%) |
| $50,000 to $54,999 | 16 (3.1%) | 0 (0.0%) |
| $55,000 to $64,999 | 66 (12.8%) | 6 (1.5%) |
| $65,000 to $74,999 | 11 (2.1%) | 0 (0.0%) |
| $75,000 to $99,999 | 96 (18.7%) | 53 (13.2%) |
| $100,000+ | 86 (16.7%) | 27 (6.7%) |
| Total | 514 (100.0%) | 402 (100.0%) |
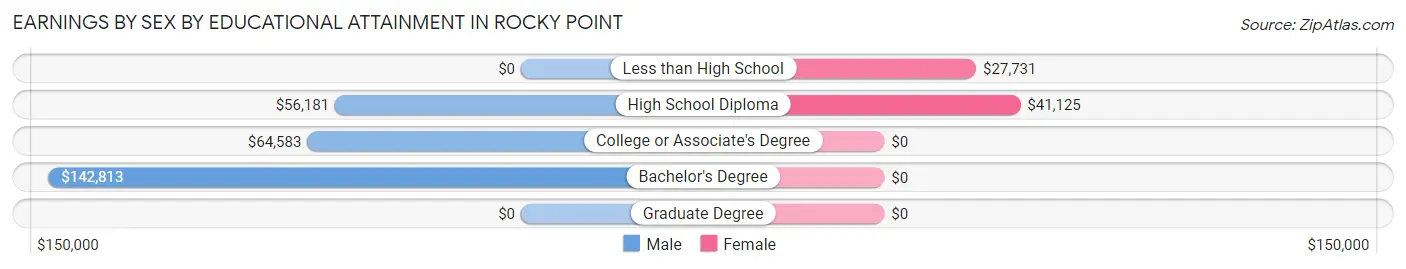
Earnings by Sex by Educational Attainment in Rocky Point
Average earnings in Rocky Point are $63,125 for men and $29,506 for women, a difference of 53.3%. Men with an educational attainment of bachelor's degree enjoy the highest average annual earnings of $142,813, while those with high school diploma education earn the least with $56,181. Women with an educational attainment of high school diploma earn the most with the average annual earnings of $41,125, while those with less than high school education have the smallest earnings of $27,731.
| Educational Attainment | Male Income | Female Income |
| Less than High School | - | - |
| High School Diploma | $56,181 | $41,125 |
| College or Associate's Degree | $64,583 | $0 |
| Bachelor's Degree | $142,813 | $0 |
| Graduate Degree | - | - |
| Total | $63,125 | $29,506 |
Family Income in Rocky Point
Family Income Brackets in Rocky Point
According to the Rocky Point family income data, there are 94 families falling into the $150,000 to $199,999 income range, which is the most common income bracket and makes up 21.6% of all families.
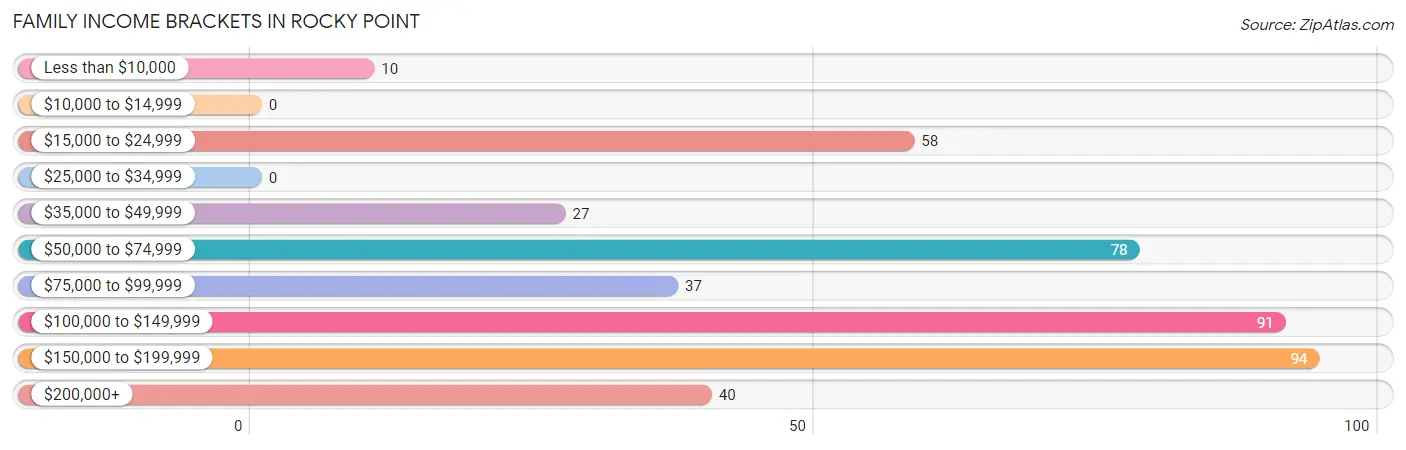
| Income Bracket | # Families | % Families |
| Less than $10,000 | 10 | 2.3% |
| $10,000 to $14,999 | 0 | 0.0% |
| $15,000 to $24,999 | 58 | 13.3% |
| $25,000 to $34,999 | 0 | 0.0% |
| $35,000 to $49,999 | 27 | 6.2% |
| $50,000 to $74,999 | 78 | 17.9% |
| $75,000 to $99,999 | 37 | 8.5% |
| $100,000 to $149,999 | 91 | 20.9% |
| $150,000 to $199,999 | 94 | 21.6% |
| $200,000+ | 40 | 9.2% |
Family Income by Famaliy Size in Rocky Point
3-person families (133 | 30.6%) account for the highest median family income in Rocky Point with $135,875 per family, while 3-person families (133 | 30.6%) have the highest median income of $45,292 per family member.
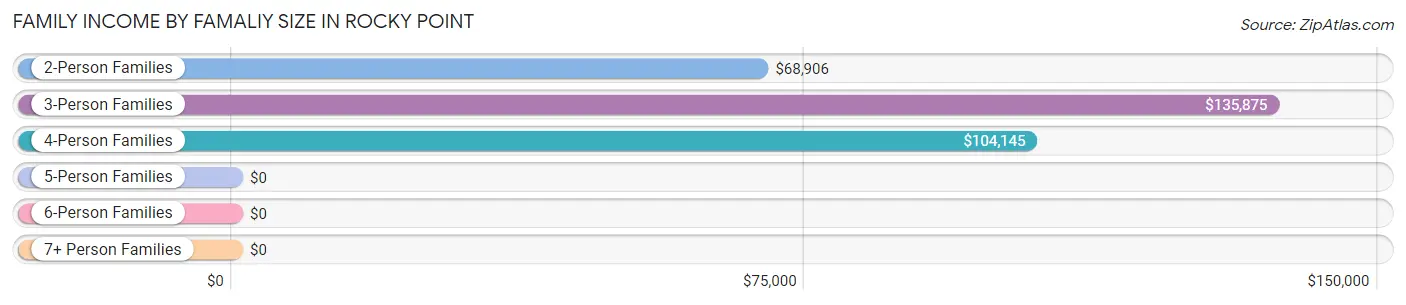
| Income Bracket | # Families | Median Income |
| 2-Person Families | 237 (54.5%) | $68,906 |
| 3-Person Families | 133 (30.6%) | $135,875 |
| 4-Person Families | 39 (9.0%) | $104,145 |
| 5-Person Families | 21 (4.8%) | $0 |
| 6-Person Families | 5 (1.1%) | $0 |
| 7+ Person Families | 0 (0.0%) | $0 |
| Total | 435 (100.0%) | $103,487 |
Family Income by Number of Earners in Rocky Point
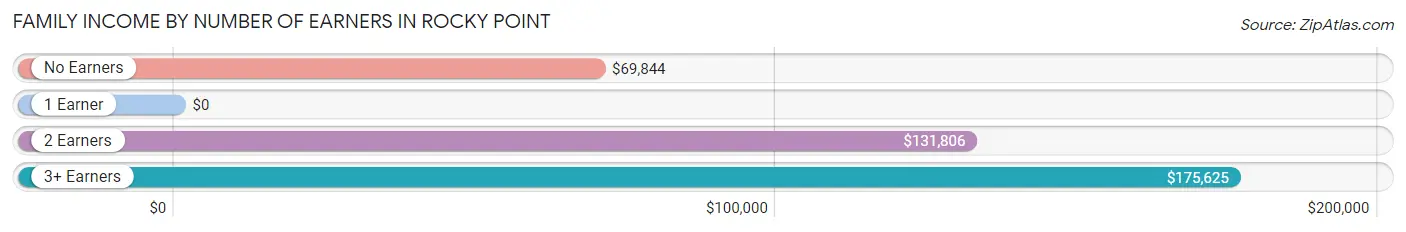
| Number of Earners | # Families | Median Income |
| No Earners | 79 (18.2%) | $69,844 |
| 1 Earner | 146 (33.6%) | $0 |
| 2 Earners | 173 (39.8%) | $131,806 |
| 3+ Earners | 37 (8.5%) | $175,625 |
| Total | 435 (100.0%) | $103,487 |
Household Income in Rocky Point
Household Income Brackets in Rocky Point
With 129 households falling in the category, the $50,000 to $74,999 income range is the most frequent in Rocky Point, accounting for 18.8% of all households. In contrast, only 10 households (1.5%) fall into the $10,000 to $14,999 income bracket, making it the least populous group.
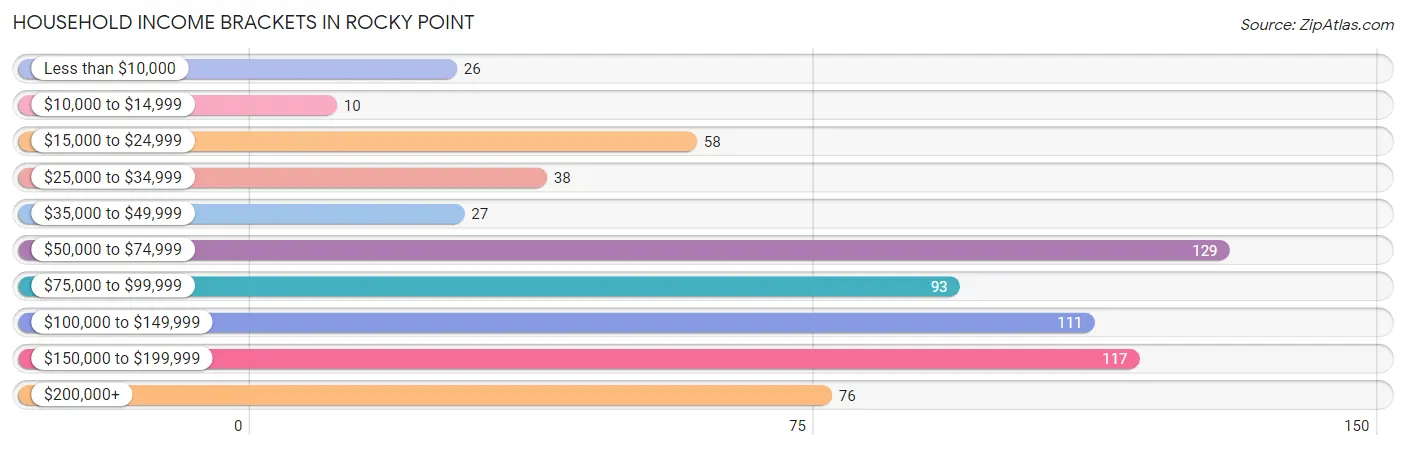
| Income Bracket | # Households | % Households |
| Less than $10,000 | 26 | 3.8% |
| $10,000 to $14,999 | 10 | 1.5% |
| $15,000 to $24,999 | 58 | 8.5% |
| $25,000 to $34,999 | 38 | 5.5% |
| $35,000 to $49,999 | 27 | 3.9% |
| $50,000 to $74,999 | 129 | 18.8% |
| $75,000 to $99,999 | 93 | 13.6% |
| $100,000 to $149,999 | 111 | 16.2% |
| $150,000 to $199,999 | 117 | 17.1% |
| $200,000+ | 76 | 11.1% |
Household Income by Householder Age in Rocky Point
The median household income in Rocky Point is $93,988, with the highest median household income of $98,000 found in the 25 to 44 years age bracket for the primary householder. A total of 196 households (28.6%) fall into this category. Meanwhile, the 15 to 24 years age bracket for the primary householder has the lowest median household income of $0, with 28 households (4.1%) in this group.
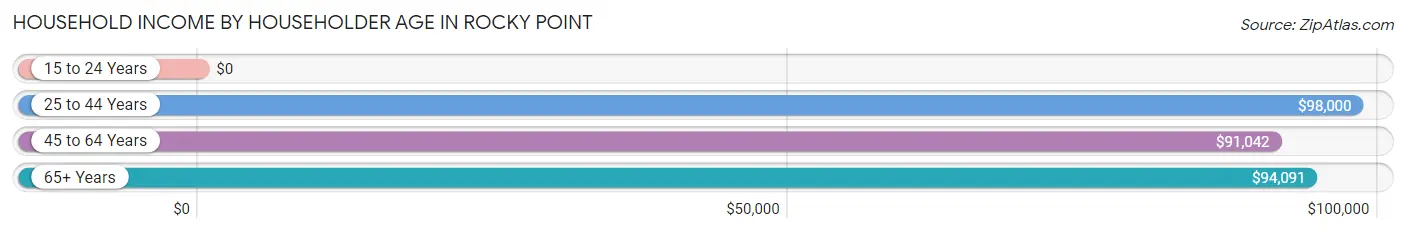
| Income Bracket | # Households | Median Income |
| 15 to 24 Years | 28 (4.1%) | $0 |
| 25 to 44 Years | 196 (28.6%) | $98,000 |
| 45 to 64 Years | 287 (41.9%) | $91,042 |
| 65+ Years | 174 (25.4%) | $94,091 |
| Total | 685 (100.0%) | $93,988 |
Poverty in Rocky Point
Income Below Poverty by Sex and Age in Rocky Point
With 4.0% poverty level for males and 2.8% for females among the residents of Rocky Point, 75 year old and over males and 35 to 44 year old females are the most vulnerable to poverty, with 9 males (19.6%) and 10 females (10.7%) in their respective age groups living below the poverty level.
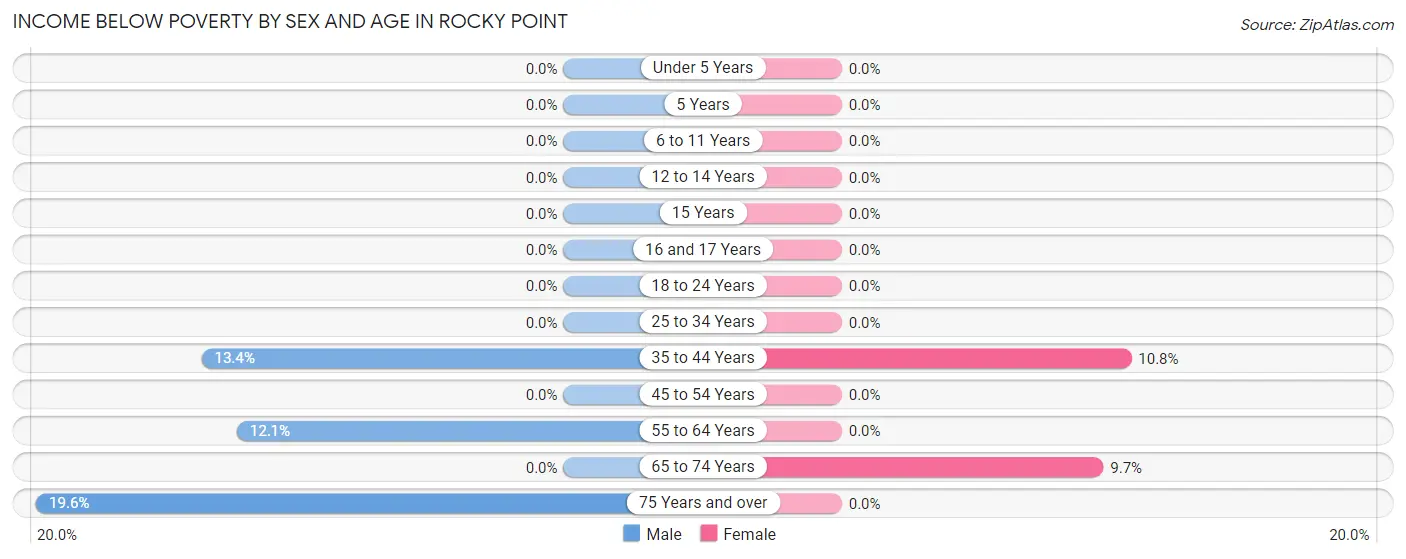
| Age Bracket | Male | Female |
| Under 5 Years | 0 (0.0%) | 0 (0.0%) |
| 5 Years | 0 (0.0%) | 0 (0.0%) |
| 6 to 11 Years | 0 (0.0%) | 0 (0.0%) |
| 12 to 14 Years | 0 (0.0%) | 0 (0.0%) |
| 15 Years | 0 (0.0%) | 0 (0.0%) |
| 16 and 17 Years | 0 (0.0%) | 0 (0.0%) |
| 18 to 24 Years | 0 (0.0%) | 0 (0.0%) |
| 25 to 34 Years | 0 (0.0%) | 0 (0.0%) |
| 35 to 44 Years | 9 (13.4%) | 10 (10.7%) |
| 45 to 54 Years | 0 (0.0%) | 0 (0.0%) |
| 55 to 64 Years | 16 (12.1%) | 0 (0.0%) |
| 65 to 74 Years | 0 (0.0%) | 10 (9.7%) |
| 75 Years and over | 9 (19.6%) | 0 (0.0%) |
| Total | 34 (4.0%) | 20 (2.8%) |
Income Above Poverty by Sex and Age in Rocky Point
According to the poverty statistics in Rocky Point, males aged under 5 years and females aged 5 years are the age groups that are most secure financially, with 100.0% of males and 100.0% of females in these age groups living above the poverty line.
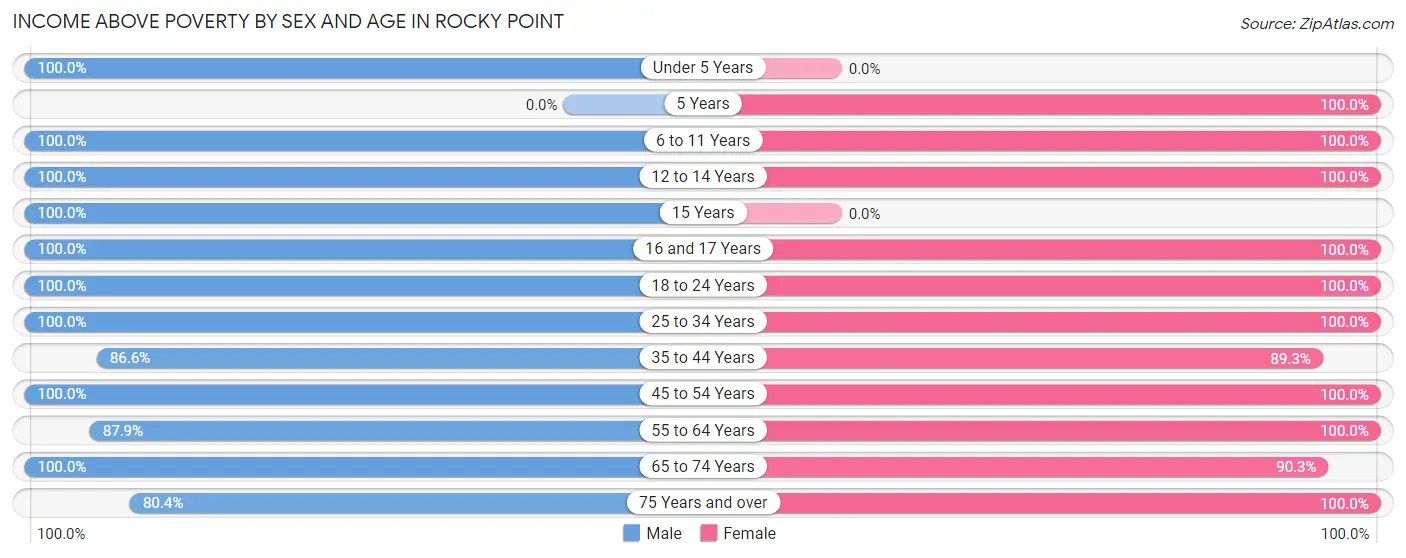
| Age Bracket | Male | Female |
| Under 5 Years | 25 (100.0%) | 0 (0.0%) |
| 5 Years | 0 (0.0%) | 37 (100.0%) |
| 6 to 11 Years | 44 (100.0%) | 51 (100.0%) |
| 12 to 14 Years | 25 (100.0%) | 18 (100.0%) |
| 15 Years | 7 (100.0%) | 0 (0.0%) |
| 16 and 17 Years | 26 (100.0%) | 10 (100.0%) |
| 18 to 24 Years | 48 (100.0%) | 39 (100.0%) |
| 25 to 34 Years | 195 (100.0%) | 90 (100.0%) |
| 35 to 44 Years | 58 (86.6%) | 83 (89.2%) |
| 45 to 54 Years | 134 (100.0%) | 143 (100.0%) |
| 55 to 64 Years | 116 (87.9%) | 90 (100.0%) |
| 65 to 74 Years | 94 (100.0%) | 93 (90.3%) |
| 75 Years and over | 37 (80.4%) | 29 (100.0%) |
| Total | 809 (96.0%) | 683 (97.2%) |
Income Below Poverty Among Married-Couple Families in Rocky Point
The poverty statistics for married-couple families in Rocky Point show that 3.3% or 10 of the total 304 families live below the poverty line. Families with no children have the highest poverty rate of 5.9%, comprising of 10 families. On the other hand, families with 1 or 2 children have the lowest poverty rate of 0.0%, which includes 0 families.
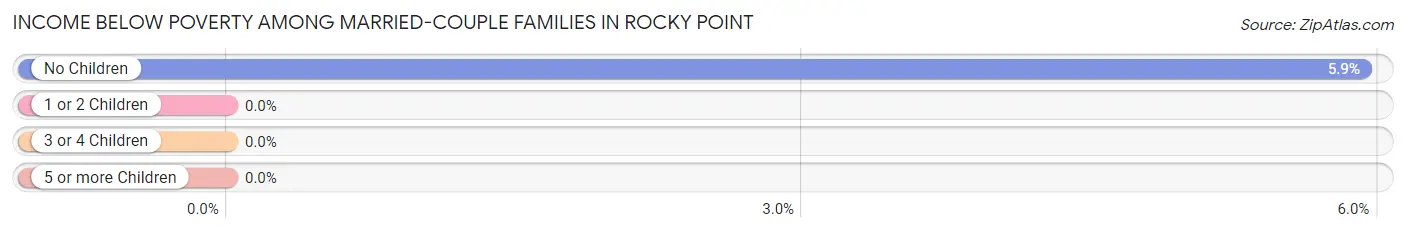
| Children | Above Poverty | Below Poverty |
| No Children | 159 (94.1%) | 10 (5.9%) |
| 1 or 2 Children | 114 (100.0%) | 0 (0.0%) |
| 3 or 4 Children | 21 (100.0%) | 0 (0.0%) |
| 5 or more Children | 0 (0.0%) | 0 (0.0%) |
| Total | 294 (96.7%) | 10 (3.3%) |
Income Below Poverty Among Single-Parent Households in Rocky Point
| Children | Single Father | Single Mother |
| No Children | 0 (0.0%) | 0 (0.0%) |
| 1 or 2 Children | 0 (0.0%) | 0 (0.0%) |
| 3 or 4 Children | 0 (0.0%) | 0 (0.0%) |
| 5 or more Children | 0 (0.0%) | 0 (0.0%) |
| Total | 0 (0.0%) | 0 (0.0%) |
Income Below Poverty Among Married-Couple vs Single-Parent Households in Rocky Point
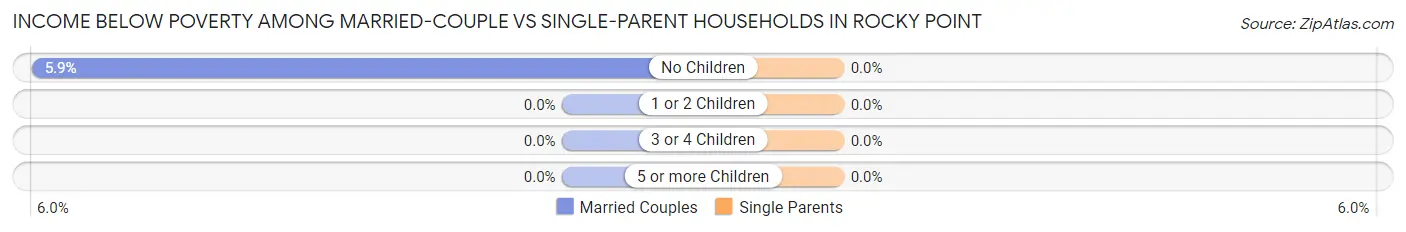
| Children | Married-Couple Families | Single-Parent Households |
| No Children | 10 (5.9%) | 0 (0.0%) |
| 1 or 2 Children | 0 (0.0%) | 0 (0.0%) |
| 3 or 4 Children | 0 (0.0%) | 0 (0.0%) |
| 5 or more Children | 0 (0.0%) | 0 (0.0%) |
| Total | 10 (3.3%) | 0 (0.0%) |
Race in Rocky Point
The most populous races in Rocky Point are White / Caucasian (1,034 | 66.9%), Two or more Races (268 | 17.3%), and Hispanic or Latino (236 | 15.3%).
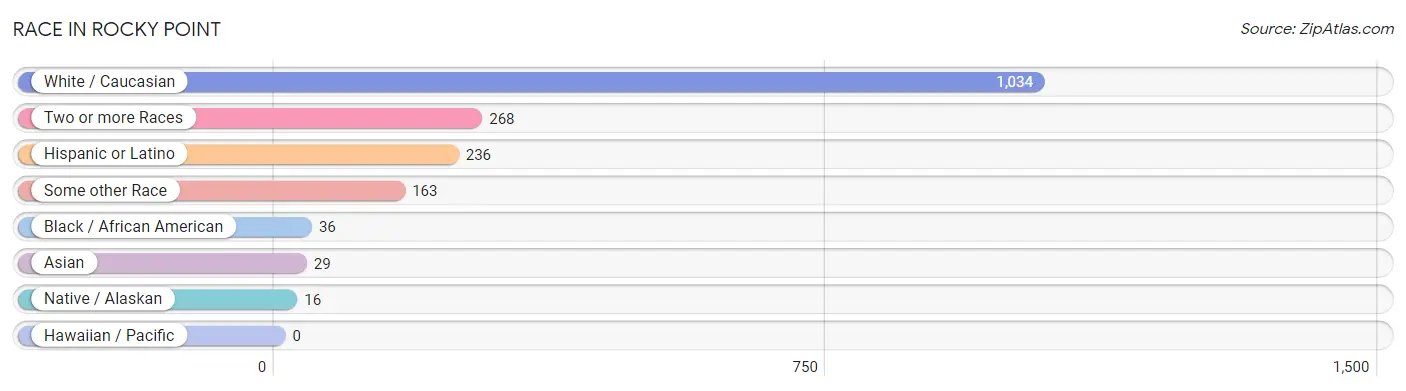
| Race | # Population | % Population |
| Asian | 29 | 1.9% |
| Black / African American | 36 | 2.3% |
| Hawaiian / Pacific | 0 | 0.0% |
| Hispanic or Latino | 236 | 15.3% |
| Native / Alaskan | 16 | 1.0% |
| White / Caucasian | 1,034 | 66.9% |
| Two or more Races | 268 | 17.3% |
| Some other Race | 163 | 10.5% |
| Total | 1,546 | 100.0% |
Ancestry in Rocky Point
The most populous ancestries reported in Rocky Point are German (342 | 22.1%), Mexican (226 | 14.6%), English (159 | 10.3%), European (153 | 9.9%), and Norwegian (130 | 8.4%), together accounting for 65.3% of all Rocky Point residents.
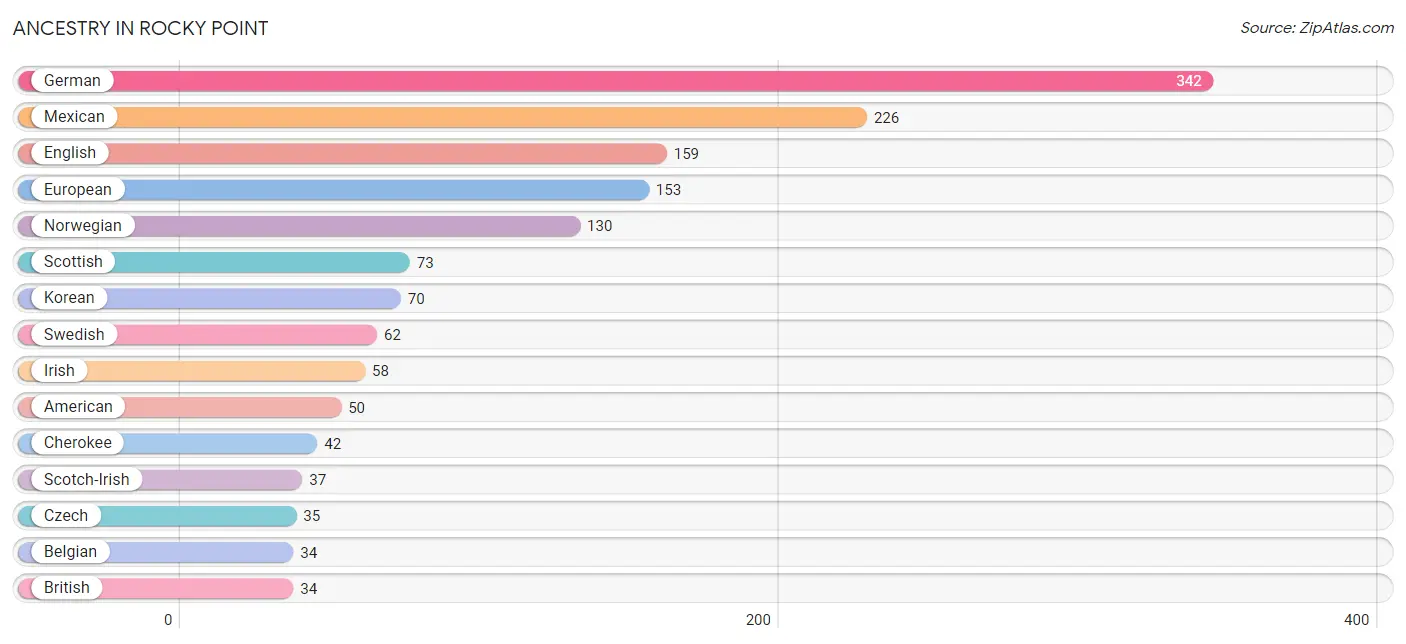
| Ancestry | # Population | % Population |
| American | 50 | 3.2% |
| Belgian | 34 | 2.2% |
| Bhutanese | 16 | 1.0% |
| Brazilian | 23 | 1.5% |
| British | 34 | 2.2% |
| Canadian | 10 | 0.6% |
| Cherokee | 42 | 2.7% |
| Czech | 35 | 2.3% |
| Danish | 11 | 0.7% |
| Dutch | 9 | 0.6% |
| English | 159 | 10.3% |
| European | 153 | 9.9% |
| Finnish | 10 | 0.6% |
| French | 23 | 1.5% |
| French Canadian | 23 | 1.5% |
| German | 342 | 22.1% |
| Greek | 8 | 0.5% |
| Indian (Asian) | 10 | 0.6% |
| Irish | 58 | 3.7% |
| Italian | 14 | 0.9% |
| Korean | 70 | 4.5% |
| Malaysian | 20 | 1.3% |
| Mexican | 226 | 14.6% |
| Norwegian | 130 | 8.4% |
| Pakistani | 20 | 1.3% |
| Polish | 9 | 0.6% |
| Portuguese | 23 | 1.5% |
| Russian | 24 | 1.5% |
| Scandinavian | 13 | 0.8% |
| Scotch-Irish | 37 | 2.4% |
| Scottish | 73 | 4.7% |
| Spaniard | 10 | 0.6% |
| Sri Lankan | 20 | 1.3% |
| Swedish | 62 | 4.0% |
| Swiss | 16 | 1.0% |
| Ukrainian | 10 | 0.6% | View All 36 Rows |
Immigrants in Rocky Point
The most numerous immigrant groups reported in Rocky Point came from Latin America (109 | 7.0%), Central America (86 | 5.6%), Mexico (86 | 5.6%), Brazil (23 | 1.5%), and South America (23 | 1.5%), together accounting for 21.1% of all Rocky Point residents.
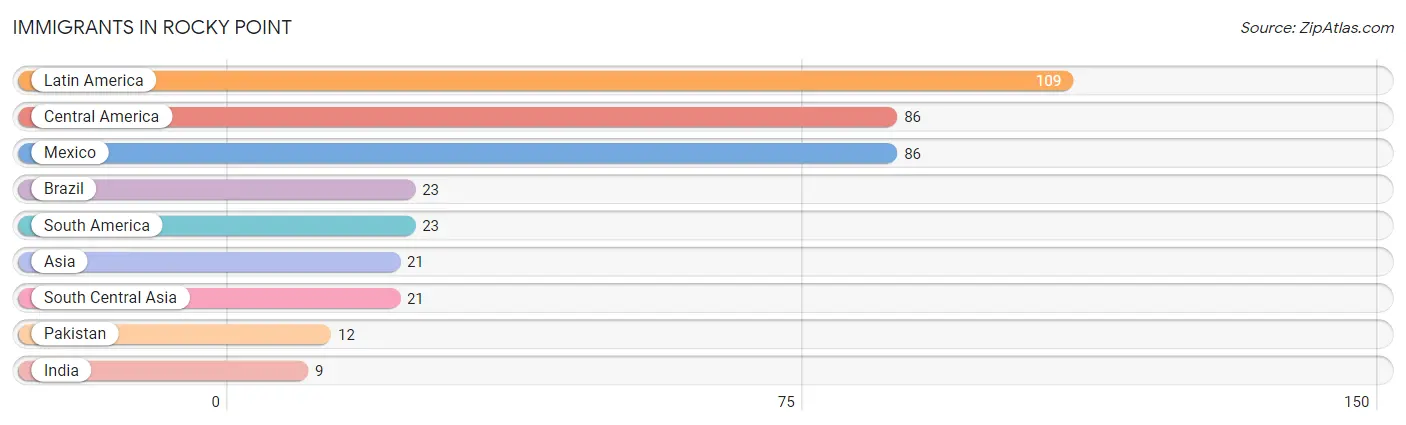
| Immigration Origin | # Population | % Population |
| Asia | 21 | 1.4% |
| Brazil | 23 | 1.5% |
| Central America | 86 | 5.6% |
| India | 9 | 0.6% |
| Latin America | 109 | 7.0% |
| Mexico | 86 | 5.6% |
| Pakistan | 12 | 0.8% |
| South America | 23 | 1.5% |
| South Central Asia | 21 | 1.4% | View All 9 Rows |
Sex and Age in Rocky Point
Sex and Age in Rocky Point
The most populous age groups in Rocky Point are 30 to 34 Years (108 | 12.8%) for men and 50 to 54 Years (86 | 12.2%) for women.
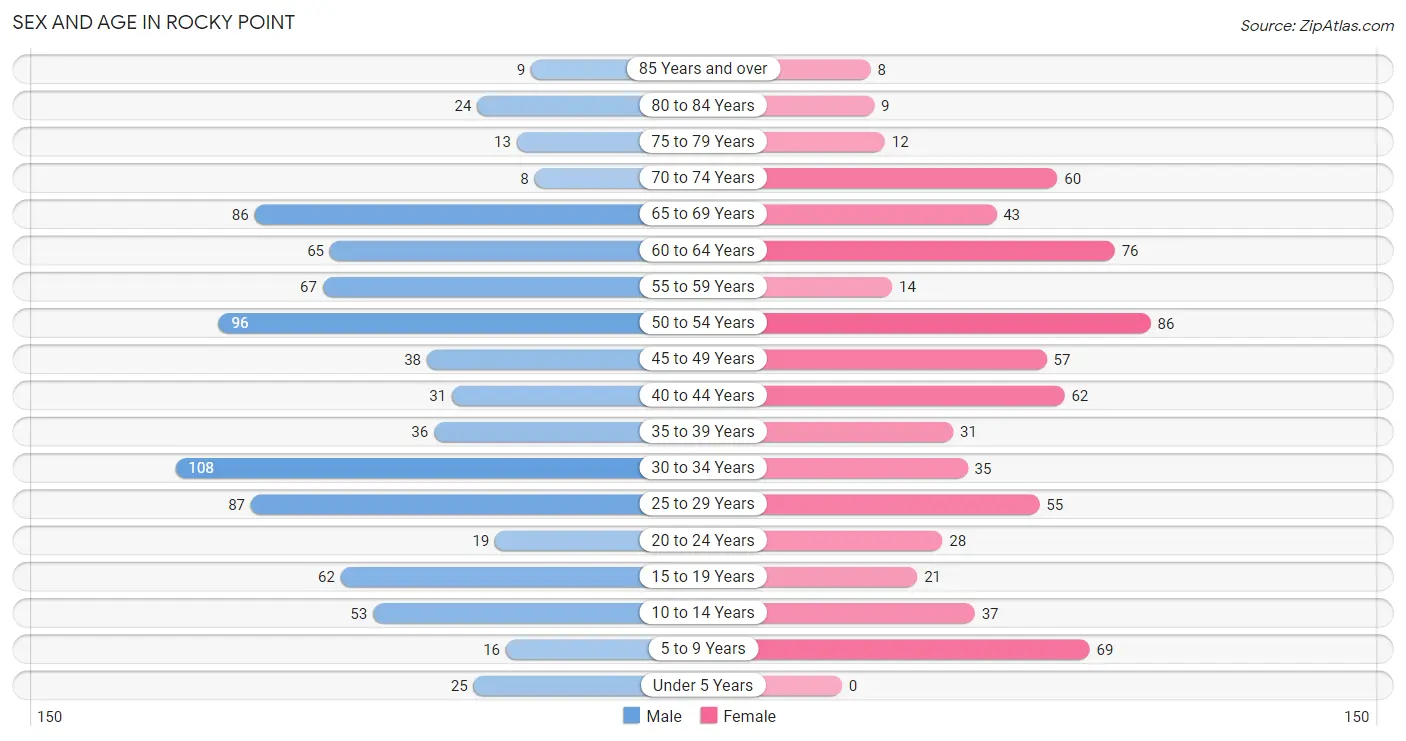
| Age Bracket | Male | Female |
| Under 5 Years | 25 (3.0%) | 0 (0.0%) |
| 5 to 9 Years | 16 (1.9%) | 69 (9.8%) |
| 10 to 14 Years | 53 (6.3%) | 37 (5.3%) |
| 15 to 19 Years | 62 (7.3%) | 21 (3.0%) |
| 20 to 24 Years | 19 (2.2%) | 28 (4.0%) |
| 25 to 29 Years | 87 (10.3%) | 55 (7.8%) |
| 30 to 34 Years | 108 (12.8%) | 35 (5.0%) |
| 35 to 39 Years | 36 (4.3%) | 31 (4.4%) |
| 40 to 44 Years | 31 (3.7%) | 62 (8.8%) |
| 45 to 49 Years | 38 (4.5%) | 57 (8.1%) |
| 50 to 54 Years | 96 (11.4%) | 86 (12.2%) |
| 55 to 59 Years | 67 (8.0%) | 14 (2.0%) |
| 60 to 64 Years | 65 (7.7%) | 76 (10.8%) |
| 65 to 69 Years | 86 (10.2%) | 43 (6.1%) |
| 70 to 74 Years | 8 (0.9%) | 60 (8.5%) |
| 75 to 79 Years | 13 (1.5%) | 12 (1.7%) |
| 80 to 84 Years | 24 (2.9%) | 9 (1.3%) |
| 85 Years and over | 9 (1.1%) | 8 (1.1%) |
| Total | 843 (100.0%) | 703 (100.0%) |
Families and Households in Rocky Point
Median Family Size in Rocky Point
The median family size in Rocky Point is 2.68 persons per family, with single female/mother families (36 | 8.3%) accounting for the largest median family size of 3.06 persons per family. On the other hand, single male/father families (95 | 21.8%) represent the smallest median family size with 2.27 persons per family.
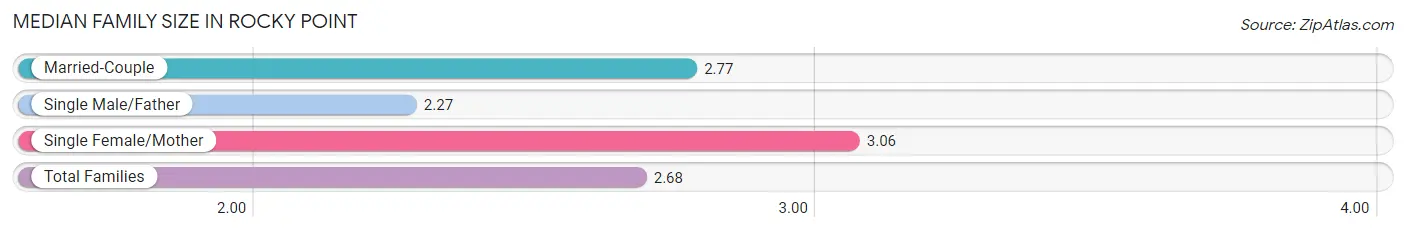
| Family Type | # Families | Family Size |
| Married-Couple | 304 (69.9%) | 2.77 |
| Single Male/Father | 95 (21.8%) | 2.27 |
| Single Female/Mother | 36 (8.3%) | 3.06 |
| Total Families | 435 (100.0%) | 2.68 |
Median Household Size in Rocky Point
The median household size in Rocky Point is 2.26 persons per household, with single female/mother households (36 | 5.3%) accounting for the largest median household size of 3.06 persons per household. non-family households (250 | 36.5%) represent the smallest median household size with 1.35 persons per household.
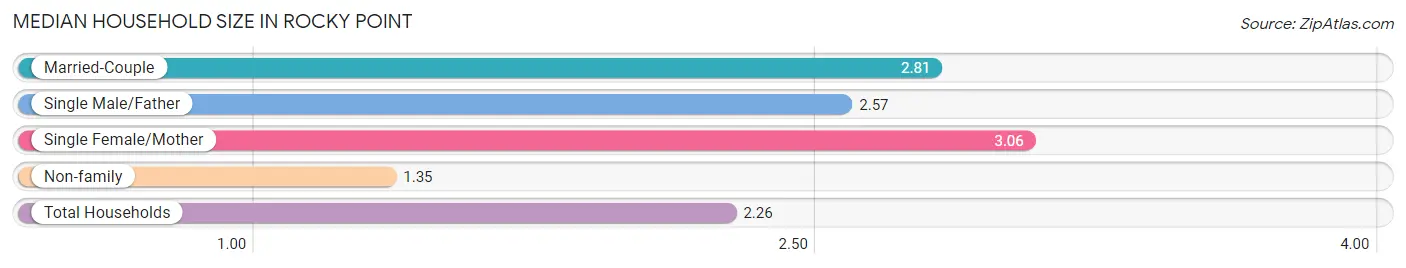
| Household Type | # Households | Household Size |
| Married-Couple | 304 (44.4%) | 2.81 |
| Single Male/Father | 95 (13.9%) | 2.57 |
| Single Female/Mother | 36 (5.3%) | 3.06 |
| Non-family | 250 (36.5%) | 1.35 |
| Total Households | 685 (100.0%) | 2.26 |
Household Size by Marriage Status in Rocky Point
Out of a total of 685 households in Rocky Point, 435 (63.5%) are family households, while 250 (36.5%) are nonfamily households. The most numerous type of family households are 2-person households, comprising 214, and the most common type of nonfamily households are 1-person households, comprising 165.
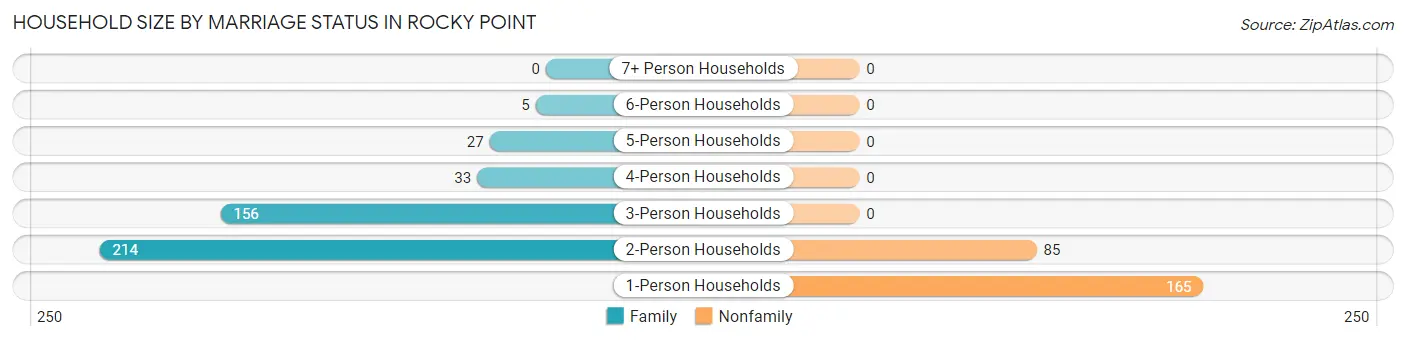
| Household Size | Family Households | Nonfamily Households |
| 1-Person Households | - | 165 (24.1%) |
| 2-Person Households | 214 (31.2%) | 85 (12.4%) |
| 3-Person Households | 156 (22.8%) | 0 (0.0%) |
| 4-Person Households | 33 (4.8%) | 0 (0.0%) |
| 5-Person Households | 27 (3.9%) | 0 (0.0%) |
| 6-Person Households | 5 (0.7%) | 0 (0.0%) |
| 7+ Person Households | 0 (0.0%) | 0 (0.0%) |
| Total | 435 (63.5%) | 250 (36.5%) |
Female Fertility in Rocky Point
Fertility by Age in Rocky Point
| Age Bracket | Women with Births | Births / 1,000 Women |
| 15 to 19 years | 0 (0.0%) | 0.0 |
| 20 to 34 years | 0 (0.0%) | 0.0 |
| 35 to 50 years | 0 (0.0%) | 0.0 |
| Total | 0 (0.0%) | 0.0 |
Fertility by Age by Marriage Status in Rocky Point
| Age Bracket | Married | Unmarried |
| 15 to 19 years | 0 (0.0%) | 0 (0.0%) |
| 20 to 34 years | 0 (0.0%) | 0 (0.0%) |
| 35 to 50 years | 0 (0.0%) | 0 (0.0%) |
| Total | 0 (0.0%) | 0 (0.0%) |
Fertility by Education in Rocky Point
| Educational Attainment | Women with Births | Births / 1,000 Women |
| Less than High School | 0 (0.0%) | 0.0 |
| High School Diploma | 0 (0.0%) | 0.0 |
| College or Associate's Degree | 0 (0.0%) | 0.0 |
| Bachelor's Degree | 0 (0.0%) | 0.0 |
| Graduate Degree | 0 (0.0%) | 0.0 |
| Total | 0 (0.0%) | 0.0 |
Fertility by Education by Marriage Status in Rocky Point
| Educational Attainment | Married | Unmarried |
| Less than High School | 0 (0.0%) | 0 (0.0%) |
| High School Diploma | 0 (0.0%) | 0 (0.0%) |
| College or Associate's Degree | 0 (0.0%) | 0 (0.0%) |
| Bachelor's Degree | 0 (0.0%) | 0 (0.0%) |
| Graduate Degree | 0 (0.0%) | 0 (0.0%) |
| Total | 0 (0.0%) | 0 (0.0%) |
Employment Characteristics in Rocky Point
Employment by Class of Employer in Rocky Point
Among the 776 employed individuals in Rocky Point, private company employees (485 | 62.5%), federal government employees (113 | 14.6%), and self-employed (not incorporated) (111 | 14.3%) make up the most common classes of employment.
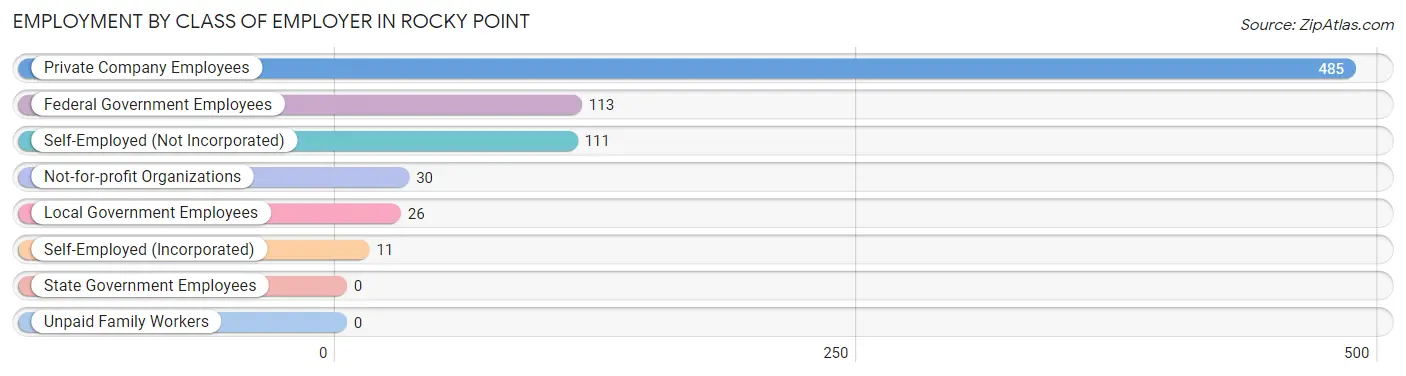
| Employer Class | # Employees | % Employees |
| Private Company Employees | 485 | 62.5% |
| Self-Employed (Incorporated) | 11 | 1.4% |
| Self-Employed (Not Incorporated) | 111 | 14.3% |
| Not-for-profit Organizations | 30 | 3.9% |
| Local Government Employees | 26 | 3.4% |
| State Government Employees | 0 | 0.0% |
| Federal Government Employees | 113 | 14.6% |
| Unpaid Family Workers | 0 | 0.0% |
| Total | 776 | 100.0% |
Employment Status by Age in Rocky Point
According to the labor force statistics for Rocky Point, out of the total population over 16 years of age (1,339), 67.1% or 898 individuals are in the labor force, with 6.8% or 61 of them unemployed. The age group with the highest labor force participation rate is 20 to 24 years, with 100.0% or 47 individuals in the labor force. Within the labor force, the 16 to 19 years age range has the highest percentage of unemployed individuals, with 41.7% or 15 of them being unemployed.
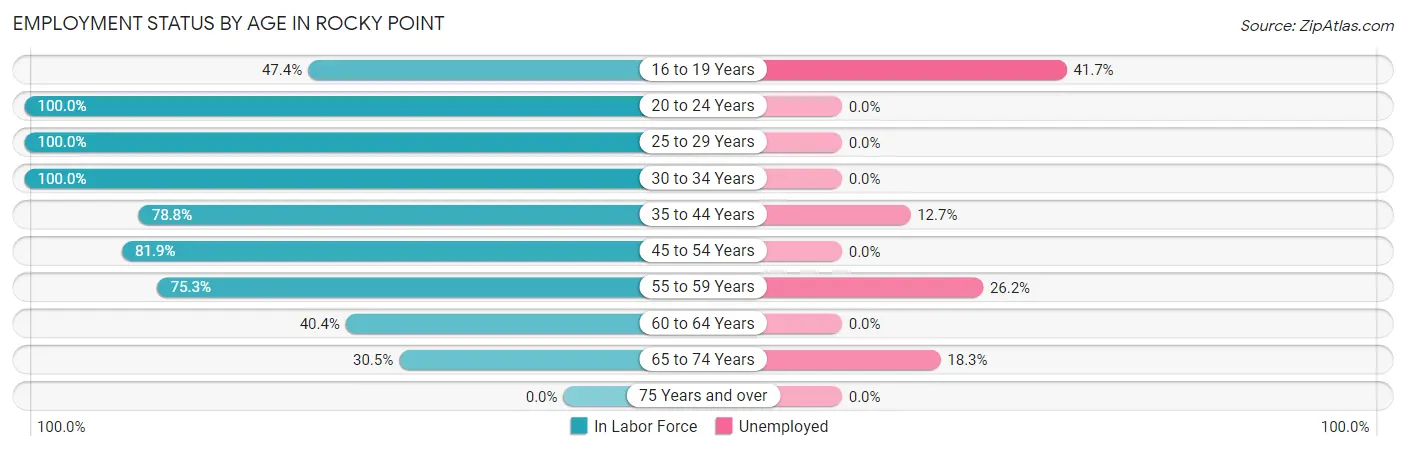
| Age Bracket | In Labor Force | Unemployed |
| 16 to 19 Years | 36 (47.4%) | 15 (41.7%) |
| 20 to 24 Years | 47 (100.0%) | 0 (0.0%) |
| 25 to 29 Years | 142 (100.0%) | 0 (0.0%) |
| 30 to 34 Years | 143 (100.0%) | 0 (0.0%) |
| 35 to 44 Years | 126 (78.8%) | 16 (12.7%) |
| 45 to 54 Years | 227 (81.9%) | 0 (0.0%) |
| 55 to 59 Years | 61 (75.3%) | 16 (26.2%) |
| 60 to 64 Years | 57 (40.4%) | 0 (0.0%) |
| 65 to 74 Years | 60 (30.5%) | 11 (18.3%) |
| 75 Years and over | 0 (0.0%) | 0 (0.0%) |
| Total | 898 (67.1%) | 61 (6.8%) |
Employment Status by Educational Attainment in Rocky Point
According to labor force statistics for Rocky Point, 80.1% of individuals (756) out of the total population between 25 and 64 years of age (944) are in the labor force, with 4.4% or 33 of them being unemployed. The group with the highest labor force participation rate are those with the educational attainment of less than high school, with 100.0% or 128 individuals in the labor force. Within the labor force, individuals with less than high school education have the highest percentage of unemployment, with 12.5% or 16 of them being unemployed.
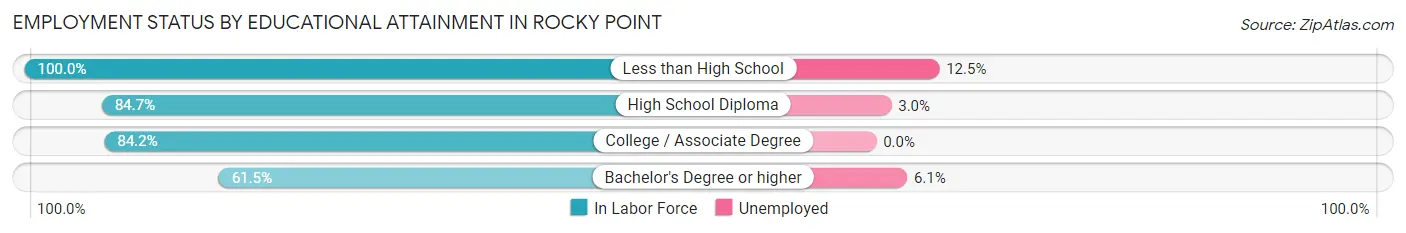
| Educational Attainment | In Labor Force | Unemployed |
| Less than High School | 128 (100.0%) | 16 (12.5%) |
| High School Diploma | 199 (84.7%) | 7 (3.0%) |
| College / Associate Degree | 266 (84.2%) | 0 (0.0%) |
| Bachelor's Degree or higher | 163 (61.5%) | 16 (6.1%) |
| Total | 756 (80.1%) | 42 (4.4%) |
Employment Occupations by Sex in Rocky Point
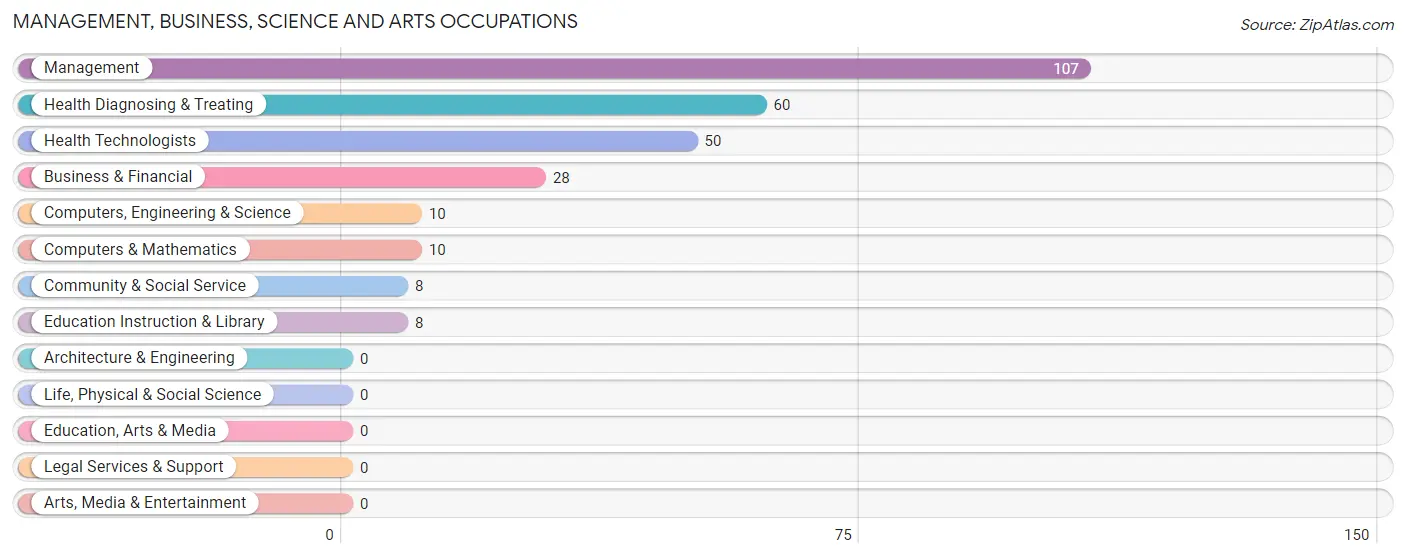
Management, Business, Science and Arts Occupations
The most common Management, Business, Science and Arts occupations in Rocky Point are Management (107 | 13.4%), Health Diagnosing & Treating (60 | 7.5%), Health Technologists (50 | 6.3%), Business & Financial (28 | 3.5%), and Computers, Engineering & Science (10 | 1.3%).
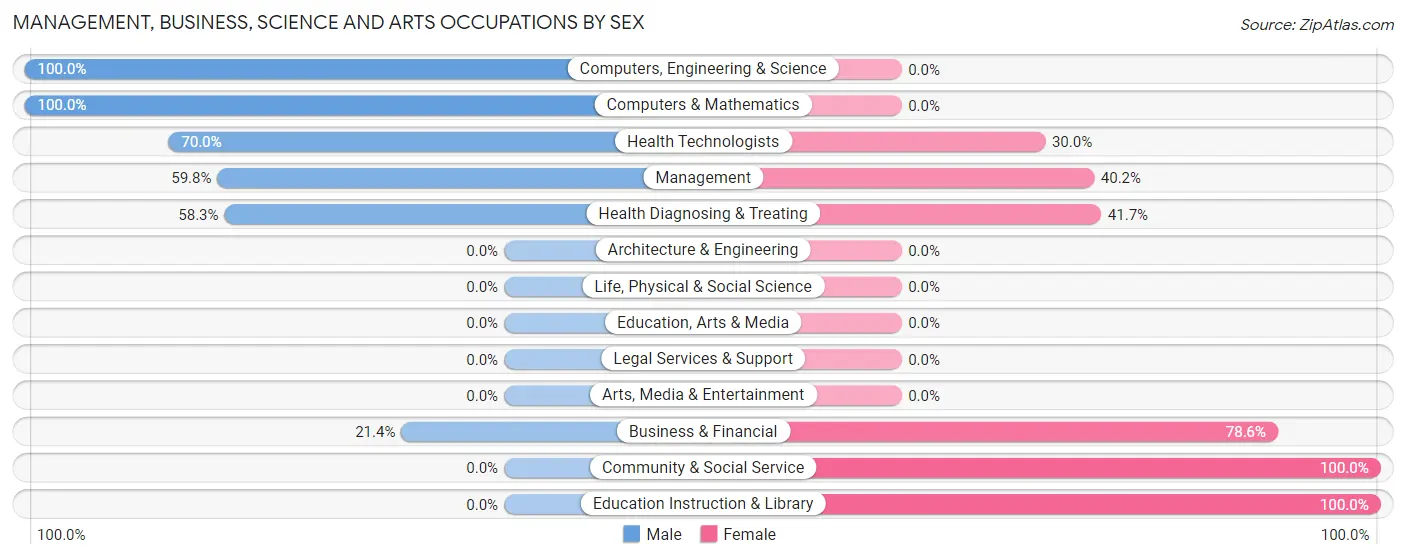
Management, Business, Science and Arts Occupations by Sex
Within the Management, Business, Science and Arts occupations in Rocky Point, the most male-oriented occupations are Computers, Engineering & Science (100.0%), Computers & Mathematics (100.0%), and Health Technologists (70.0%), while the most female-oriented occupations are Community & Social Service (100.0%), Education Instruction & Library (100.0%), and Business & Financial (78.6%).
| Occupation | Male | Female |
| Management | 64 (59.8%) | 43 (40.2%) |
| Business & Financial | 6 (21.4%) | 22 (78.6%) |
| Computers, Engineering & Science | 10 (100.0%) | 0 (0.0%) |
| Computers & Mathematics | 10 (100.0%) | 0 (0.0%) |
| Architecture & Engineering | 0 (0.0%) | 0 (0.0%) |
| Life, Physical & Social Science | 0 (0.0%) | 0 (0.0%) |
| Community & Social Service | 0 (0.0%) | 8 (100.0%) |
| Education, Arts & Media | 0 (0.0%) | 0 (0.0%) |
| Legal Services & Support | 0 (0.0%) | 0 (0.0%) |
| Education Instruction & Library | 0 (0.0%) | 8 (100.0%) |
| Arts, Media & Entertainment | 0 (0.0%) | 0 (0.0%) |
| Health Diagnosing & Treating | 35 (58.3%) | 25 (41.7%) |
| Health Technologists | 35 (70.0%) | 15 (30.0%) |
| Total (Category) | 115 (54.0%) | 98 (46.0%) |
| Total (Overall) | 440 (55.1%) | 358 (44.9%) |
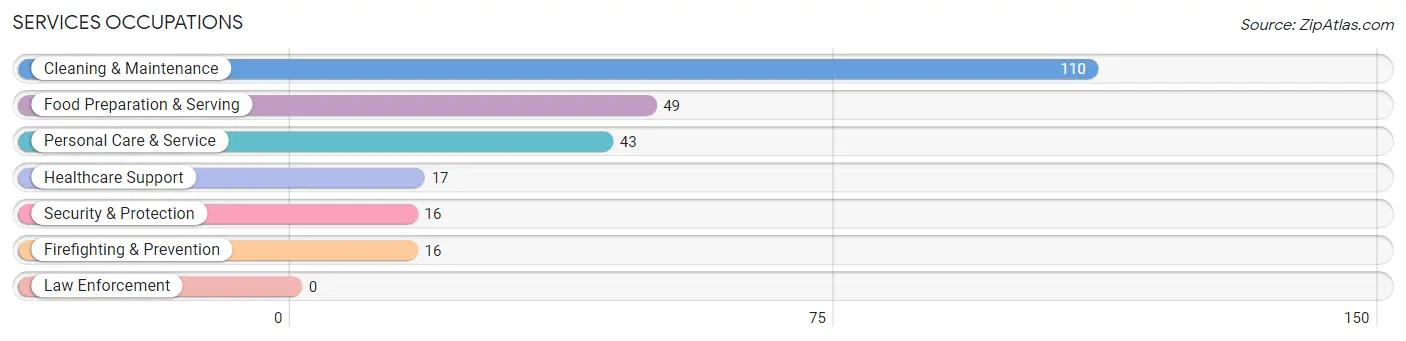
Services Occupations
The most common Services occupations in Rocky Point are Cleaning & Maintenance (110 | 13.8%), Food Preparation & Serving (49 | 6.1%), Personal Care & Service (43 | 5.4%), Healthcare Support (17 | 2.1%), and Security & Protection (16 | 2.0%).
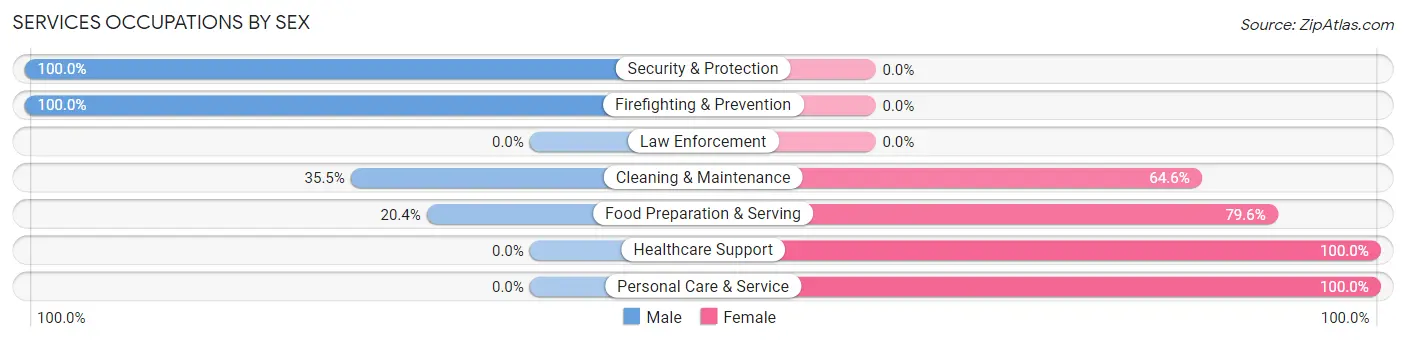
Services Occupations by Sex
Within the Services occupations in Rocky Point, the most male-oriented occupations are Security & Protection (100.0%), Firefighting & Prevention (100.0%), and Cleaning & Maintenance (35.4%), while the most female-oriented occupations are Healthcare Support (100.0%), Personal Care & Service (100.0%), and Food Preparation & Serving (79.6%).
| Occupation | Male | Female |
| Healthcare Support | 0 (0.0%) | 17 (100.0%) |
| Security & Protection | 16 (100.0%) | 0 (0.0%) |
| Firefighting & Prevention | 16 (100.0%) | 0 (0.0%) |
| Law Enforcement | 0 (0.0%) | 0 (0.0%) |
| Food Preparation & Serving | 10 (20.4%) | 39 (79.6%) |
| Cleaning & Maintenance | 39 (35.4%) | 71 (64.5%) |
| Personal Care & Service | 0 (0.0%) | 43 (100.0%) |
| Total (Category) | 65 (27.7%) | 170 (72.3%) |
| Total (Overall) | 440 (55.1%) | 358 (44.9%) |
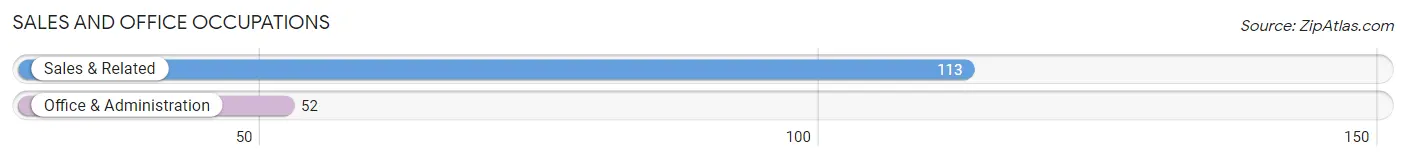
Sales and Office Occupations
The most common Sales and Office occupations in Rocky Point are Sales & Related (113 | 14.2%), and Office & Administration (52 | 6.5%).
Sales and Office Occupations by Sex
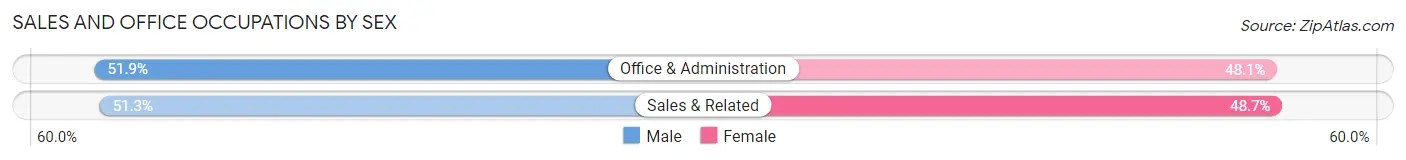
| Occupation | Male | Female |
| Sales & Related | 58 (51.3%) | 55 (48.7%) |
| Office & Administration | 27 (51.9%) | 25 (48.1%) |
| Total (Category) | 85 (51.5%) | 80 (48.5%) |
| Total (Overall) | 440 (55.1%) | 358 (44.9%) |
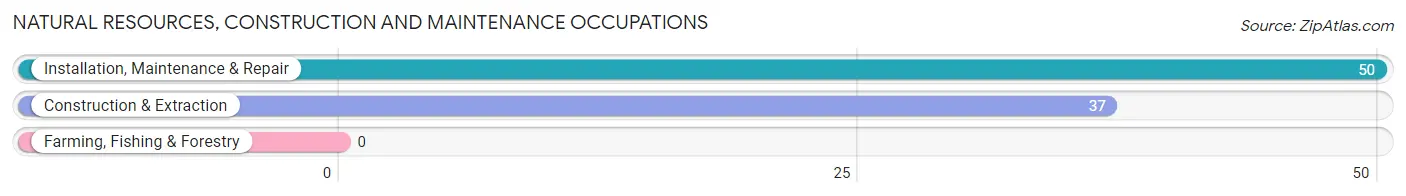
Natural Resources, Construction and Maintenance Occupations
The most common Natural Resources, Construction and Maintenance occupations in Rocky Point are Installation, Maintenance & Repair (50 | 6.3%), and Construction & Extraction (37 | 4.6%).
Natural Resources, Construction and Maintenance Occupations by Sex
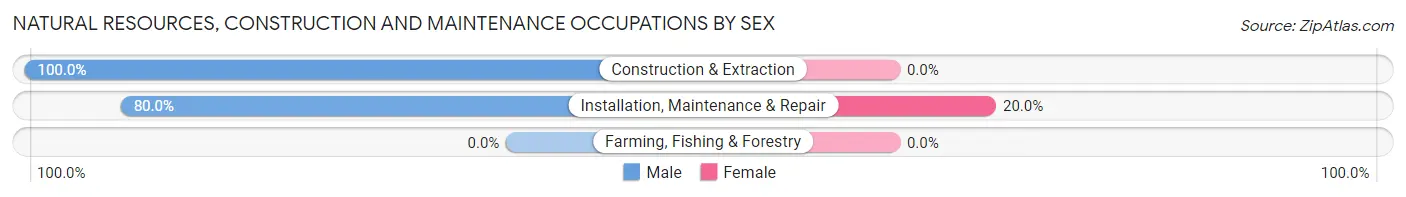
| Occupation | Male | Female |
| Farming, Fishing & Forestry | 0 (0.0%) | 0 (0.0%) |
| Construction & Extraction | 37 (100.0%) | 0 (0.0%) |
| Installation, Maintenance & Repair | 40 (80.0%) | 10 (20.0%) |
| Total (Category) | 77 (88.5%) | 10 (11.5%) |
| Total (Overall) | 440 (55.1%) | 358 (44.9%) |
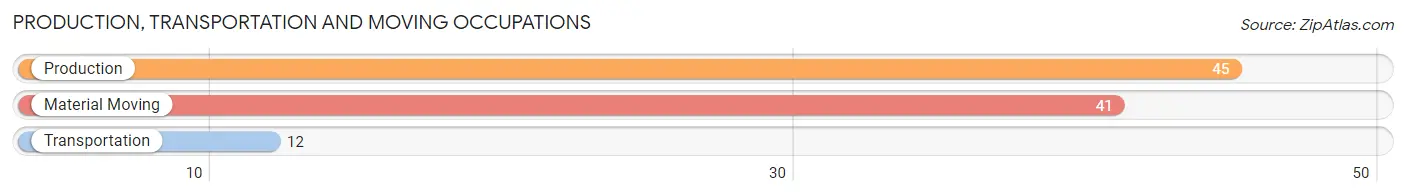
Production, Transportation and Moving Occupations
The most common Production, Transportation and Moving occupations in Rocky Point are Production (45 | 5.6%), Material Moving (41 | 5.1%), and Transportation (12 | 1.5%).
Production, Transportation and Moving Occupations by Sex
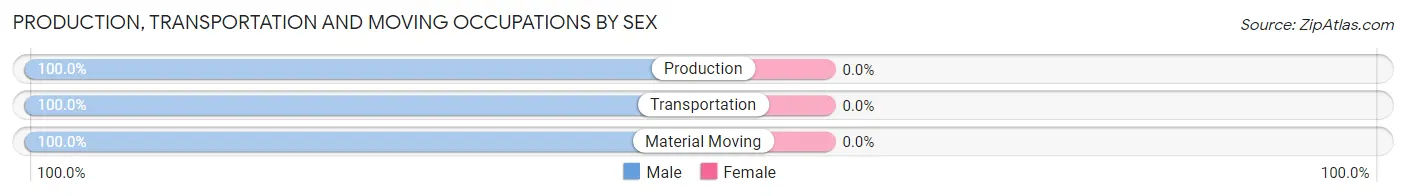
| Occupation | Male | Female |
| Production | 45 (100.0%) | 0 (0.0%) |
| Transportation | 12 (100.0%) | 0 (0.0%) |
| Material Moving | 41 (100.0%) | 0 (0.0%) |
| Total (Category) | 98 (100.0%) | 0 (0.0%) |
| Total (Overall) | 440 (55.1%) | 358 (44.9%) |
Employment Industries by Sex in Rocky Point
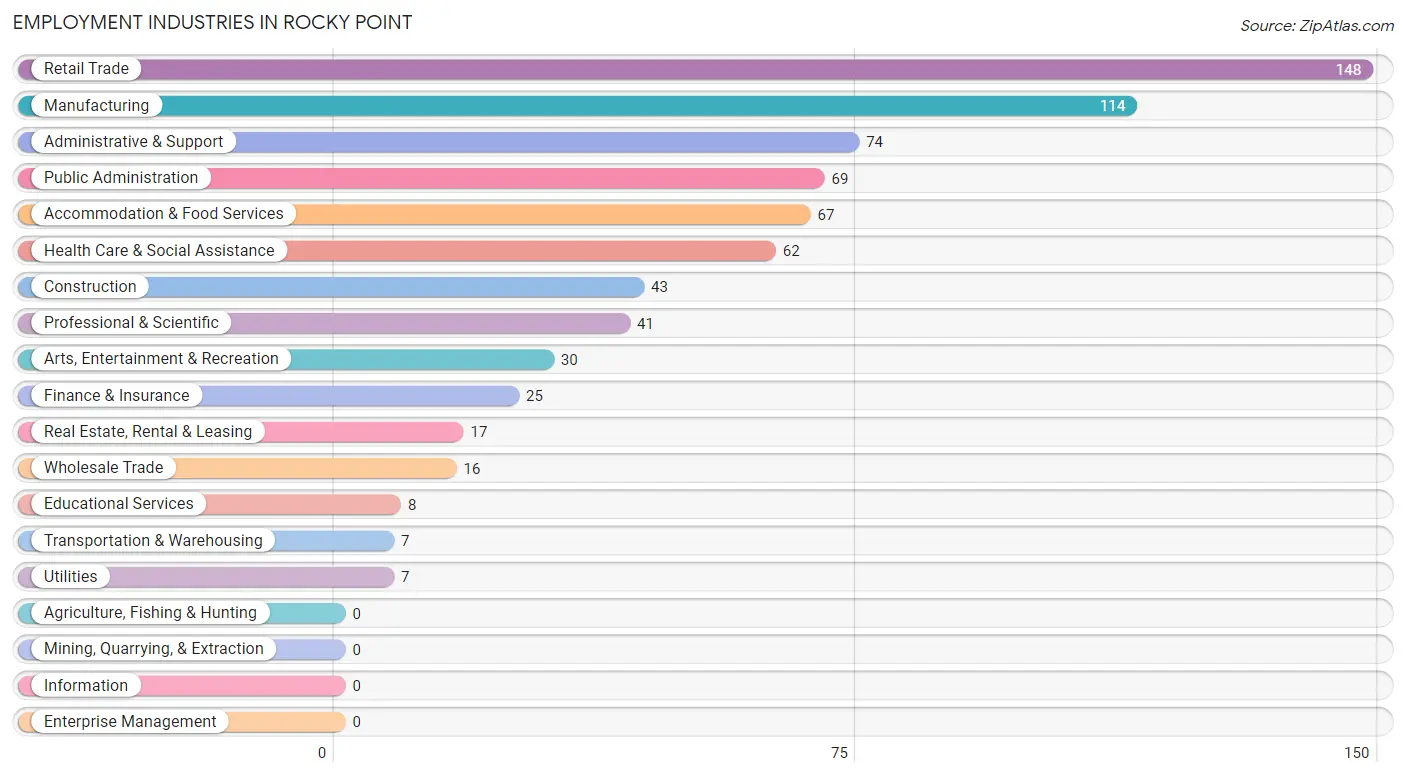
Employment Industries in Rocky Point
The major employment industries in Rocky Point include Retail Trade (148 | 18.5%), Manufacturing (114 | 14.3%), Administrative & Support (74 | 9.3%), Public Administration (69 | 8.6%), and Accommodation & Food Services (67 | 8.4%).
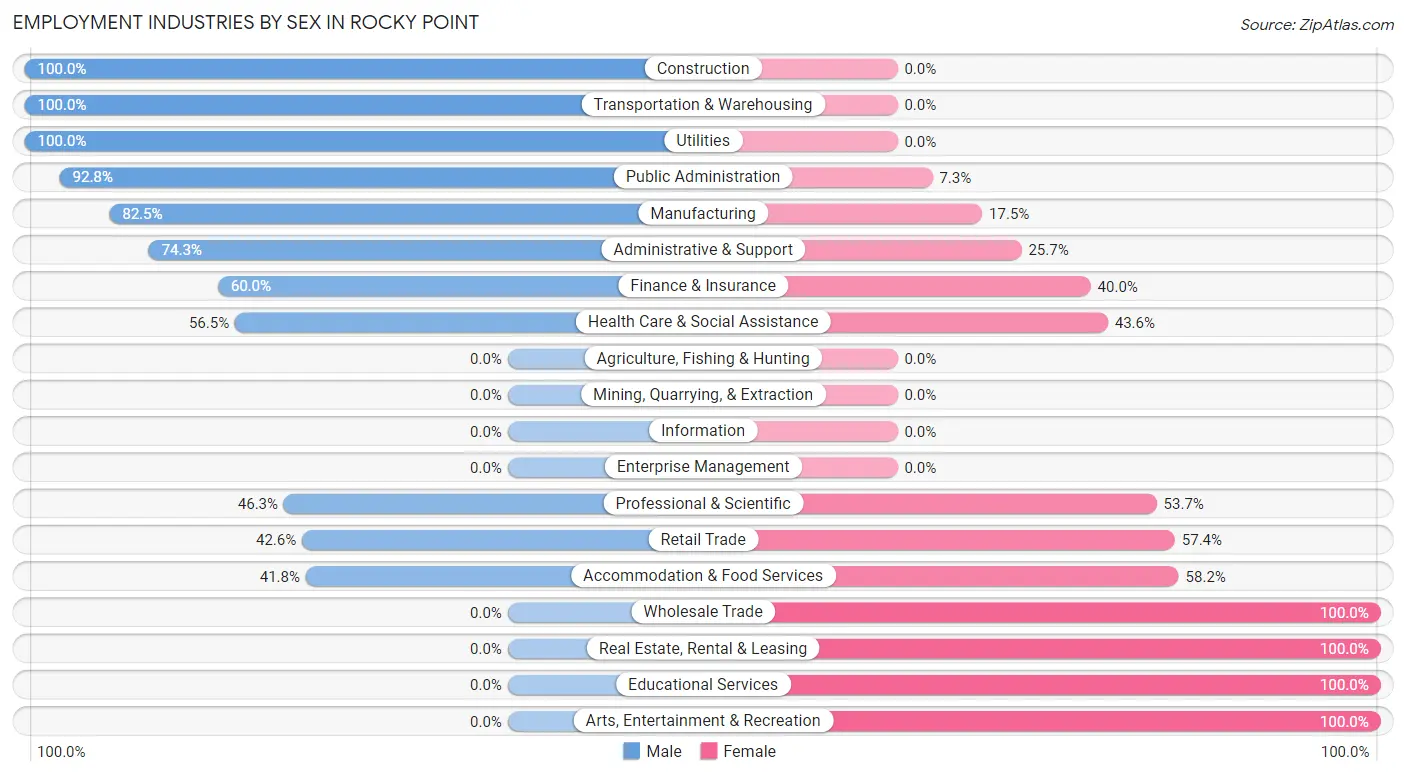
Employment Industries by Sex in Rocky Point
The Rocky Point industries that see more men than women are Construction (100.0%), Transportation & Warehousing (100.0%), and Utilities (100.0%), whereas the industries that tend to have a higher number of women are Wholesale Trade (100.0%), Real Estate, Rental & Leasing (100.0%), and Educational Services (100.0%).
| Industry | Male | Female |
| Agriculture, Fishing & Hunting | 0 (0.0%) | 0 (0.0%) |
| Mining, Quarrying, & Extraction | 0 (0.0%) | 0 (0.0%) |
| Construction | 43 (100.0%) | 0 (0.0%) |
| Manufacturing | 94 (82.5%) | 20 (17.5%) |
| Wholesale Trade | 0 (0.0%) | 16 (100.0%) |
| Retail Trade | 63 (42.6%) | 85 (57.4%) |
| Transportation & Warehousing | 7 (100.0%) | 0 (0.0%) |
| Utilities | 7 (100.0%) | 0 (0.0%) |
| Information | 0 (0.0%) | 0 (0.0%) |
| Finance & Insurance | 15 (60.0%) | 10 (40.0%) |
| Real Estate, Rental & Leasing | 0 (0.0%) | 17 (100.0%) |
| Professional & Scientific | 19 (46.3%) | 22 (53.7%) |
| Enterprise Management | 0 (0.0%) | 0 (0.0%) |
| Administrative & Support | 55 (74.3%) | 19 (25.7%) |
| Educational Services | 0 (0.0%) | 8 (100.0%) |
| Health Care & Social Assistance | 35 (56.5%) | 27 (43.5%) |
| Arts, Entertainment & Recreation | 0 (0.0%) | 30 (100.0%) |
| Accommodation & Food Services | 28 (41.8%) | 39 (58.2%) |
| Public Administration | 64 (92.7%) | 5 (7.2%) |
| Total | 440 (55.1%) | 358 (44.9%) |
Education in Rocky Point
School Enrollment in Rocky Point
The most common levels of schooling among the 268 students in Rocky Point are middle school (90 | 33.6%), elementary school (48 | 17.9%), and high school (43 | 16.0%).
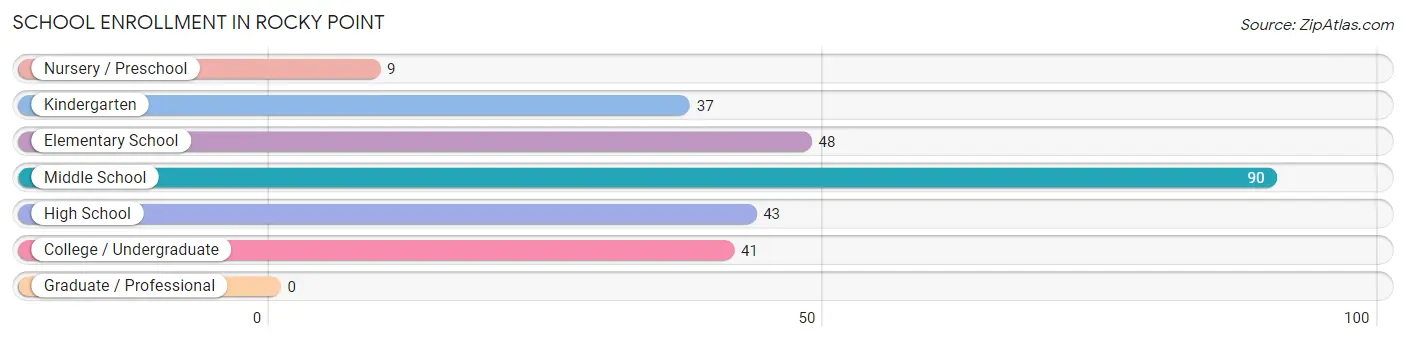
| School Level | # Students | % Students |
| Nursery / Preschool | 9 | 3.4% |
| Kindergarten | 37 | 13.8% |
| Elementary School | 48 | 17.9% |
| Middle School | 90 | 33.6% |
| High School | 43 | 16.0% |
| College / Undergraduate | 41 | 15.3% |
| Graduate / Professional | 0 | 0.0% |
| Total | 268 | 100.0% |
School Enrollment by Age by Funding Source in Rocky Point
Out of a total of 268 students who are enrolled in schools in Rocky Point, 61 (22.8%) attend a private institution, while the remaining 207 (77.2%) are enrolled in public schools. The age group of 3 to 4 year olds has the highest likelihood of being enrolled in private schools, with 9 (100.0% in the age bracket) enrolled. Conversely, the age group of 15 to 17 year olds has the lowest likelihood of being enrolled in a private school, with 43 (100.0% in the age bracket) attending a public institution.
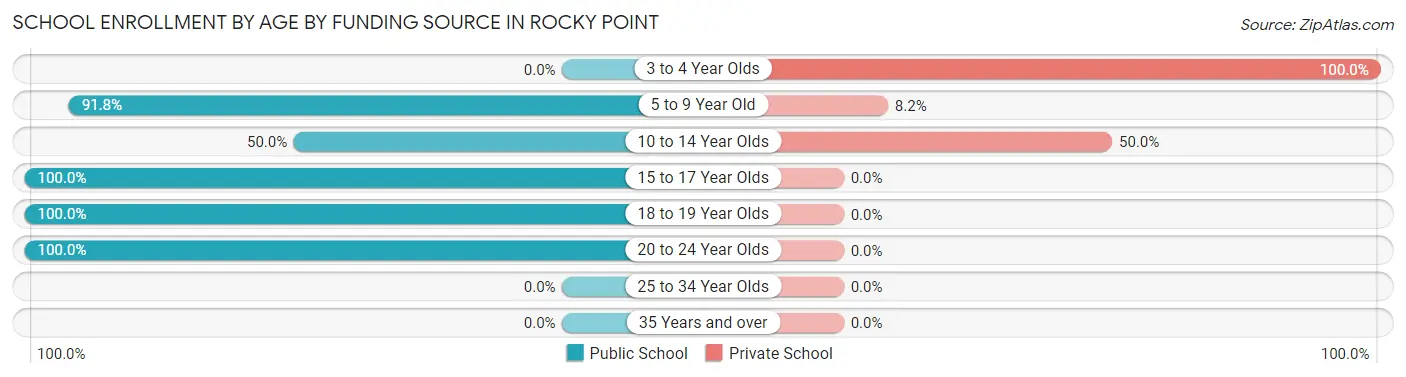
| Age Bracket | Public School | Private School |
| 3 to 4 Year Olds | 0 (0.0%) | 9 (100.0%) |
| 5 to 9 Year Old | 78 (91.8%) | 7 (8.2%) |
| 10 to 14 Year Olds | 45 (50.0%) | 45 (50.0%) |
| 15 to 17 Year Olds | 43 (100.0%) | 0 (0.0%) |
| 18 to 19 Year Olds | 22 (100.0%) | 0 (0.0%) |
| 20 to 24 Year Olds | 19 (100.0%) | 0 (0.0%) |
| 25 to 34 Year Olds | 0 (0.0%) | 0 (0.0%) |
| 35 Years and over | 0 (0.0%) | 0 (0.0%) |
| Total | 207 (77.2%) | 61 (22.8%) |
Educational Attainment by Field of Study in Rocky Point
Business (116 | 30.2%), social sciences (56 | 14.6%), engineering (40 | 10.4%), bio, nature & agricultural (34 | 8.8%), and science & technology (34 | 8.8%) are the most common fields of study among 384 individuals in Rocky Point who have obtained a bachelor's degree or higher.
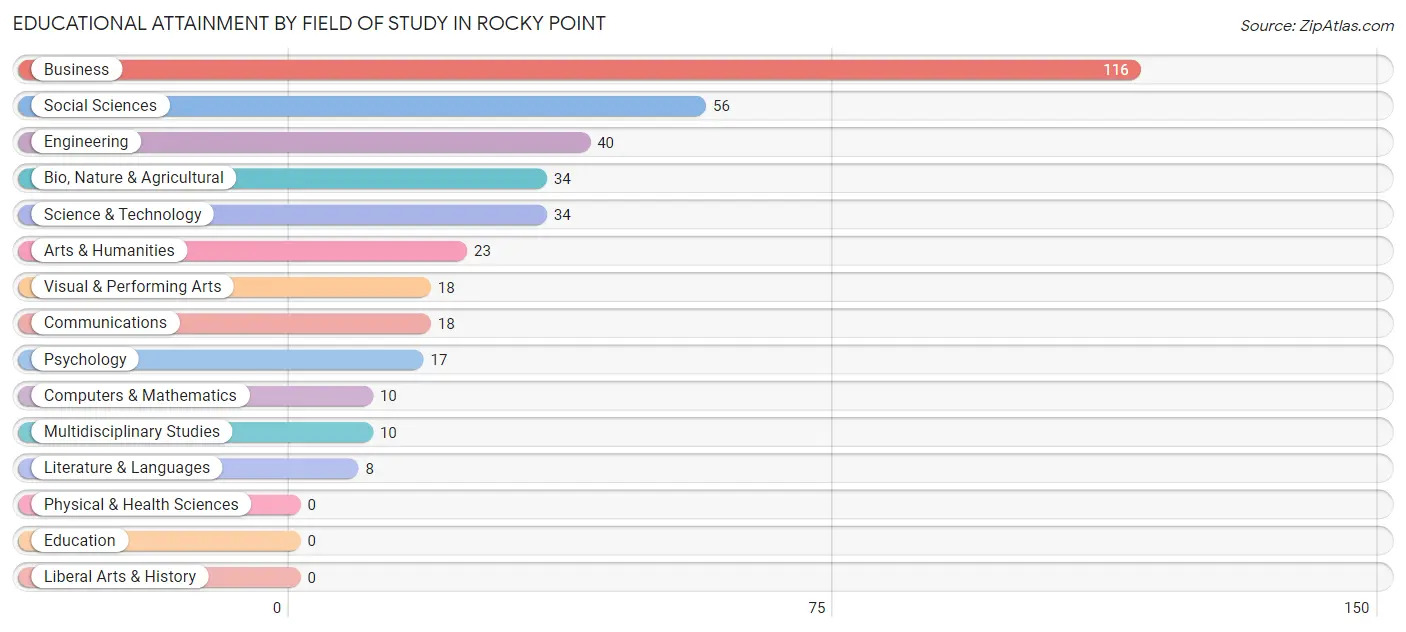
| Field of Study | # Graduates | % Graduates |
| Computers & Mathematics | 10 | 2.6% |
| Bio, Nature & Agricultural | 34 | 8.8% |
| Physical & Health Sciences | 0 | 0.0% |
| Psychology | 17 | 4.4% |
| Social Sciences | 56 | 14.6% |
| Engineering | 40 | 10.4% |
| Multidisciplinary Studies | 10 | 2.6% |
| Science & Technology | 34 | 8.8% |
| Business | 116 | 30.2% |
| Education | 0 | 0.0% |
| Literature & Languages | 8 | 2.1% |
| Liberal Arts & History | 0 | 0.0% |
| Visual & Performing Arts | 18 | 4.7% |
| Communications | 18 | 4.7% |
| Arts & Humanities | 23 | 6.0% |
| Total | 384 | 100.0% |
Transportation & Commute in Rocky Point
Vehicle Availability by Sex in Rocky Point
The most prevalent vehicle ownership categories in Rocky Point are males with 2 vehicles (162, accounting for 38.2%) and females with 2 vehicles (147, making up 46.0%).
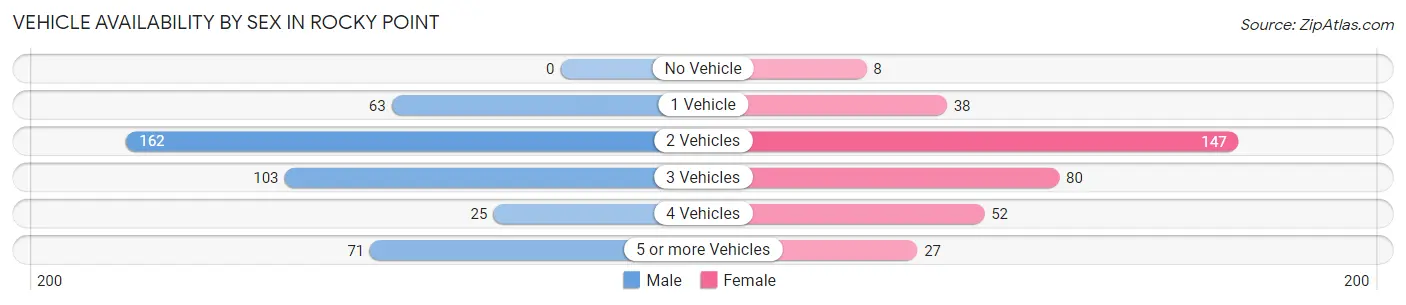
| Vehicles Available | Male | Female |
| No Vehicle | 0 (0.0%) | 8 (2.3%) |
| 1 Vehicle | 63 (14.9%) | 38 (10.8%) |
| 2 Vehicles | 162 (38.2%) | 147 (41.8%) |
| 3 Vehicles | 103 (24.3%) | 80 (22.7%) |
| 4 Vehicles | 25 (5.9%) | 52 (14.8%) |
| 5 or more Vehicles | 71 (16.8%) | 27 (7.7%) |
| Total | 424 (100.0%) | 352 (100.0%) |
Commute Time in Rocky Point
The most frequently occuring commute durations in Rocky Point are 5 to 9 minutes (106 commuters, 16.5%), 15 to 19 minutes (89 commuters, 13.8%), and 30 to 34 minutes (78 commuters, 12.1%).
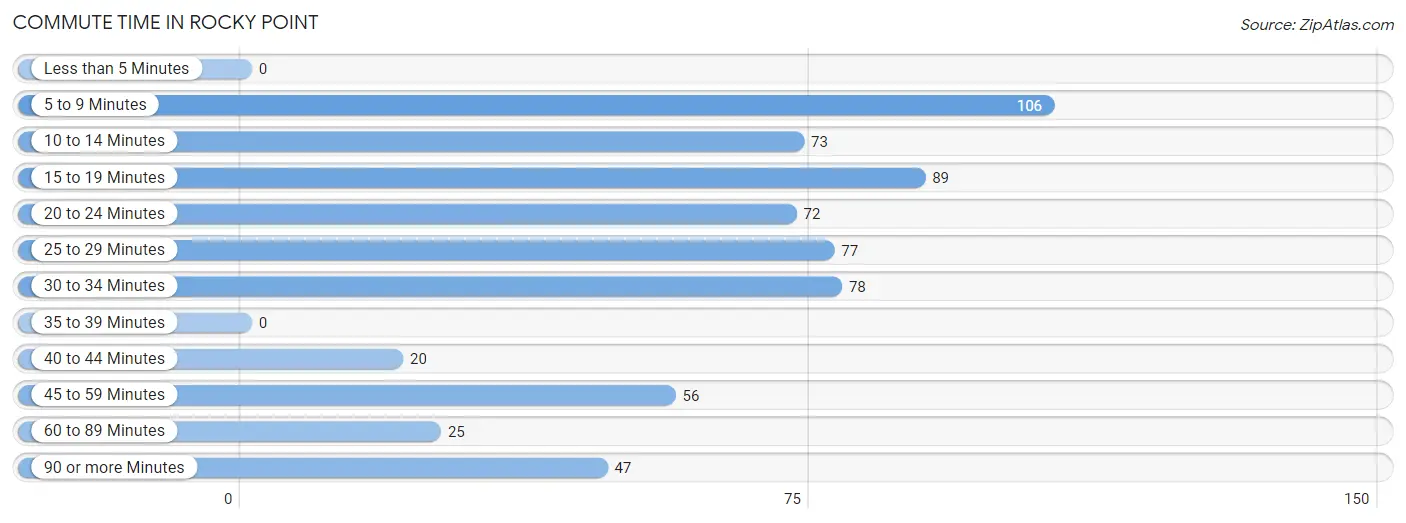
| Commute Time | # Commuters | % Commuters |
| Less than 5 Minutes | 0 | 0.0% |
| 5 to 9 Minutes | 106 | 16.5% |
| 10 to 14 Minutes | 73 | 11.4% |
| 15 to 19 Minutes | 89 | 13.8% |
| 20 to 24 Minutes | 72 | 11.2% |
| 25 to 29 Minutes | 77 | 12.0% |
| 30 to 34 Minutes | 78 | 12.1% |
| 35 to 39 Minutes | 0 | 0.0% |
| 40 to 44 Minutes | 20 | 3.1% |
| 45 to 59 Minutes | 56 | 8.7% |
| 60 to 89 Minutes | 25 | 3.9% |
| 90 or more Minutes | 47 | 7.3% |
Commute Time by Sex in Rocky Point
The most common commute times in Rocky Point are 15 to 19 minutes (60 commuters, 17.2%) for males and 25 to 29 minutes (70 commuters, 23.7%) for females.
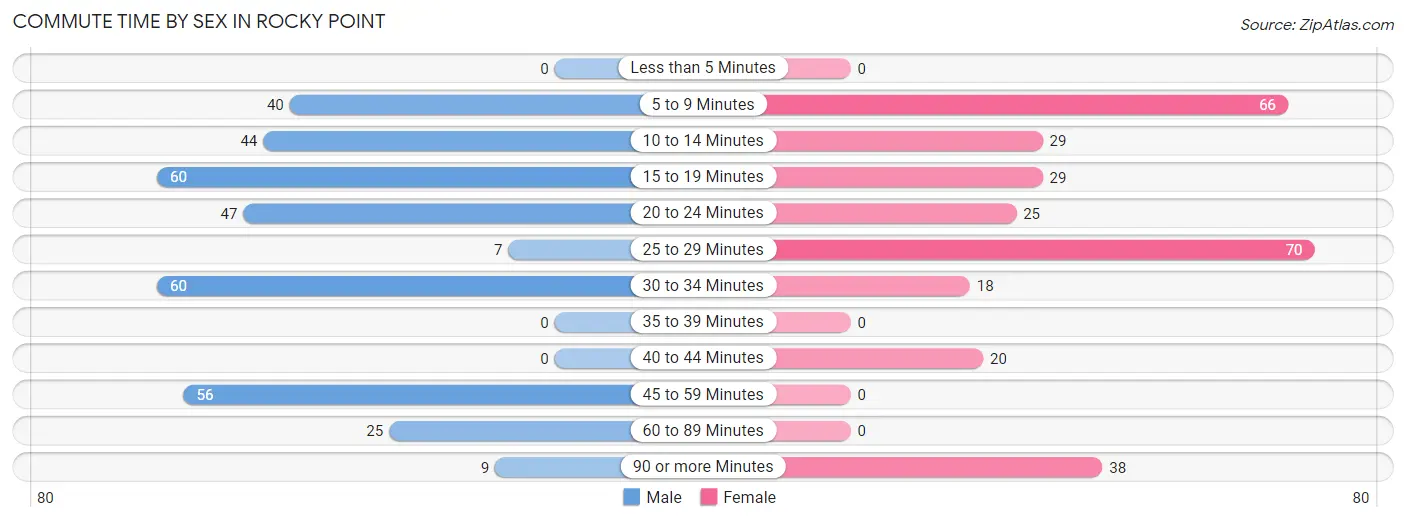
| Commute Time | Male | Female |
| Less than 5 Minutes | 0 (0.0%) | 0 (0.0%) |
| 5 to 9 Minutes | 40 (11.5%) | 66 (22.4%) |
| 10 to 14 Minutes | 44 (12.6%) | 29 (9.8%) |
| 15 to 19 Minutes | 60 (17.2%) | 29 (9.8%) |
| 20 to 24 Minutes | 47 (13.5%) | 25 (8.5%) |
| 25 to 29 Minutes | 7 (2.0%) | 70 (23.7%) |
| 30 to 34 Minutes | 60 (17.2%) | 18 (6.1%) |
| 35 to 39 Minutes | 0 (0.0%) | 0 (0.0%) |
| 40 to 44 Minutes | 0 (0.0%) | 20 (6.8%) |
| 45 to 59 Minutes | 56 (16.1%) | 0 (0.0%) |
| 60 to 89 Minutes | 25 (7.2%) | 0 (0.0%) |
| 90 or more Minutes | 9 (2.6%) | 38 (12.9%) |
Time of Departure to Work by Sex in Rocky Point
The most frequent times of departure to work in Rocky Point are 7:00 AM to 7:29 AM (101, 29.0%) for males and 8:30 AM to 8:59 AM (62, 21.0%) for females.
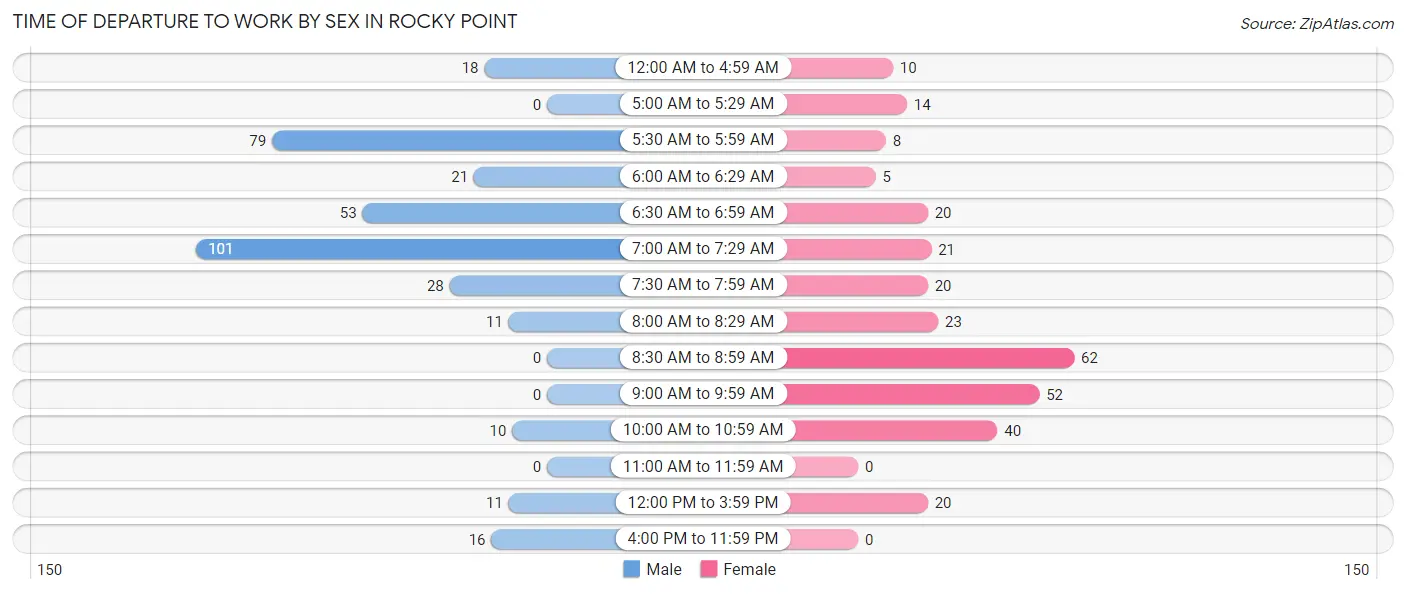
| Time of Departure | Male | Female |
| 12:00 AM to 4:59 AM | 18 (5.2%) | 10 (3.4%) |
| 5:00 AM to 5:29 AM | 0 (0.0%) | 14 (4.8%) |
| 5:30 AM to 5:59 AM | 79 (22.7%) | 8 (2.7%) |
| 6:00 AM to 6:29 AM | 21 (6.0%) | 5 (1.7%) |
| 6:30 AM to 6:59 AM | 53 (15.2%) | 20 (6.8%) |
| 7:00 AM to 7:29 AM | 101 (29.0%) | 21 (7.1%) |
| 7:30 AM to 7:59 AM | 28 (8.1%) | 20 (6.8%) |
| 8:00 AM to 8:29 AM | 11 (3.2%) | 23 (7.8%) |
| 8:30 AM to 8:59 AM | 0 (0.0%) | 62 (21.0%) |
| 9:00 AM to 9:59 AM | 0 (0.0%) | 52 (17.6%) |
| 10:00 AM to 10:59 AM | 10 (2.9%) | 40 (13.6%) |
| 11:00 AM to 11:59 AM | 0 (0.0%) | 0 (0.0%) |
| 12:00 PM to 3:59 PM | 11 (3.2%) | 20 (6.8%) |
| 4:00 PM to 11:59 PM | 16 (4.6%) | 0 (0.0%) |
| Total | 348 (100.0%) | 295 (100.0%) |
Housing Occupancy in Rocky Point
Occupancy by Ownership in Rocky Point
Of the total 685 dwellings in Rocky Point, owner-occupied units account for 552 (80.6%), while renter-occupied units make up 133 (19.4%).
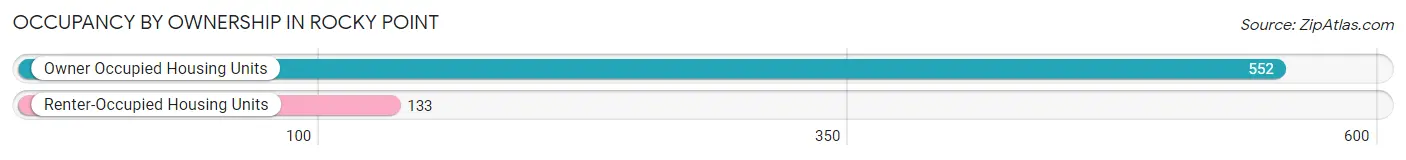
| Occupancy | # Housing Units | % Housing Units |
| Owner Occupied Housing Units | 552 | 80.6% |
| Renter-Occupied Housing Units | 133 | 19.4% |
| Total Occupied Housing Units | 685 | 100.0% |
Occupancy by Household Size in Rocky Point
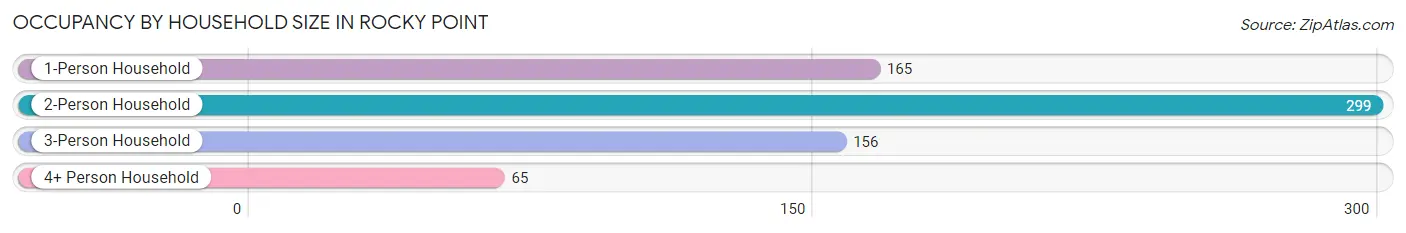
| Household Size | # Housing Units | % Housing Units |
| 1-Person Household | 165 | 24.1% |
| 2-Person Household | 299 | 43.6% |
| 3-Person Household | 156 | 22.8% |
| 4+ Person Household | 65 | 9.5% |
| Total Housing Units | 685 | 100.0% |
Occupancy by Ownership by Household Size in Rocky Point
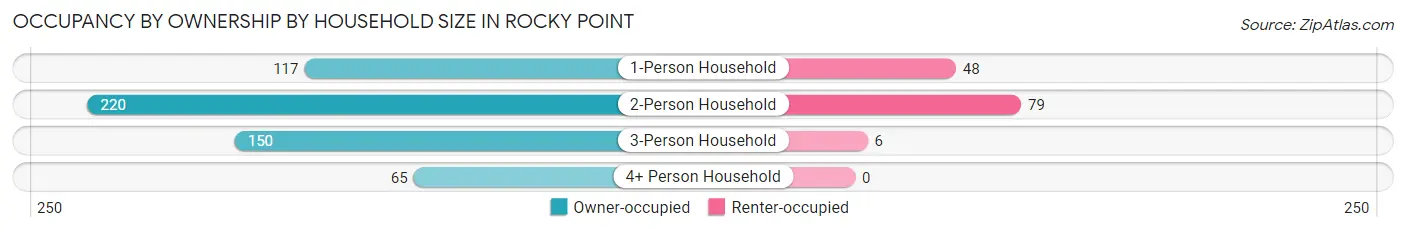
| Household Size | Owner-occupied | Renter-occupied |
| 1-Person Household | 117 (70.9%) | 48 (29.1%) |
| 2-Person Household | 220 (73.6%) | 79 (26.4%) |
| 3-Person Household | 150 (96.2%) | 6 (3.8%) |
| 4+ Person Household | 65 (100.0%) | 0 (0.0%) |
| Total Housing Units | 552 (80.6%) | 133 (19.4%) |
Occupancy by Educational Attainment in Rocky Point
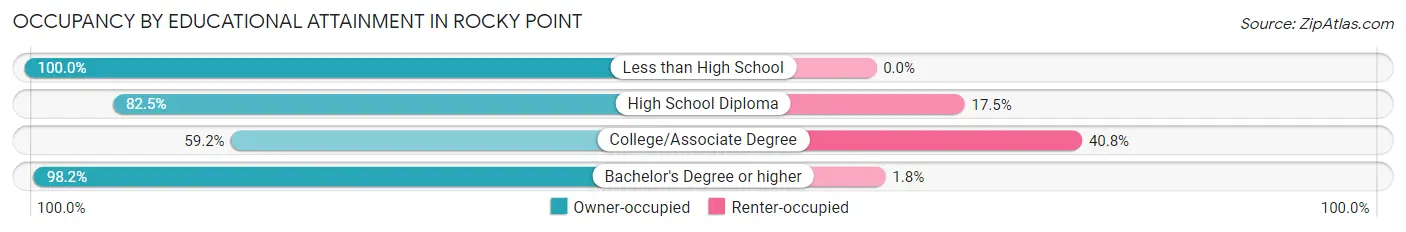
| Household Size | Owner-occupied | Renter-occupied |
| Less than High School | 63 (100.0%) | 0 (0.0%) |
| High School Diploma | 127 (82.5%) | 27 (17.5%) |
| College/Associate Degree | 148 (59.2%) | 102 (40.8%) |
| Bachelor's Degree or higher | 214 (98.2%) | 4 (1.8%) |
Occupancy by Age of Householder in Rocky Point
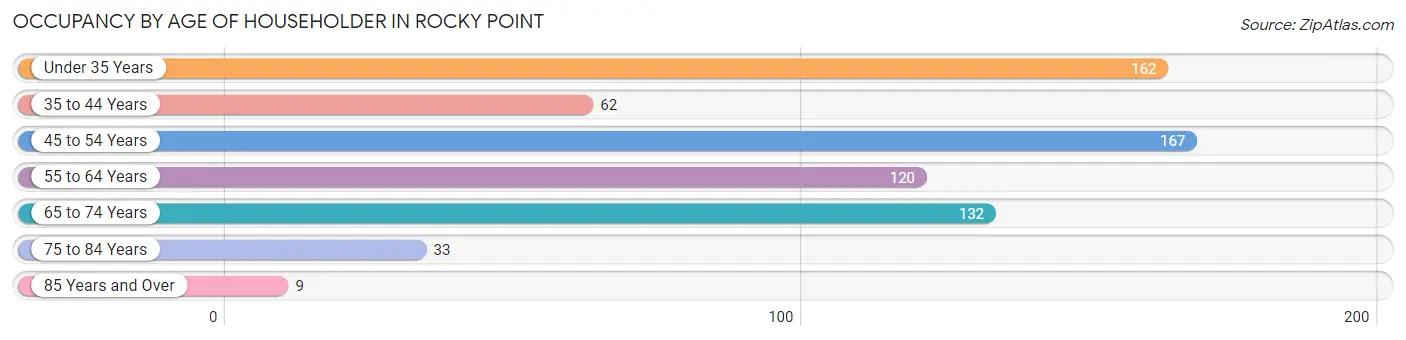
| Age Bracket | # Households | % Households |
| Under 35 Years | 162 | 23.6% |
| 35 to 44 Years | 62 | 9.0% |
| 45 to 54 Years | 167 | 24.4% |
| 55 to 64 Years | 120 | 17.5% |
| 65 to 74 Years | 132 | 19.3% |
| 75 to 84 Years | 33 | 4.8% |
| 85 Years and Over | 9 | 1.3% |
| Total | 685 | 100.0% |
Housing Finances in Rocky Point
Median Income by Occupancy in Rocky Point
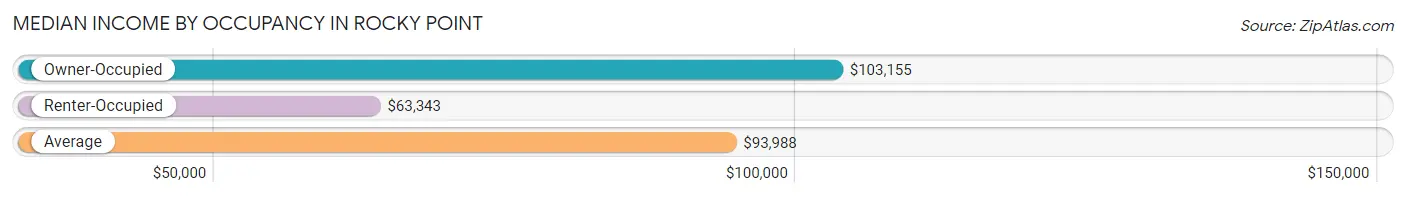
| Occupancy Type | # Households | Median Income |
| Owner-Occupied | 552 (80.6%) | $103,155 |
| Renter-Occupied | 133 (19.4%) | $63,343 |
| Average | 685 (100.0%) | $93,988 |
Occupancy by Householder Income Bracket in Rocky Point
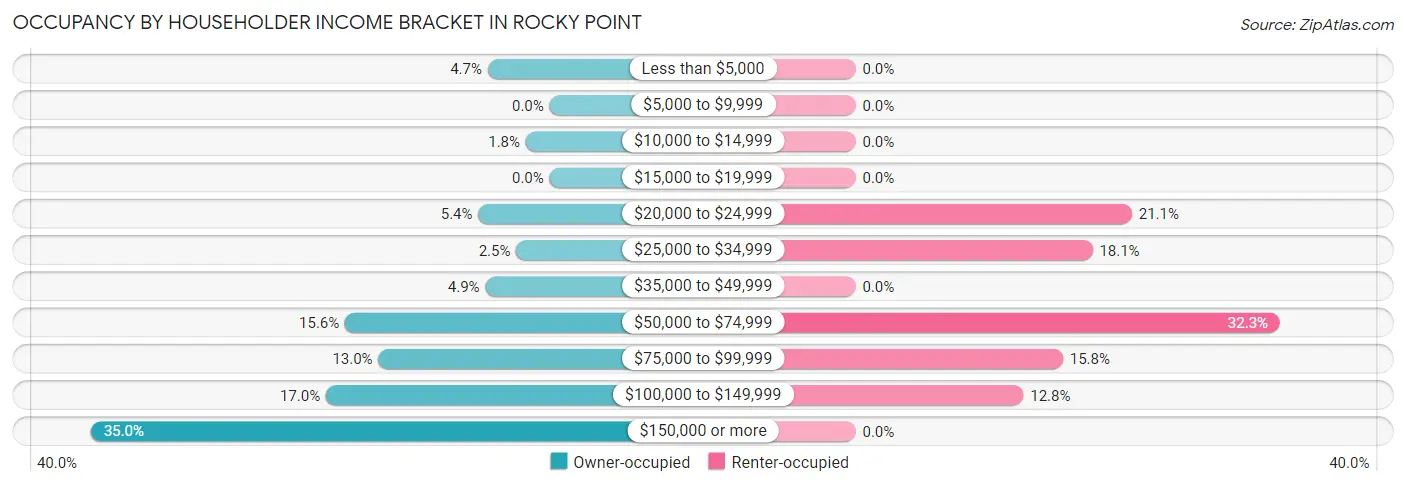
| Income Bracket | Owner-occupied | Renter-occupied |
| Less than $5,000 | 26 (4.7%) | 0 (0.0%) |
| $5,000 to $9,999 | 0 (0.0%) | 0 (0.0%) |
| $10,000 to $14,999 | 10 (1.8%) | 0 (0.0%) |
| $15,000 to $19,999 | 0 (0.0%) | 0 (0.0%) |
| $20,000 to $24,999 | 30 (5.4%) | 28 (21.0%) |
| $25,000 to $34,999 | 14 (2.5%) | 24 (18.0%) |
| $35,000 to $49,999 | 27 (4.9%) | 0 (0.0%) |
| $50,000 to $74,999 | 86 (15.6%) | 43 (32.3%) |
| $75,000 to $99,999 | 72 (13.0%) | 21 (15.8%) |
| $100,000 to $149,999 | 94 (17.0%) | 17 (12.8%) |
| $150,000 or more | 193 (35.0%) | 0 (0.0%) |
| Total | 552 (100.0%) | 133 (100.0%) |
Monthly Housing Cost Tiers in Rocky Point
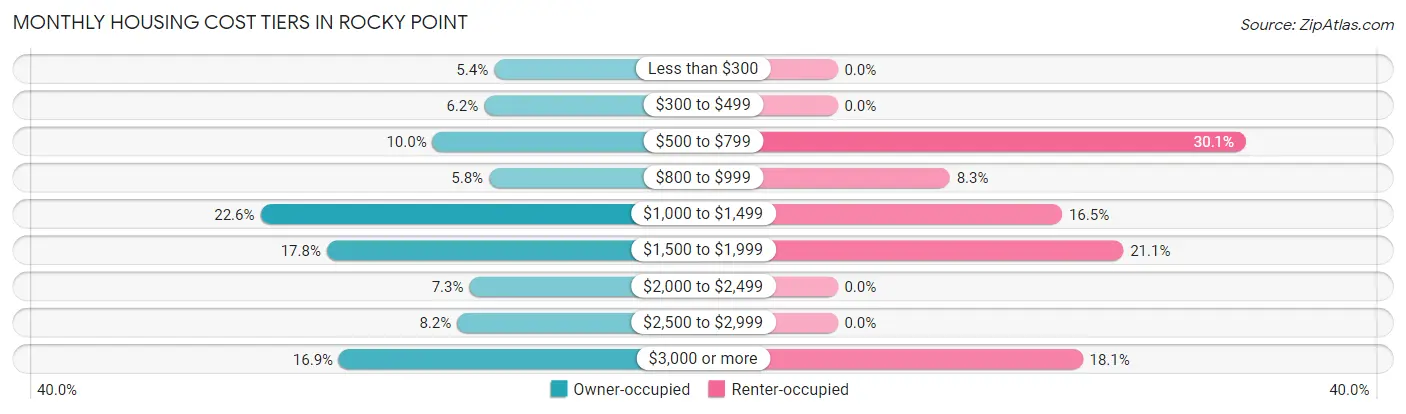
| Monthly Cost | Owner-occupied | Renter-occupied |
| Less than $300 | 30 (5.4%) | 0 (0.0%) |
| $300 to $499 | 34 (6.2%) | 0 (0.0%) |
| $500 to $799 | 55 (10.0%) | 40 (30.1%) |
| $800 to $999 | 32 (5.8%) | 11 (8.3%) |
| $1,000 to $1,499 | 125 (22.6%) | 22 (16.5%) |
| $1,500 to $1,999 | 98 (17.7%) | 28 (21.0%) |
| $2,000 to $2,499 | 40 (7.2%) | 0 (0.0%) |
| $2,500 to $2,999 | 45 (8.2%) | 0 (0.0%) |
| $3,000 or more | 93 (16.9%) | 24 (18.0%) |
| Total | 552 (100.0%) | 133 (100.0%) |
Physical Housing Characteristics in Rocky Point
Housing Structures in Rocky Point
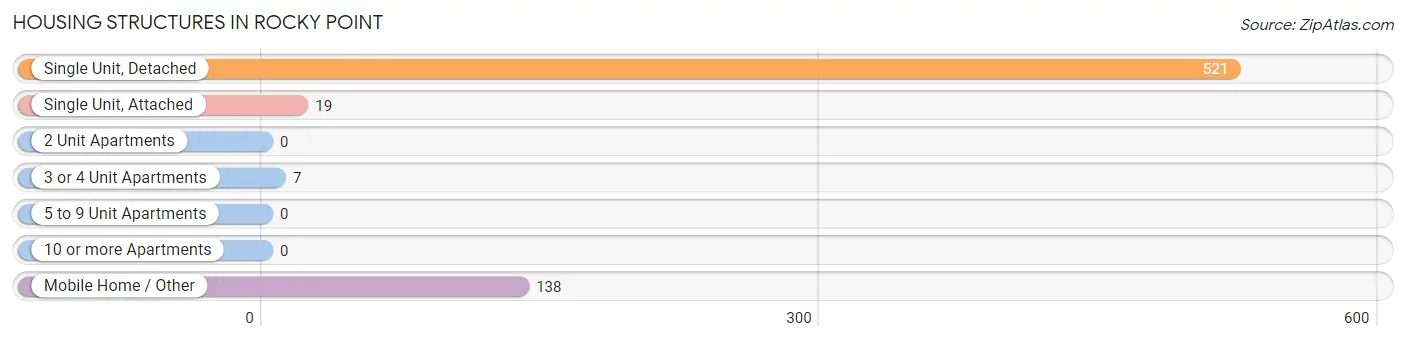
| Structure Type | # Housing Units | % Housing Units |
| Single Unit, Detached | 521 | 76.1% |
| Single Unit, Attached | 19 | 2.8% |
| 2 Unit Apartments | 0 | 0.0% |
| 3 or 4 Unit Apartments | 7 | 1.0% |
| 5 to 9 Unit Apartments | 0 | 0.0% |
| 10 or more Apartments | 0 | 0.0% |
| Mobile Home / Other | 138 | 20.2% |
| Total | 685 | 100.0% |
Housing Structures by Occupancy in Rocky Point
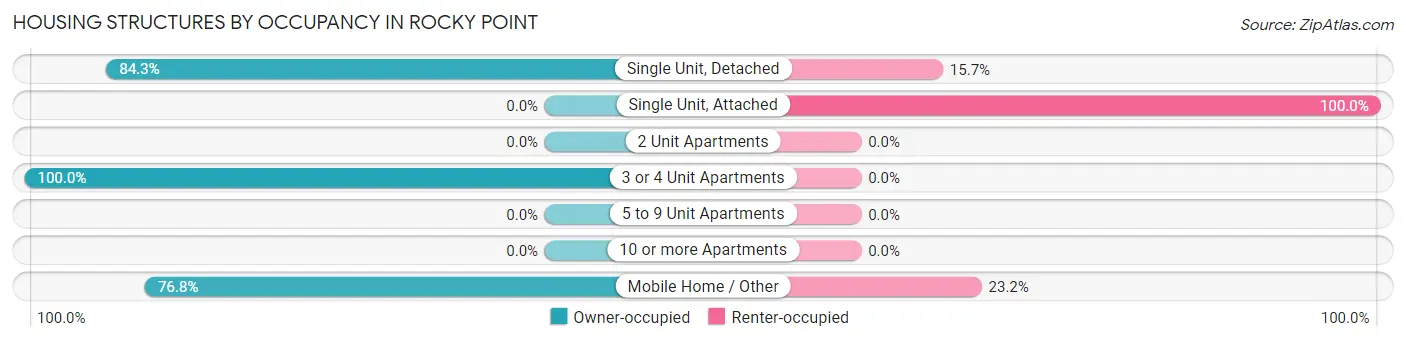
| Structure Type | Owner-occupied | Renter-occupied |
| Single Unit, Detached | 439 (84.3%) | 82 (15.7%) |
| Single Unit, Attached | 0 (0.0%) | 19 (100.0%) |
| 2 Unit Apartments | 0 (0.0%) | 0 (0.0%) |
| 3 or 4 Unit Apartments | 7 (100.0%) | 0 (0.0%) |
| 5 to 9 Unit Apartments | 0 (0.0%) | 0 (0.0%) |
| 10 or more Apartments | 0 (0.0%) | 0 (0.0%) |
| Mobile Home / Other | 106 (76.8%) | 32 (23.2%) |
| Total | 552 (80.6%) | 133 (19.4%) |
Housing Structures by Number of Rooms in Rocky Point
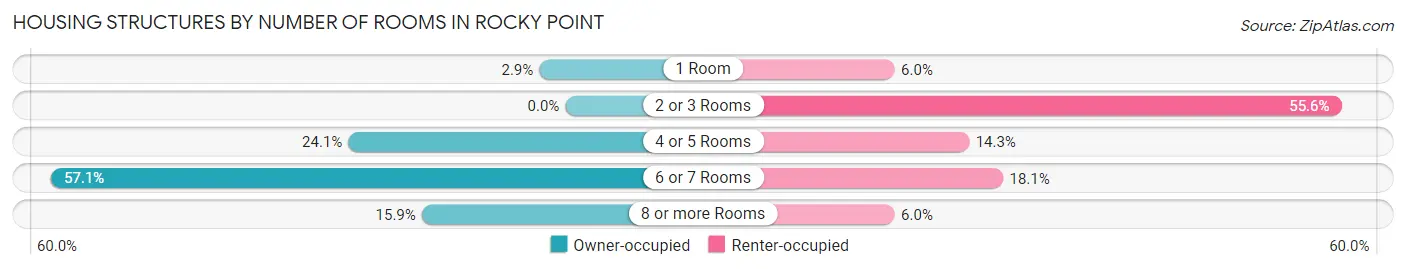
| Number of Rooms | Owner-occupied | Renter-occupied |
| 1 Room | 16 (2.9%) | 8 (6.0%) |
| 2 or 3 Rooms | 0 (0.0%) | 74 (55.6%) |
| 4 or 5 Rooms | 133 (24.1%) | 19 (14.3%) |
| 6 or 7 Rooms | 315 (57.1%) | 24 (18.0%) |
| 8 or more Rooms | 88 (15.9%) | 8 (6.0%) |
| Total | 552 (100.0%) | 133 (100.0%) |
Housing Structure by Heating Type in Rocky Point
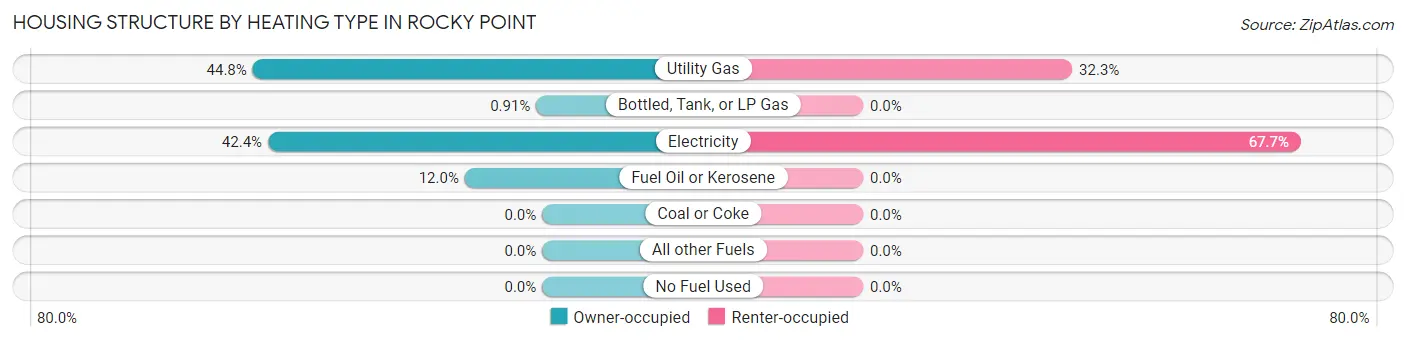
| Heating Type | Owner-occupied | Renter-occupied |
| Utility Gas | 247 (44.8%) | 43 (32.3%) |
| Bottled, Tank, or LP Gas | 5 (0.9%) | 0 (0.0%) |
| Electricity | 234 (42.4%) | 90 (67.7%) |
| Fuel Oil or Kerosene | 66 (12.0%) | 0 (0.0%) |
| Coal or Coke | 0 (0.0%) | 0 (0.0%) |
| All other Fuels | 0 (0.0%) | 0 (0.0%) |
| No Fuel Used | 0 (0.0%) | 0 (0.0%) |
| Total | 552 (100.0%) | 133 (100.0%) |
Household Vehicle Usage in Rocky Point
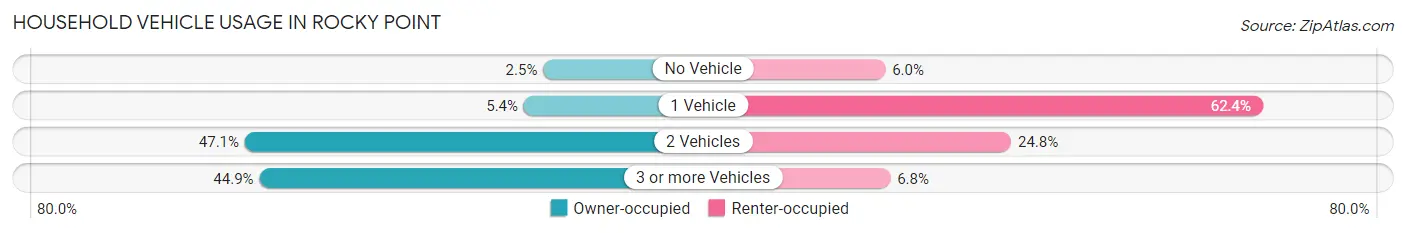
| Vehicles per Household | Owner-occupied | Renter-occupied |
| No Vehicle | 14 (2.5%) | 8 (6.0%) |
| 1 Vehicle | 30 (5.4%) | 83 (62.4%) |
| 2 Vehicles | 260 (47.1%) | 33 (24.8%) |
| 3 or more Vehicles | 248 (44.9%) | 9 (6.8%) |
| Total | 552 (100.0%) | 133 (100.0%) |
Real Estate & Mortgages in Rocky Point
Real Estate and Mortgage Overview in Rocky Point
| Characteristic | Without Mortgage | With Mortgage |
| Housing Units | 187 | 365 |
| Median Property Value | - | - |
| Median Household Income | $51,679 | $166 |
| Monthly Housing Costs | $706 | $93 |
| Real Estate Taxes | - | - |
Property Value by Mortgage Status in Rocky Point
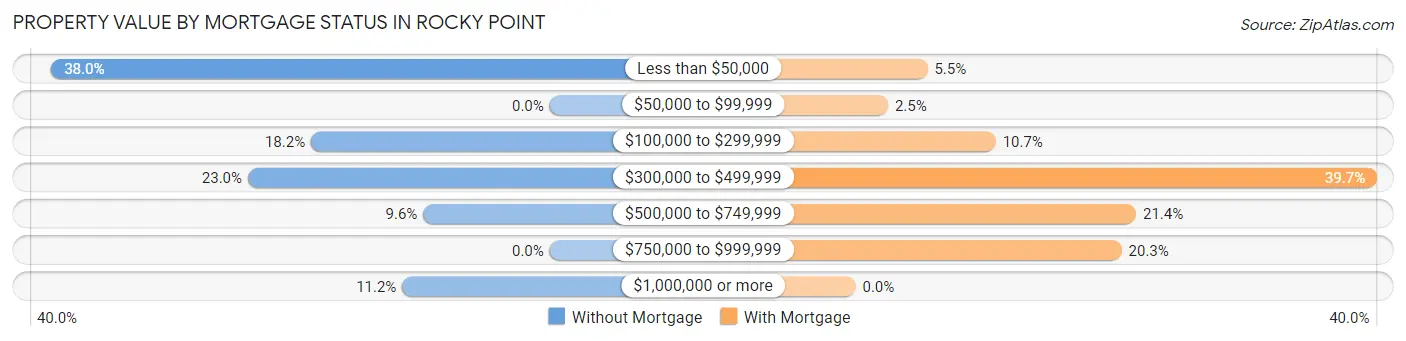
| Property Value | Without Mortgage | With Mortgage |
| Less than $50,000 | 71 (38.0%) | 20 (5.5%) |
| $50,000 to $99,999 | 0 (0.0%) | 9 (2.5%) |
| $100,000 to $299,999 | 34 (18.2%) | 39 (10.7%) |
| $300,000 to $499,999 | 43 (23.0%) | 145 (39.7%) |
| $500,000 to $749,999 | 18 (9.6%) | 78 (21.4%) |
| $750,000 to $999,999 | 0 (0.0%) | 74 (20.3%) |
| $1,000,000 or more | 21 (11.2%) | 0 (0.0%) |
| Total | 187 (100.0%) | 365 (100.0%) |
Household Income by Mortgage Status in Rocky Point
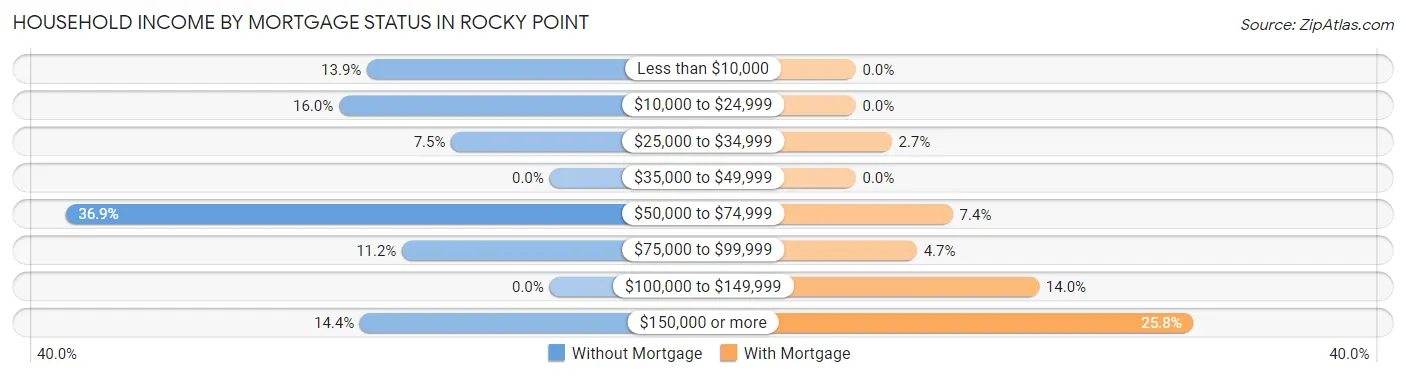
| Household Income | Without Mortgage | With Mortgage |
| Less than $10,000 | 26 (13.9%) | 0 (0.0%) |
| $10,000 to $24,999 | 30 (16.0%) | 0 (0.0%) |
| $25,000 to $34,999 | 14 (7.5%) | 10 (2.7%) |
| $35,000 to $49,999 | 0 (0.0%) | 0 (0.0%) |
| $50,000 to $74,999 | 69 (36.9%) | 27 (7.4%) |
| $75,000 to $99,999 | 21 (11.2%) | 17 (4.7%) |
| $100,000 to $149,999 | 0 (0.0%) | 51 (14.0%) |
| $150,000 or more | 27 (14.4%) | 94 (25.8%) |
| Total | 187 (100.0%) | 365 (100.0%) |
Property Value to Household Income Ratio in Rocky Point
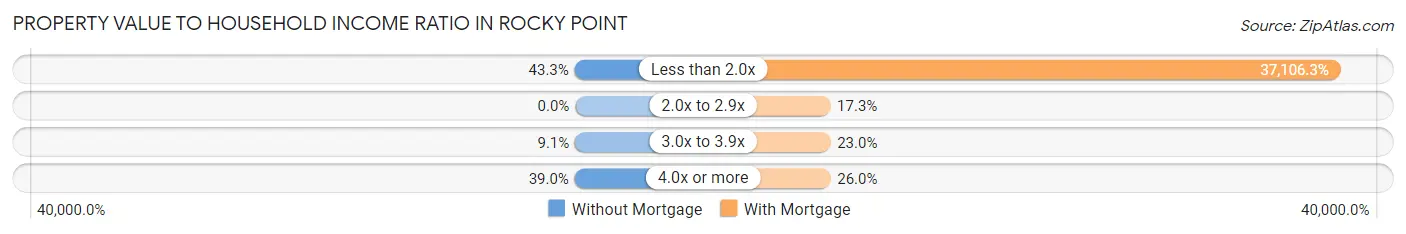
| Value-to-Income Ratio | Without Mortgage | With Mortgage |
| Less than 2.0x | 81 (43.3%) | 135,438 (37,106.3%) |
| 2.0x to 2.9x | 0 (0.0%) | 63 (17.3%) |
| 3.0x to 3.9x | 17 (9.1%) | 84 (23.0%) |
| 4.0x or more | 73 (39.0%) | 95 (26.0%) |
| Total | 187 (100.0%) | 365 (100.0%) |
Real Estate Taxes by Mortgage Status in Rocky Point
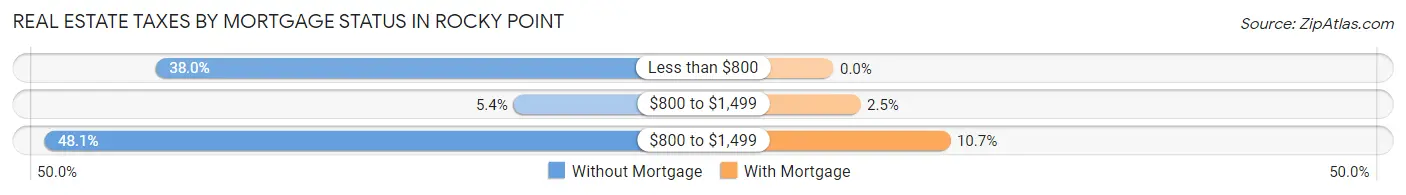
| Property Taxes | Without Mortgage | With Mortgage |
| Less than $800 | 71 (38.0%) | 0 (0.0%) |
| $800 to $1,499 | 10 (5.3%) | 9 (2.5%) |
| $800 to $1,499 | 90 (48.1%) | 39 (10.7%) |
| Total | 187 (100.0%) | 365 (100.0%) |
Health & Disability in Rocky Point
Health Insurance Coverage by Age in Rocky Point
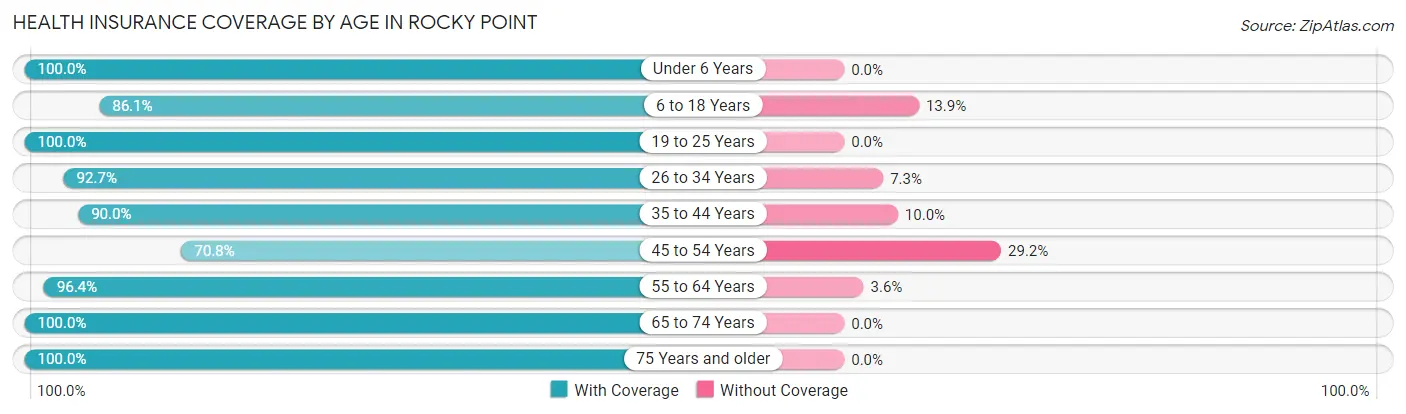
| Age Bracket | With Coverage | Without Coverage |
| Under 6 Years | 62 (100.0%) | 0 (0.0%) |
| 6 to 18 Years | 173 (86.1%) | 28 (13.9%) |
| 19 to 25 Years | 61 (100.0%) | 0 (0.0%) |
| 26 to 34 Years | 230 (92.7%) | 18 (7.3%) |
| 35 to 44 Years | 144 (90.0%) | 16 (10.0%) |
| 45 to 54 Years | 196 (70.8%) | 81 (29.2%) |
| 55 to 64 Years | 214 (96.4%) | 8 (3.6%) |
| 65 to 74 Years | 197 (100.0%) | 0 (0.0%) |
| 75 Years and older | 75 (100.0%) | 0 (0.0%) |
| Total | 1,352 (89.9%) | 151 (10.1%) |
Health Insurance Coverage by Citizenship Status in Rocky Point
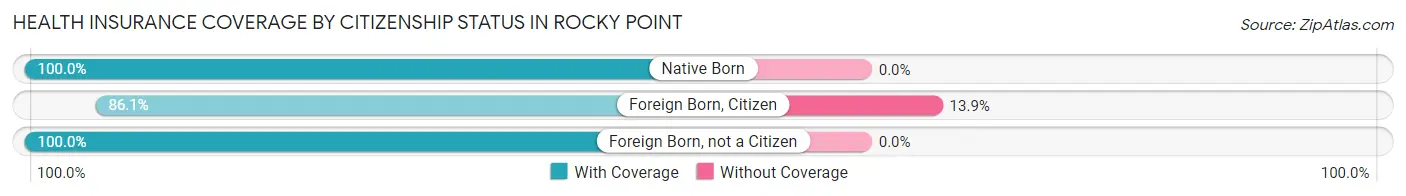
| Citizenship Status | With Coverage | Without Coverage |
| Native Born | 62 (100.0%) | 0 (0.0%) |
| Foreign Born, Citizen | 173 (86.1%) | 28 (13.9%) |
| Foreign Born, not a Citizen | 61 (100.0%) | 0 (0.0%) |
Health Insurance Coverage by Household Income in Rocky Point
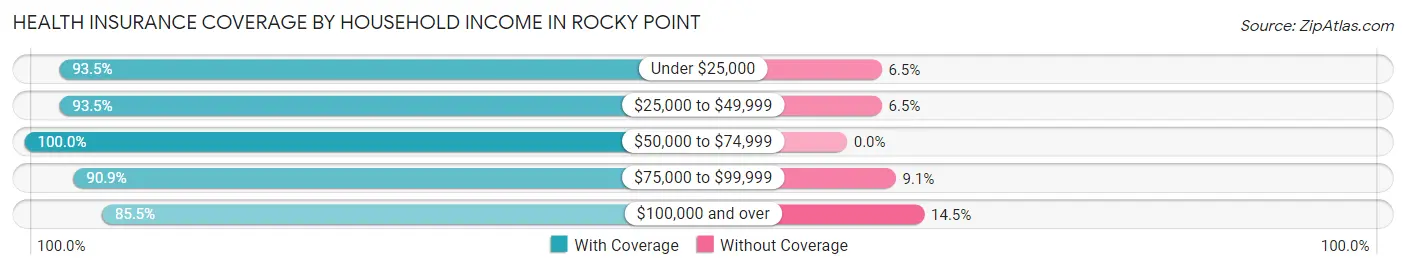
| Household Income | With Coverage | Without Coverage |
| Under $25,000 | 144 (93.5%) | 10 (6.5%) |
| $25,000 to $49,999 | 86 (93.5%) | 6 (6.5%) |
| $50,000 to $74,999 | 252 (100.0%) | 0 (0.0%) |
| $75,000 to $99,999 | 179 (90.9%) | 18 (9.1%) |
| $100,000 and over | 691 (85.5%) | 117 (14.5%) |
Public vs Private Health Insurance Coverage by Age in Rocky Point
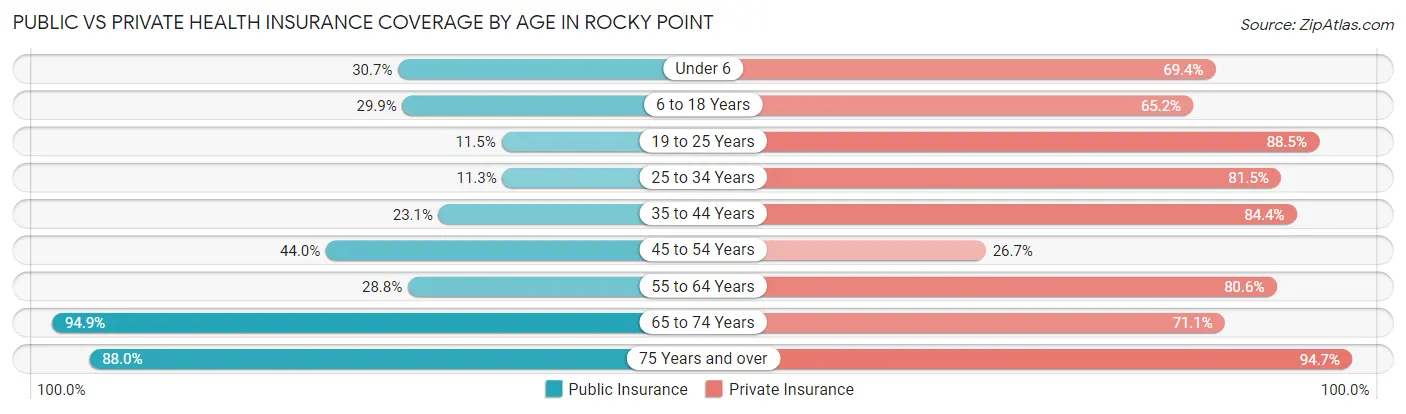
| Age Bracket | Public Insurance | Private Insurance |
| Under 6 | 19 (30.6%) | 43 (69.4%) |
| 6 to 18 Years | 60 (29.8%) | 131 (65.2%) |
| 19 to 25 Years | 7 (11.5%) | 54 (88.5%) |
| 25 to 34 Years | 28 (11.3%) | 202 (81.5%) |
| 35 to 44 Years | 37 (23.1%) | 135 (84.4%) |
| 45 to 54 Years | 122 (44.0%) | 74 (26.7%) |
| 55 to 64 Years | 64 (28.8%) | 179 (80.6%) |
| 65 to 74 Years | 187 (94.9%) | 140 (71.1%) |
| 75 Years and over | 66 (88.0%) | 71 (94.7%) |
| Total | 590 (39.3%) | 1,029 (68.5%) |
Disability Status by Sex by Age in Rocky Point
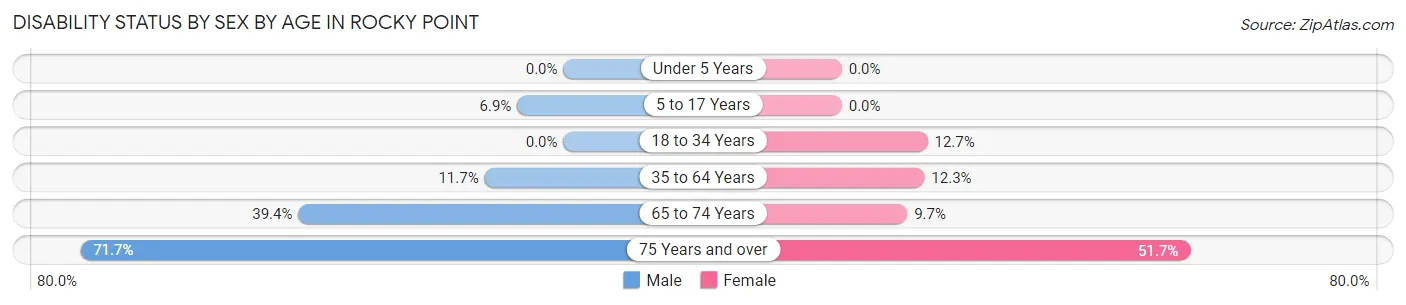
| Age Bracket | Male | Female |
| Under 5 Years | 0 (0.0%) | 0 (0.0%) |
| 5 to 17 Years | 7 (6.9%) | 0 (0.0%) |
| 18 to 34 Years | 0 (0.0%) | 14 (12.7%) |
| 35 to 64 Years | 39 (11.7%) | 40 (12.3%) |
| 65 to 74 Years | 37 (39.4%) | 10 (9.7%) |
| 75 Years and over | 33 (71.7%) | 15 (51.7%) |
Disability Class by Sex by Age in Rocky Point
Disability Class: Hearing Difficulty
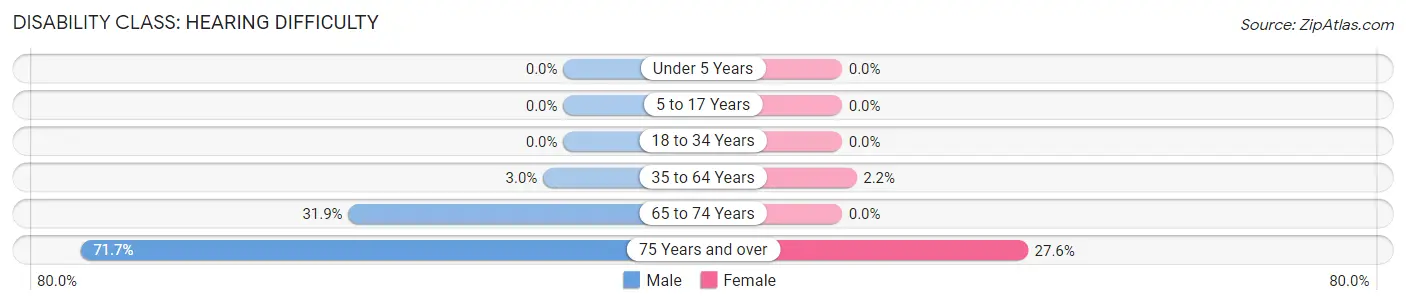
| Age Bracket | Male | Female |
| Under 5 Years | 0 (0.0%) | 0 (0.0%) |
| 5 to 17 Years | 0 (0.0%) | 0 (0.0%) |
| 18 to 34 Years | 0 (0.0%) | 0 (0.0%) |
| 35 to 64 Years | 10 (3.0%) | 7 (2.1%) |
| 65 to 74 Years | 30 (31.9%) | 0 (0.0%) |
| 75 Years and over | 33 (71.7%) | 8 (27.6%) |
Disability Class: Vision Difficulty
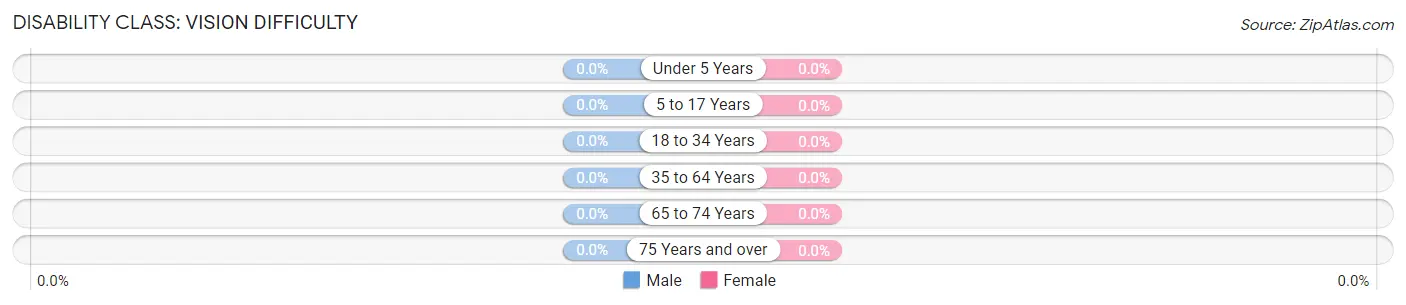
| Age Bracket | Male | Female |
| Under 5 Years | 0 (0.0%) | 0 (0.0%) |
| 5 to 17 Years | 0 (0.0%) | 0 (0.0%) |
| 18 to 34 Years | 0 (0.0%) | 0 (0.0%) |
| 35 to 64 Years | 0 (0.0%) | 0 (0.0%) |
| 65 to 74 Years | 0 (0.0%) | 0 (0.0%) |
| 75 Years and over | 0 (0.0%) | 0 (0.0%) |
Disability Class: Cognitive Difficulty
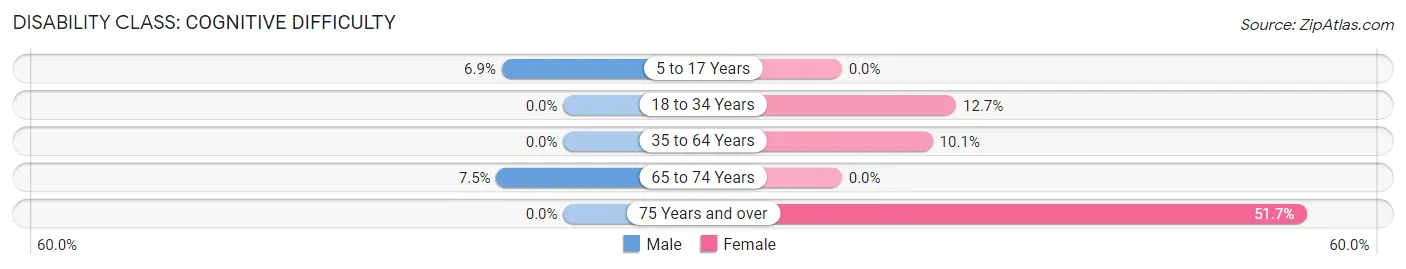
| Age Bracket | Male | Female |
| 5 to 17 Years | 7 (6.9%) | 0 (0.0%) |
| 18 to 34 Years | 0 (0.0%) | 14 (12.7%) |
| 35 to 64 Years | 0 (0.0%) | 33 (10.1%) |
| 65 to 74 Years | 7 (7.4%) | 0 (0.0%) |
| 75 Years and over | 0 (0.0%) | 15 (51.7%) |
Disability Class: Ambulatory Difficulty
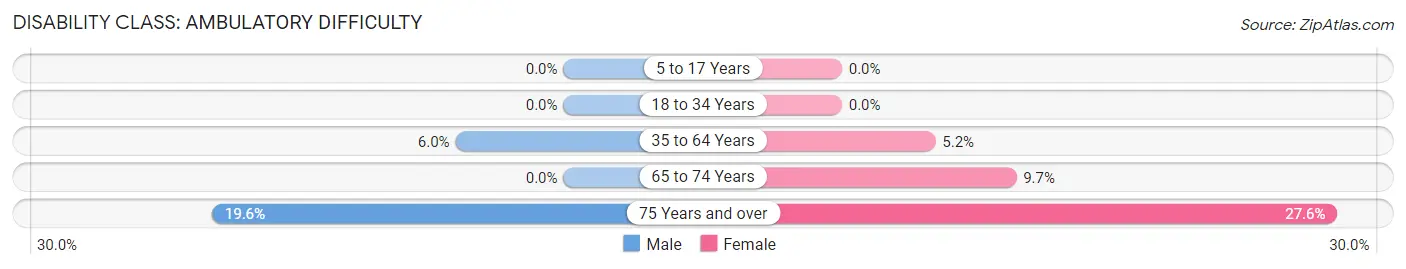
| Age Bracket | Male | Female |
| 5 to 17 Years | 0 (0.0%) | 0 (0.0%) |
| 18 to 34 Years | 0 (0.0%) | 0 (0.0%) |
| 35 to 64 Years | 20 (6.0%) | 17 (5.2%) |
| 65 to 74 Years | 0 (0.0%) | 10 (9.7%) |
| 75 Years and over | 9 (19.6%) | 8 (27.6%) |
Disability Class: Self-Care Difficulty
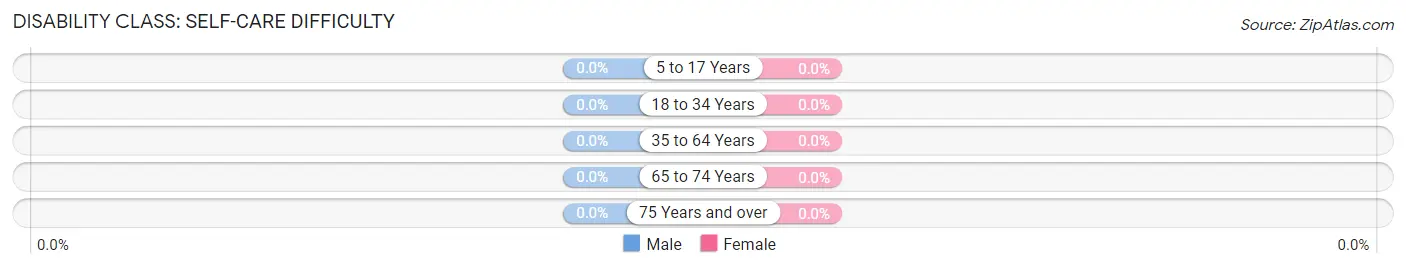
| Age Bracket | Male | Female |
| 5 to 17 Years | 0 (0.0%) | 0 (0.0%) |
| 18 to 34 Years | 0 (0.0%) | 0 (0.0%) |
| 35 to 64 Years | 0 (0.0%) | 0 (0.0%) |
| 65 to 74 Years | 0 (0.0%) | 0 (0.0%) |
| 75 Years and over | 0 (0.0%) | 0 (0.0%) |
Technology Access in Rocky Point
Computing Device Access in Rocky Point
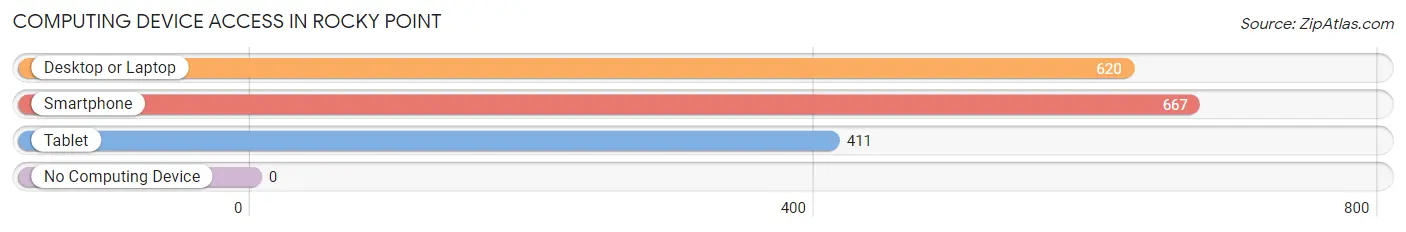
| Device Type | # Households | % Households |
| Desktop or Laptop | 620 | 90.5% |
| Smartphone | 667 | 97.4% |
| Tablet | 411 | 60.0% |
| No Computing Device | 0 | 0.0% |
| Total | 685 | 100.0% |
Internet Access in Rocky Point
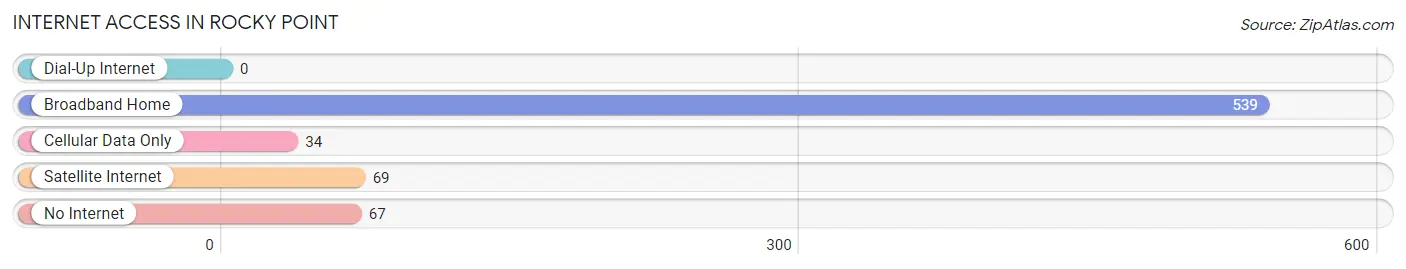
| Internet Type | # Households | % Households |
| Dial-Up Internet | 0 | 0.0% |
| Broadband Home | 539 | 78.7% |
| Cellular Data Only | 34 | 5.0% |
| Satellite Internet | 69 | 10.1% |
| No Internet | 67 | 9.8% |
| Total | 685 | 100.0% |
Rocky Point Summary
Rocky Point is a small unincorporated community located in the Pacific Northwest region of the United States, in the state of Washington. It is situated on the western shore of Puget Sound, approximately 25 miles south of Seattle. The community is part of the Kitsap County census-designated place (CDP) of Rocky Point-Silverdale.
History
The area now known as Rocky Point was first inhabited by the Suquamish Tribe, who lived in the area for thousands of years before the arrival of European settlers. The first recorded European settler in the area was William H. McAllister, who arrived in 1853 and established a homestead on the shore of Rocky Point. The area was later named after the rocky point of land that jutted out into the Puget Sound.
In the late 19th century, the area was developed as a resort destination, with several hotels and resorts being built in the area. The area was also home to a number of logging camps, which provided employment for many of the local residents.
In the early 20th century, the area was home to a number of small farms and orchards, as well as a number of small businesses. The area was also home to a number of small logging camps, which provided employment for many of the local residents.
In the late 20th century, the area began to experience rapid growth, as the Seattle metropolitan area expanded southward. The area is now home to a number of residential neighborhoods, as well as a number of businesses and commercial developments.
Geography
Rocky Point is located on the western shore of Puget Sound, approximately 25 miles south of Seattle. The community is situated on a rocky point of land that juts out into the Puget Sound. The area is surrounded by a number of small islands, including Blake Island, Bainbridge Island, and Vashon Island.
The area is characterized by a number of small bays and inlets, as well as a number of small coves and beaches. The area is also home to a number of small islands, including Blake Island, Bainbridge Island, and Vashon Island.
The area is home to a number of small parks and recreational areas, including Rocky Point Park, which is located on the rocky point of land that juts out into the Puget Sound. The park is home to a number of trails, as well as a number of picnic areas and playgrounds.
Economy
The economy of Rocky Point is largely based on the service industry, with a number of businesses providing services to the local community. The area is also home to a number of small businesses, including restaurants, retail stores, and other small businesses.
The area is also home to a number of small farms and orchards, as well as a number of small businesses. The area is also home to a number of small logging camps, which provide employment for many of the local residents.
Demographics
As of the 2010 census, the population of Rocky Point was 4,845. The racial makeup of the area was 87.3% White, 5.2% Asian, 2.2% African American, 0.7% Native American, 0.2% Pacific Islander, and 4.4% from other races. The median household income in the area was $60,945, and the median family income was $68,945.
Conclusion
Rocky Point is a small unincorporated community located in the Pacific Northwest region of the United States, in the state of Washington. It is situated on the western shore of Puget Sound, approximately 25 miles south of Seattle. The area is characterized by a number of small bays and inlets, as well as a number of small coves and beaches. The economy of Rocky Point is largely based on the service industry, with a number of businesses providing services to the local community. As of the 2010 census, the population of Rocky Point was 4,845. The racial makeup of the area was 87.3% White, 5.2% Asian, 2.2% African American, 0.7% Native American, 0.2% Pacific Islander, and 4.4% from other races. The median household income in the area was $60,945, and the median family income was $68,945.
Common Questions
What is Per Capita Income in Rocky Point?
Per Capita income in Rocky Point is $48,758.
What is the Median Family Income in Rocky Point?
Median Family Income in Rocky Point is $103,487.
What is the Median Household income in Rocky Point?
Median Household Income in Rocky Point is $93,988.
What is Income or Wage Gap in Rocky Point?
Income or Wage Gap in Rocky Point is 46.3%.
Women in Rocky Point earn 53.7 cents for every dollar earned by a man.
What is Inequality or Gini Index in Rocky Point?
Inequality or Gini Index in Rocky Point is 0.39.
What is the Total Population of Rocky Point?
Total Population of Rocky Point is 1,546.
What is the Total Male Population of Rocky Point?
Total Male Population of Rocky Point is 843.
What is the Total Female Population of Rocky Point?
Total Female Population of Rocky Point is 703.
What is the Ratio of Males per 100 Females in Rocky Point?
There are 119.91 Males per 100 Females in Rocky Point.
What is the Ratio of Females per 100 Males in Rocky Point?
There are 83.39 Females per 100 Males in Rocky Point.
What is the Median Population Age in Rocky Point?
Median Population Age in Rocky Point is 44.9 Years.
What is the Average Family Size in Rocky Point
Average Family Size in Rocky Point is 2.7 People.
What is the Average Household Size in Rocky Point
Average Household Size in Rocky Point is 2.3 People.
How Large is the Labor Force in Rocky Point?
There are 898 People in the Labor Forcein in Rocky Point.
What is the Percentage of People in the Labor Force in Rocky Point?
67.1% of People are in the Labor Force in Rocky Point.
What is the Unemployment Rate in Rocky Point?
Unemployment Rate in Rocky Point is 6.8%.