Zip Codes with the Highest Percentage of Population Employed in Installation, Maintenance & Repair in Sammamish, WA
RELATED REPORTS & OPTIONS
Installation, Maintenance & Repair
Sammamish
Compare Zip Codes
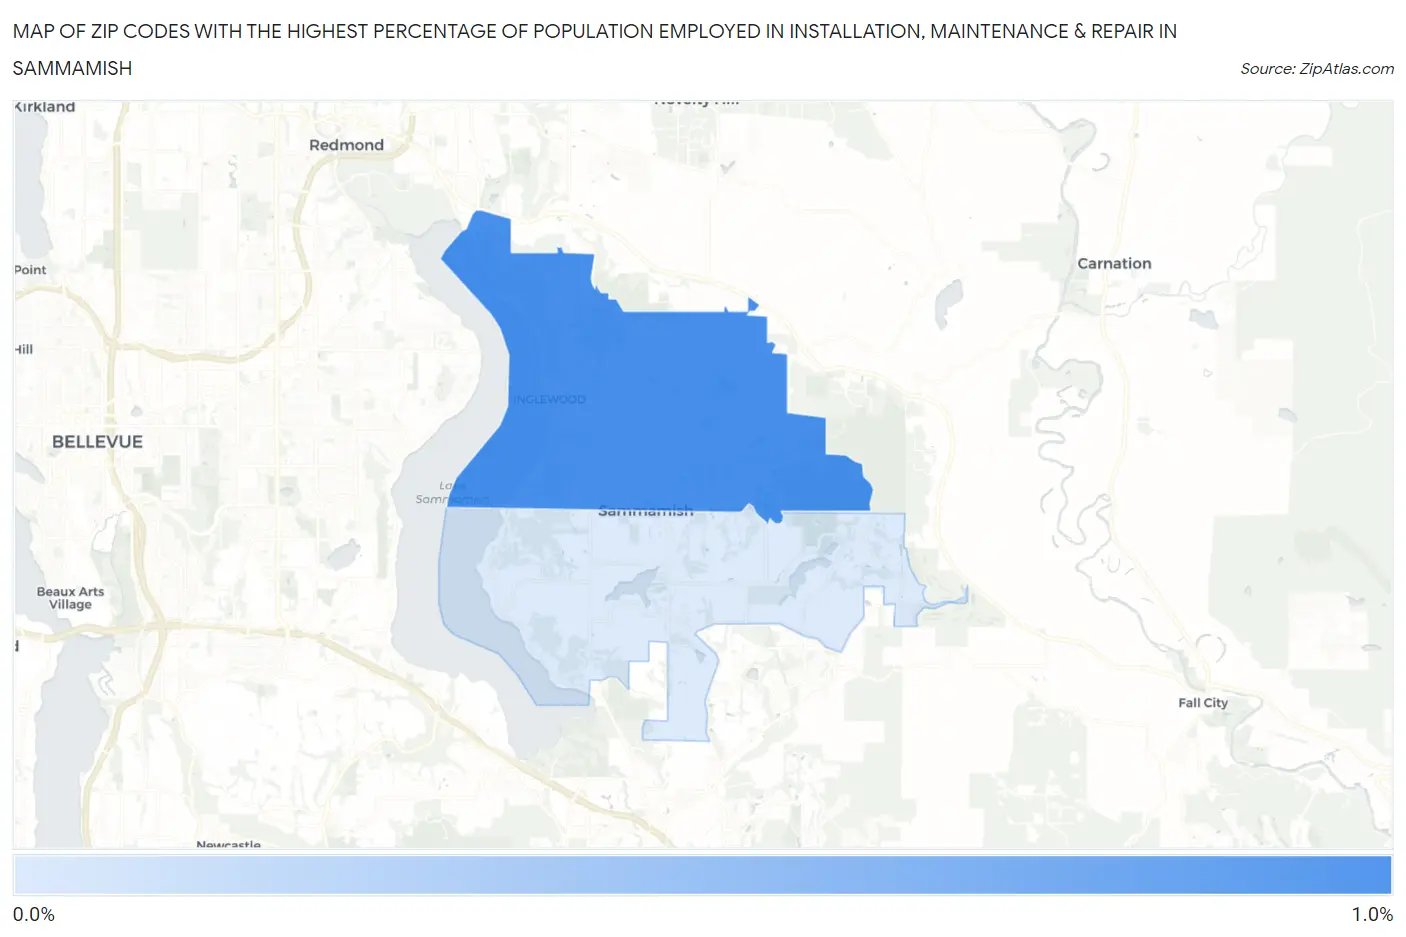
Map of Zip Codes with the Highest Percentage of Population Employed in Installation, Maintenance & Repair in Sammamish
0.047%
0.90%
Zip Codes with the Highest Percentage of Population Employed in Installation, Maintenance & Repair in Sammamish, WA
| Zip Code | % Employed | vs State | vs National | |
| 1. | 98074 | 0.90% | 2.9%(-2.03)#462 | 3.1%(-2.17)#26,206 |
| 2. | 98075 | 0.047% | 2.9%(-2.88)#493 | 3.1%(-3.02)#27,794 |
1
Common Questions
What are the Top Zip Codes with the Highest Percentage of Population Employed in Installation, Maintenance & Repair in Sammamish, WA?
Top Zip Codes with the Highest Percentage of Population Employed in Installation, Maintenance & Repair in Sammamish, WA are:
What zip code has the Highest Percentage of Population Employed in Installation, Maintenance & Repair in Sammamish, WA?
98074 has the Highest Percentage of Population Employed in Installation, Maintenance & Repair in Sammamish, WA with 0.90%.
What is the Percentage of Population Employed in Installation, Maintenance & Repair in Sammamish, WA?
Percentage of Population Employed in Installation, Maintenance & Repair in Sammamish is 0.89%.
What is the Percentage of Population Employed in Installation, Maintenance & Repair in Washington?
Percentage of Population Employed in Installation, Maintenance & Repair in Washington is 2.9%.
What is the Percentage of Population Employed in Installation, Maintenance & Repair in the United States?
Percentage of Population Employed in Installation, Maintenance & Repair in the United States is 3.1%.