Zip Codes with the Highest Percentage of Population Employed in Installation, Maintenance & Repair in Marysville, WA
RELATED REPORTS & OPTIONS
Installation, Maintenance & Repair
Marysville
Compare Zip Codes
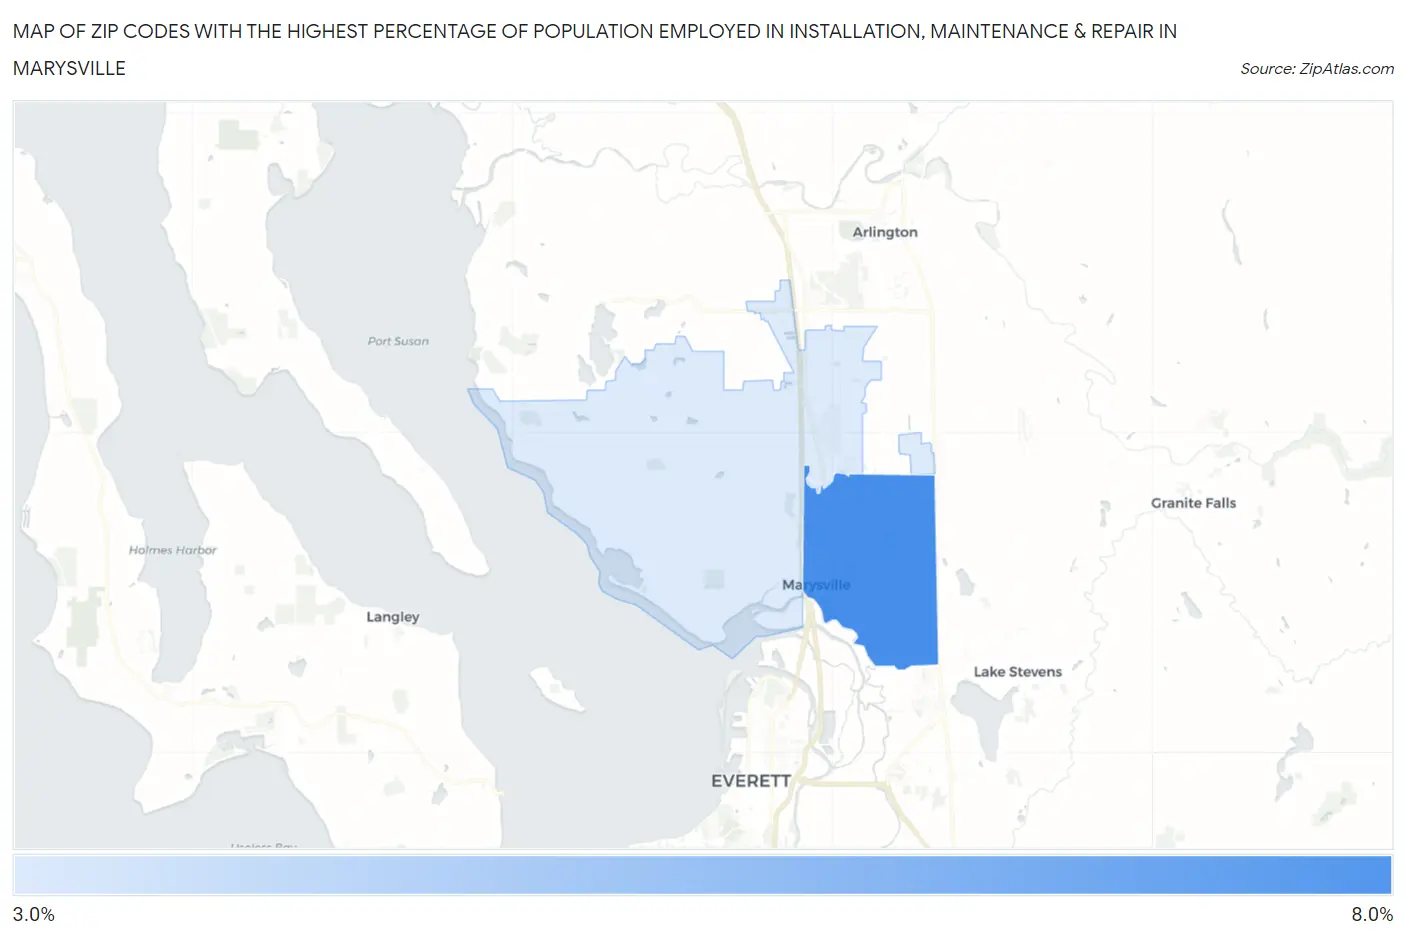
Map of Zip Codes with the Highest Percentage of Population Employed in Installation, Maintenance & Repair in Marysville
3.1%
7.0%
Zip Codes with the Highest Percentage of Population Employed in Installation, Maintenance & Repair in Marysville, WA
| Zip Code | % Employed | vs State | vs National | |
| 1. | 98270 | 7.0% | 2.9%(+4.05)#65 | 3.1%(+3.91)#4,480 |
| 2. | 98271 | 3.1% | 2.9%(+0.207)#266 | 3.1%(+0.068)#16,347 |
1
Common Questions
What are the Top Zip Codes with the Highest Percentage of Population Employed in Installation, Maintenance & Repair in Marysville, WA?
Top Zip Codes with the Highest Percentage of Population Employed in Installation, Maintenance & Repair in Marysville, WA are:
What zip code has the Highest Percentage of Population Employed in Installation, Maintenance & Repair in Marysville, WA?
98270 has the Highest Percentage of Population Employed in Installation, Maintenance & Repair in Marysville, WA with 7.0%.
What is the Percentage of Population Employed in Installation, Maintenance & Repair in Marysville, WA?
Percentage of Population Employed in Installation, Maintenance & Repair in Marysville is 5.8%.
What is the Percentage of Population Employed in Installation, Maintenance & Repair in Washington?
Percentage of Population Employed in Installation, Maintenance & Repair in Washington is 2.9%.
What is the Percentage of Population Employed in Installation, Maintenance & Repair in the United States?
Percentage of Population Employed in Installation, Maintenance & Repair in the United States is 3.1%.