Granite Falls, WA Map & Demographics
Granite Falls Map
Granite Falls Overview
$35,371
PER CAPITA INCOME
$100,385
AVG FAMILY INCOME
$87,600
AVG HOUSEHOLD INCOME
43.7%
WAGE / INCOME GAP [ % ]
56.3¢/ $1
WAGE / INCOME GAP [ $ ]
$10,937
FAMILY INCOME DEFICIT
0.33
INEQUALITY / GINI INDEX
4,567
TOTAL POPULATION
2,170
MALE POPULATION
2,397
FEMALE POPULATION
90.53
MALES / 100 FEMALES
110.46
FEMALES / 100 MALES
33.1
MEDIAN AGE
3.4
AVG FAMILY SIZE
2.7
AVG HOUSEHOLD SIZE
2,125
LABOR FORCE [ PEOPLE ]
63.4%
PERCENT IN LABOR FORCE
1.0%
UNEMPLOYMENT RATE
Granite Falls Zip Codes
Granite Falls Area Codes
Income in Granite Falls
Income Overview in Granite Falls
Per Capita Income in Granite Falls is $35,371, while median incomes of families and households are $100,385 and $87,600 respectively.
| Characteristic | Number | Measure |
| Per Capita Income | 4,567 | $35,371 |
| Median Family Income | 1,086 | $100,385 |
| Mean Family Income | 1,086 | $105,725 |
| Median Household Income | 1,694 | $87,600 |
| Mean Household Income | 1,694 | $94,166 |
| Income Deficit | 1,086 | $10,937 |
| Wage / Income Gap (%) | 4,567 | 43.65% |
| Wage / Income Gap ($) | 4,567 | 56.35¢ per $1 |
| Gini / Inequality Index | 4,567 | 0.33 |
Earnings by Sex in Granite Falls
Average Earnings in Granite Falls are $55,212, $72,297 for men and $40,738 for women, a difference of 43.6%.
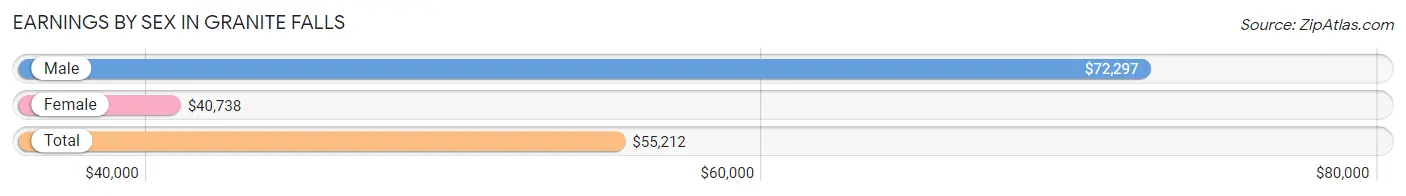
| Sex | Number | Average Earnings |
| Male | 1,127 (52.3%) | $72,297 |
| Female | 1,028 (47.7%) | $40,738 |
| Total | 2,155 (100.0%) | $55,212 |
Earnings by Sex by Income Bracket in Granite Falls
The most common earnings brackets in Granite Falls are $100,000+ for men (274 | 24.3%) and $55,000 to $64,999 for women (163 | 15.9%).
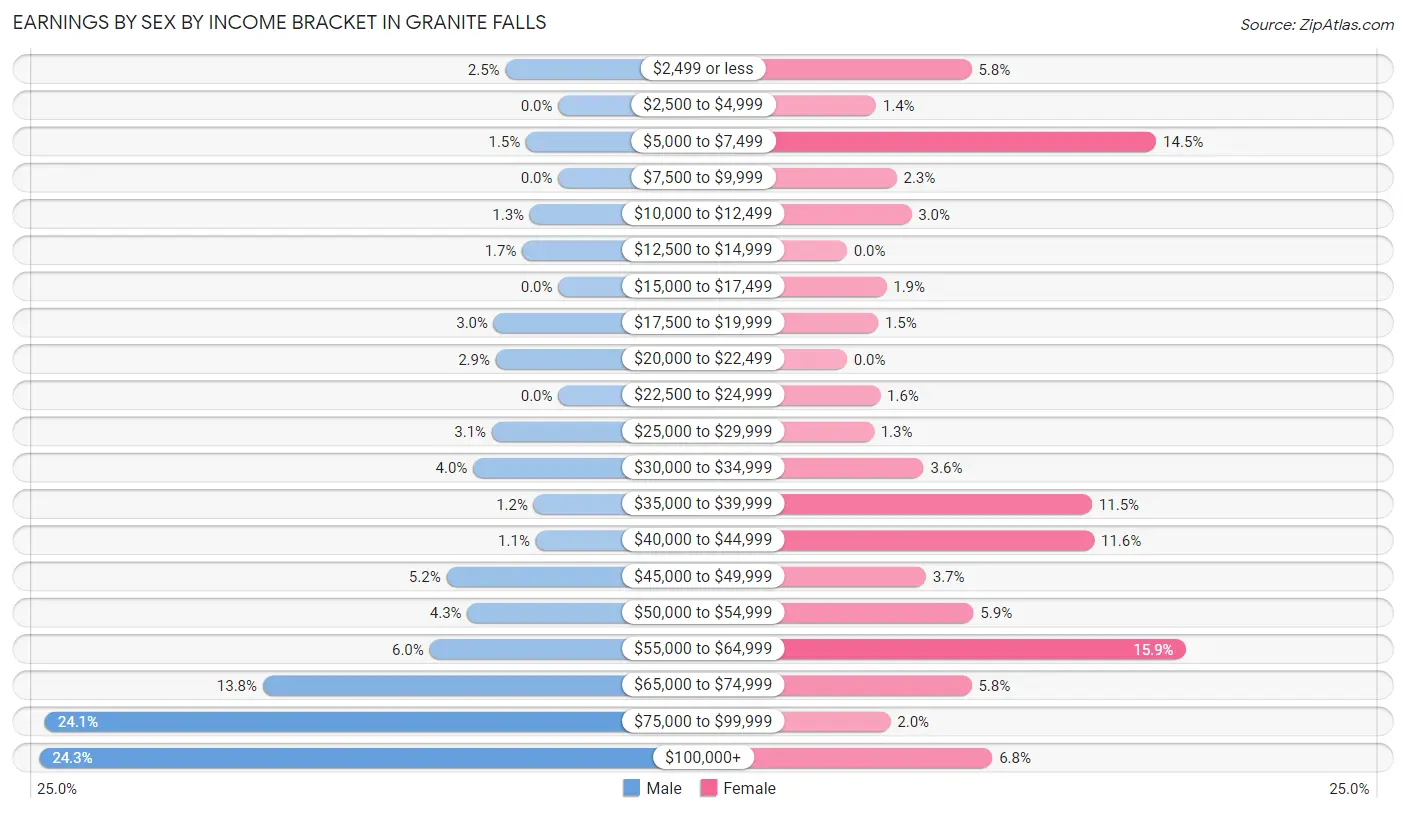
| Income | Male | Female |
| $2,499 or less | 28 (2.5%) | 60 (5.8%) |
| $2,500 to $4,999 | 0 (0.0%) | 14 (1.4%) |
| $5,000 to $7,499 | 17 (1.5%) | 149 (14.5%) |
| $7,500 to $9,999 | 0 (0.0%) | 24 (2.3%) |
| $10,000 to $12,499 | 15 (1.3%) | 31 (3.0%) |
| $12,500 to $14,999 | 19 (1.7%) | 0 (0.0%) |
| $15,000 to $17,499 | 0 (0.0%) | 19 (1.8%) |
| $17,500 to $19,999 | 34 (3.0%) | 15 (1.5%) |
| $20,000 to $22,499 | 33 (2.9%) | 0 (0.0%) |
| $22,500 to $24,999 | 0 (0.0%) | 16 (1.6%) |
| $25,000 to $29,999 | 35 (3.1%) | 13 (1.3%) |
| $30,000 to $34,999 | 45 (4.0%) | 37 (3.6%) |
| $35,000 to $39,999 | 13 (1.1%) | 118 (11.5%) |
| $40,000 to $44,999 | 12 (1.1%) | 119 (11.6%) |
| $45,000 to $49,999 | 59 (5.2%) | 38 (3.7%) |
| $50,000 to $54,999 | 48 (4.3%) | 61 (5.9%) |
| $55,000 to $64,999 | 68 (6.0%) | 163 (15.9%) |
| $65,000 to $74,999 | 156 (13.8%) | 60 (5.8%) |
| $75,000 to $99,999 | 271 (24.0%) | 21 (2.0%) |
| $100,000+ | 274 (24.3%) | 70 (6.8%) |
| Total | 1,127 (100.0%) | 1,028 (100.0%) |
Earnings by Sex by Educational Attainment in Granite Falls
Average earnings in Granite Falls are $81,964 for men and $43,103 for women, a difference of 47.4%. Men with an educational attainment of college or associate's degree enjoy the highest average annual earnings of $92,292, while those with less than high school education earn the least with $52,813. Women with an educational attainment of bachelor's degree earn the most with the average annual earnings of $44,063, while those with college or associate's degree education have the smallest earnings of $40,132.
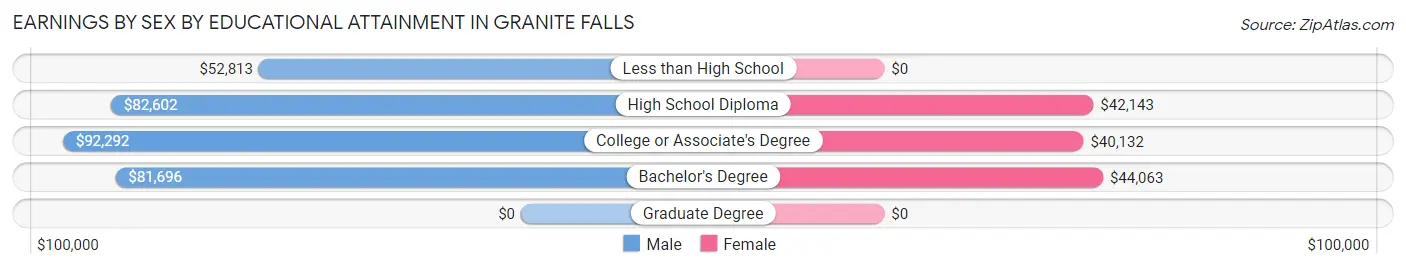
| Educational Attainment | Male Income | Female Income |
| Less than High School | $52,813 | $0 |
| High School Diploma | $82,602 | $42,143 |
| College or Associate's Degree | $92,292 | $40,132 |
| Bachelor's Degree | $81,696 | $44,063 |
| Graduate Degree | - | - |
| Total | $81,964 | $43,103 |
Family Income in Granite Falls
Family Income Brackets in Granite Falls
According to the Granite Falls family income data, there are 337 families falling into the $100,000 to $149,999 income range, which is the most common income bracket and makes up 31.0% of all families. Conversely, the $15,000 to $24,999 income bracket is the least frequent group with only 12 families (1.1%) belonging to this category.
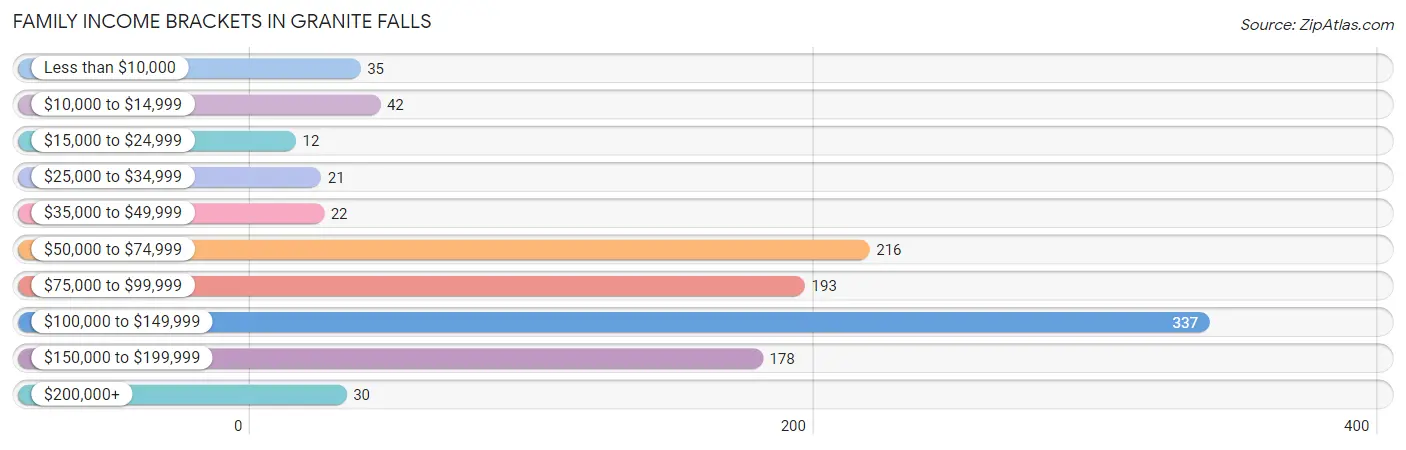
| Income Bracket | # Families | % Families |
| Less than $10,000 | 35 | 3.2% |
| $10,000 to $14,999 | 42 | 3.9% |
| $15,000 to $24,999 | 12 | 1.1% |
| $25,000 to $34,999 | 21 | 1.9% |
| $35,000 to $49,999 | 22 | 2.0% |
| $50,000 to $74,999 | 216 | 19.9% |
| $75,000 to $99,999 | 193 | 17.8% |
| $100,000 to $149,999 | 337 | 31.0% |
| $150,000 to $199,999 | 178 | 16.4% |
| $200,000+ | 30 | 2.8% |
Family Income by Famaliy Size in Granite Falls
6-person families (79 | 7.3%) account for the highest median family income in Granite Falls with $162,629 per family, while 2-person families (277 | 25.5%) have the highest median income of $36,467 per family member.
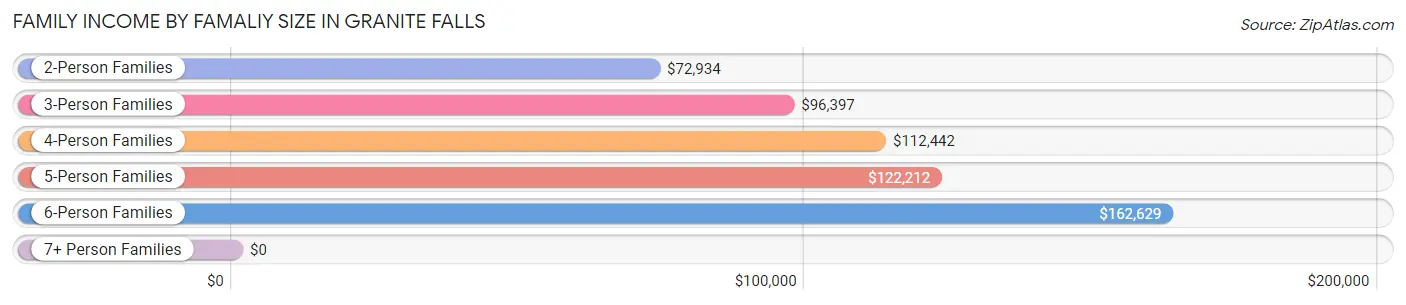
| Income Bracket | # Families | Median Income |
| 2-Person Families | 277 (25.5%) | $72,934 |
| 3-Person Families | 319 (29.4%) | $96,397 |
| 4-Person Families | 340 (31.3%) | $112,442 |
| 5-Person Families | 61 (5.6%) | $122,212 |
| 6-Person Families | 79 (7.3%) | $162,629 |
| 7+ Person Families | 10 (0.9%) | $0 |
| Total | 1,086 (100.0%) | $100,385 |
Family Income by Number of Earners in Granite Falls
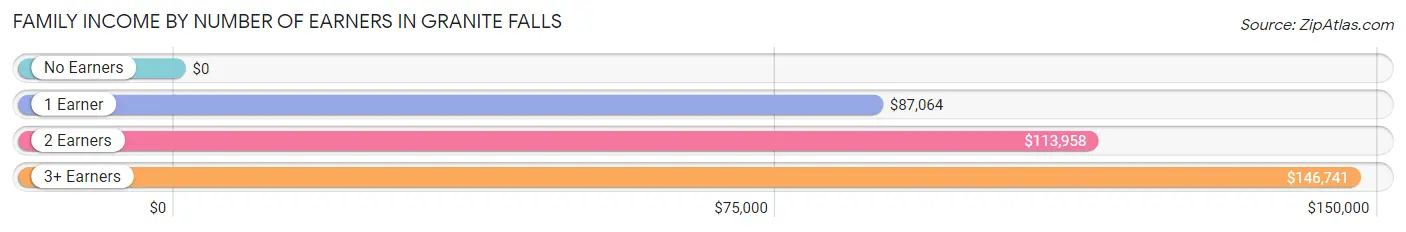
| Number of Earners | # Families | Median Income |
| No Earners | 206 (19.0%) | $0 |
| 1 Earner | 275 (25.3%) | $87,064 |
| 2 Earners | 474 (43.6%) | $113,958 |
| 3+ Earners | 131 (12.1%) | $146,741 |
| Total | 1,086 (100.0%) | $100,385 |
Household Income in Granite Falls
Household Income Brackets in Granite Falls
With 439 households falling in the category, the $100,000 to $149,999 income range is the most frequent in Granite Falls, accounting for 25.9% of all households. In contrast, only 46 households (2.7%) fall into the less than $10,000 income bracket, making it the least populous group.
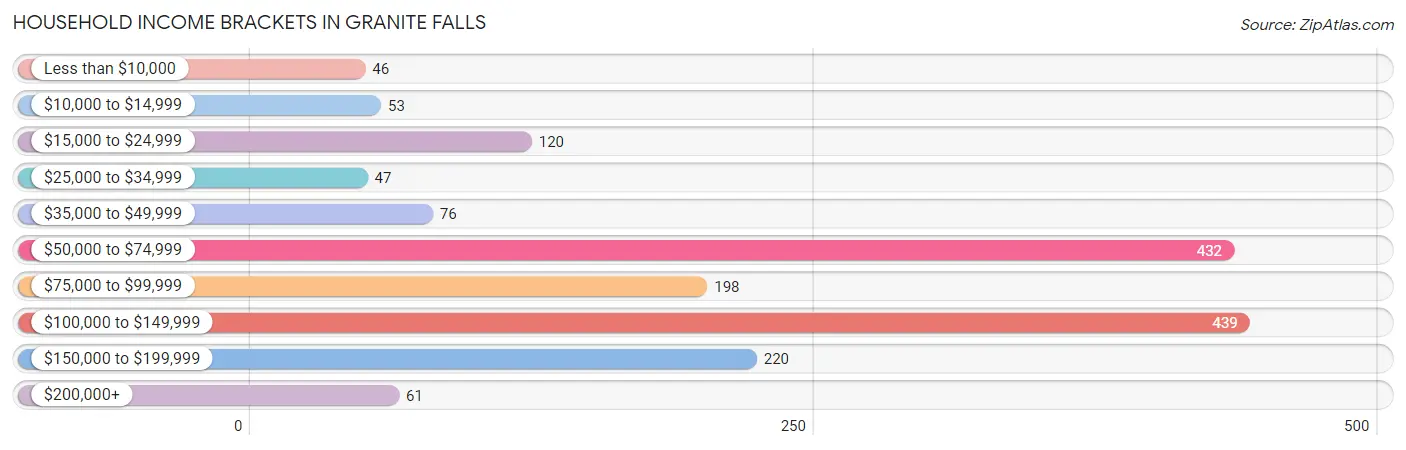
| Income Bracket | # Households | % Households |
| Less than $10,000 | 46 | 2.7% |
| $10,000 to $14,999 | 53 | 3.1% |
| $15,000 to $24,999 | 120 | 7.1% |
| $25,000 to $34,999 | 47 | 2.8% |
| $35,000 to $49,999 | 76 | 4.5% |
| $50,000 to $74,999 | 432 | 25.5% |
| $75,000 to $99,999 | 198 | 11.7% |
| $100,000 to $149,999 | 439 | 25.9% |
| $150,000 to $199,999 | 220 | 13.0% |
| $200,000+ | 61 | 3.6% |
Household Income by Householder Age in Granite Falls
The median household income in Granite Falls is $87,600, with the highest median household income of $107,422 found in the 25 to 44 years age bracket for the primary householder. A total of 715 households (42.2%) fall into this category. Meanwhile, the 65+ years age bracket for the primary householder has the lowest median household income of $0, with 347 households (20.5%) in this group.
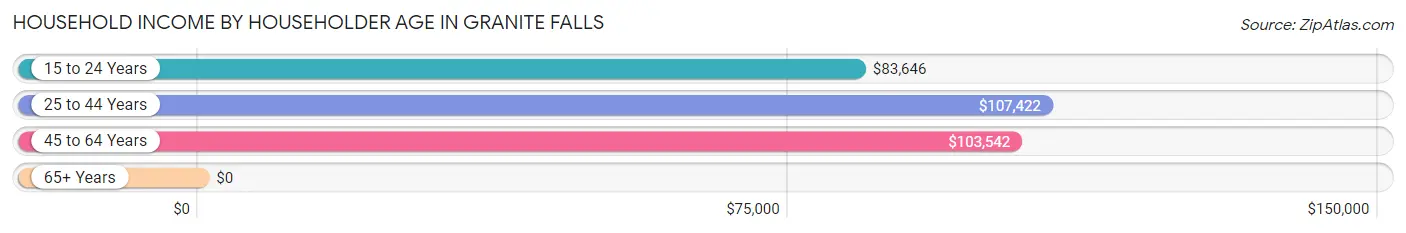
| Income Bracket | # Households | Median Income |
| 15 to 24 Years | 47 (2.8%) | $83,646 |
| 25 to 44 Years | 715 (42.2%) | $107,422 |
| 45 to 64 Years | 585 (34.5%) | $103,542 |
| 65+ Years | 347 (20.5%) | $0 |
| Total | 1,694 (100.0%) | $87,600 |
Poverty in Granite Falls
Income Below Poverty by Sex and Age in Granite Falls
With 5.4% poverty level for males and 9.9% for females among the residents of Granite Falls, 16 and 17 year old males and under 5 year old females are the most vulnerable to poverty, with 12 males (34.3%) and 70 females (38.9%) in their respective age groups living below the poverty level.
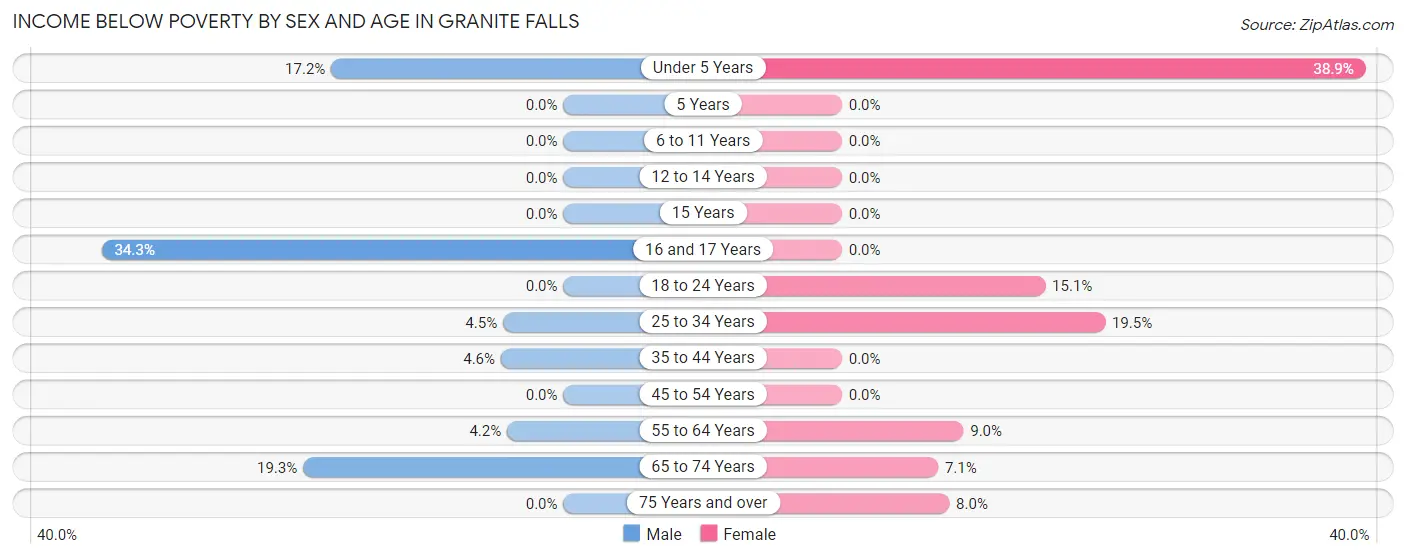
| Age Bracket | Male | Female |
| Under 5 Years | 35 (17.2%) | 70 (38.9%) |
| 5 Years | 0 (0.0%) | 0 (0.0%) |
| 6 to 11 Years | 0 (0.0%) | 0 (0.0%) |
| 12 to 14 Years | 0 (0.0%) | 0 (0.0%) |
| 15 Years | 0 (0.0%) | 0 (0.0%) |
| 16 and 17 Years | 12 (34.3%) | 0 (0.0%) |
| 18 to 24 Years | 0 (0.0%) | 29 (15.1%) |
| 25 to 34 Years | 15 (4.5%) | 93 (19.5%) |
| 35 to 44 Years | 16 (4.6%) | 0 (0.0%) |
| 45 to 54 Years | 0 (0.0%) | 0 (0.0%) |
| 55 to 64 Years | 14 (4.2%) | 23 (9.0%) |
| 65 to 74 Years | 23 (19.3%) | 11 (7.1%) |
| 75 Years and over | 0 (0.0%) | 11 (8.0%) |
| Total | 115 (5.4%) | 237 (9.9%) |
Income Above Poverty by Sex and Age in Granite Falls
According to the poverty statistics in Granite Falls, males aged 5 years and females aged 5 years are the age groups that are most secure financially, with 100.0% of males and 100.0% of females in these age groups living above the poverty line.
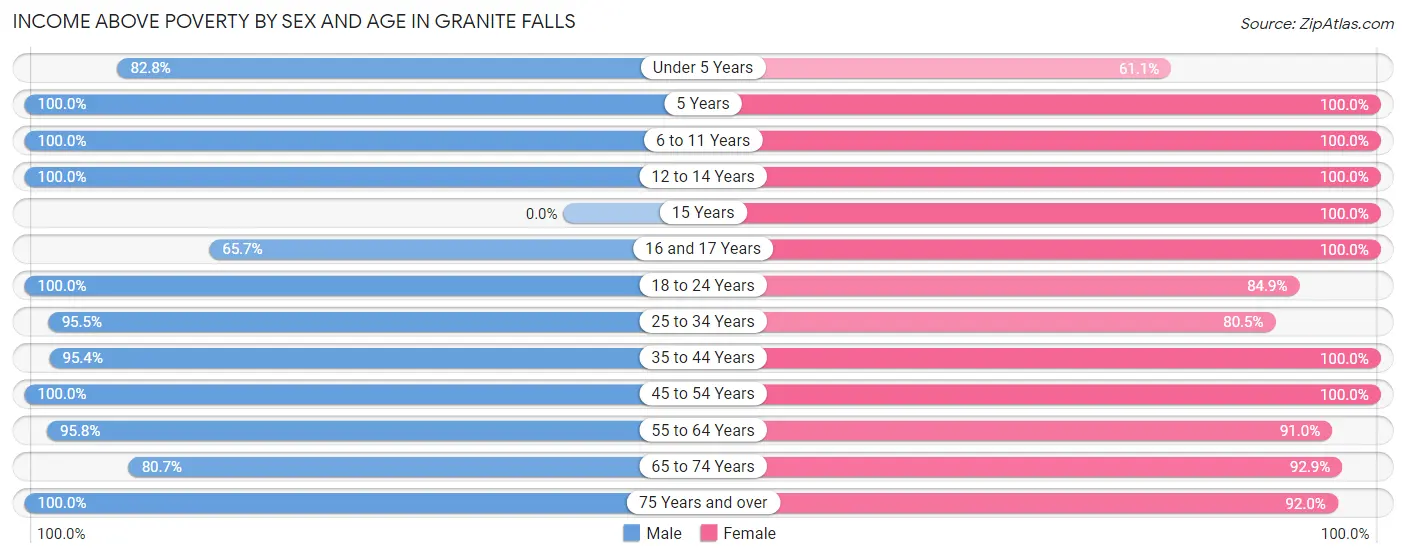
| Age Bracket | Male | Female |
| Under 5 Years | 168 (82.8%) | 110 (61.1%) |
| 5 Years | 16 (100.0%) | 31 (100.0%) |
| 6 to 11 Years | 213 (100.0%) | 253 (100.0%) |
| 12 to 14 Years | 132 (100.0%) | 134 (100.0%) |
| 15 Years | 0 (0.0%) | 16 (100.0%) |
| 16 and 17 Years | 23 (65.7%) | 56 (100.0%) |
| 18 to 24 Years | 113 (100.0%) | 163 (84.9%) |
| 25 to 34 Years | 320 (95.5%) | 383 (80.5%) |
| 35 to 44 Years | 329 (95.4%) | 311 (100.0%) |
| 45 to 54 Years | 218 (100.0%) | 189 (100.0%) |
| 55 to 64 Years | 321 (95.8%) | 232 (91.0%) |
| 65 to 74 Years | 96 (80.7%) | 143 (92.9%) |
| 75 Years and over | 68 (100.0%) | 127 (92.0%) |
| Total | 2,017 (94.6%) | 2,148 (90.1%) |
Income Below Poverty Among Married-Couple Families in Granite Falls
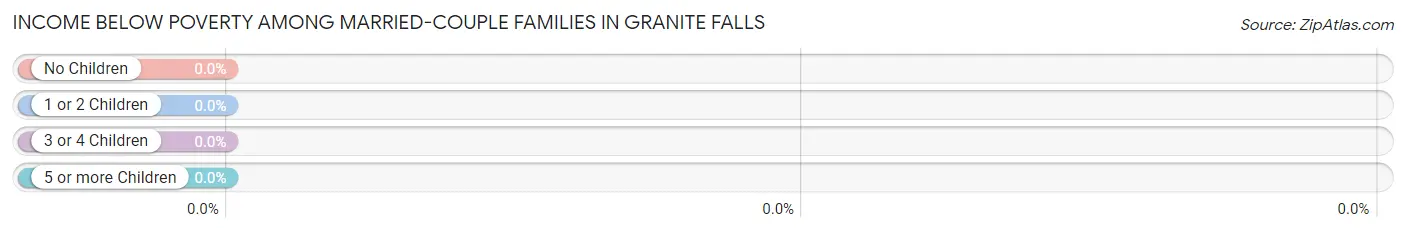
| Children | Above Poverty | Below Poverty |
| No Children | 394 (100.0%) | 0 (0.0%) |
| 1 or 2 Children | 368 (100.0%) | 0 (0.0%) |
| 3 or 4 Children | 81 (100.0%) | 0 (0.0%) |
| 5 or more Children | 10 (100.0%) | 0 (0.0%) |
| Total | 853 (100.0%) | 0 (0.0%) |
Income Below Poverty Among Single-Parent Households in Granite Falls
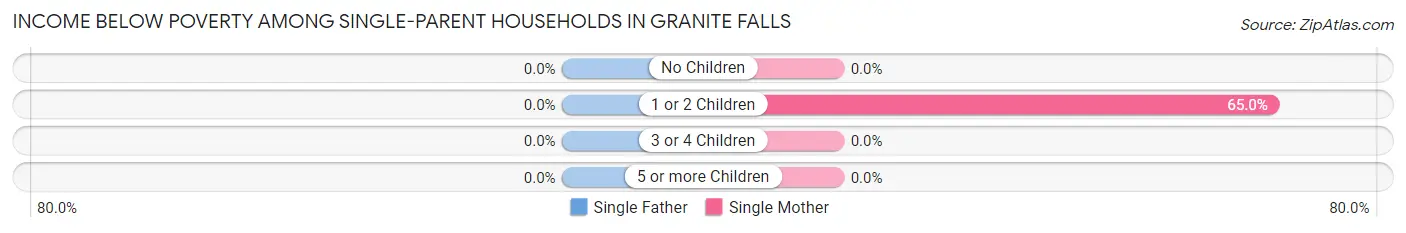
| Children | Single Father | Single Mother |
| No Children | 0 (0.0%) | 0 (0.0%) |
| 1 or 2 Children | 0 (0.0%) | 89 (65.0%) |
| 3 or 4 Children | 0 (0.0%) | 0 (0.0%) |
| 5 or more Children | 0 (0.0%) | 0 (0.0%) |
| Total | 0 (0.0%) | 89 (61.0%) |
Income Below Poverty Among Married-Couple vs Single-Parent Households in Granite Falls
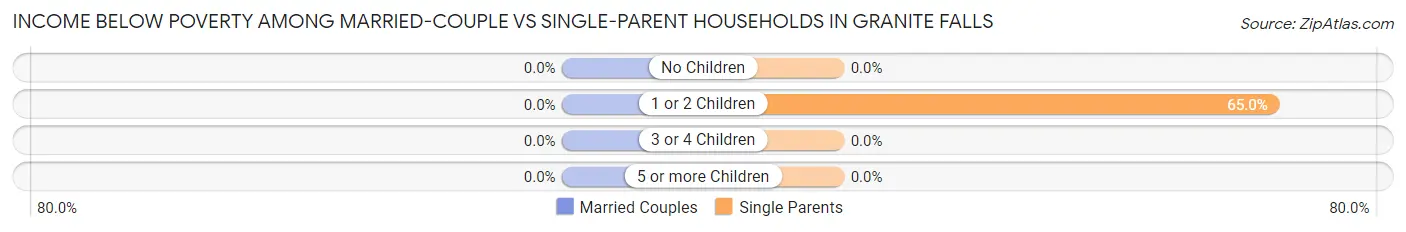
| Children | Married-Couple Families | Single-Parent Households |
| No Children | 0 (0.0%) | 0 (0.0%) |
| 1 or 2 Children | 0 (0.0%) | 89 (65.0%) |
| 3 or 4 Children | 0 (0.0%) | 0 (0.0%) |
| 5 or more Children | 0 (0.0%) | 0 (0.0%) |
| Total | 0 (0.0%) | 89 (38.2%) |
Race in Granite Falls
The most populous races in Granite Falls are White / Caucasian (3,726 | 81.6%), Two or more Races (545 | 11.9%), and Hispanic or Latino (204 | 4.5%).
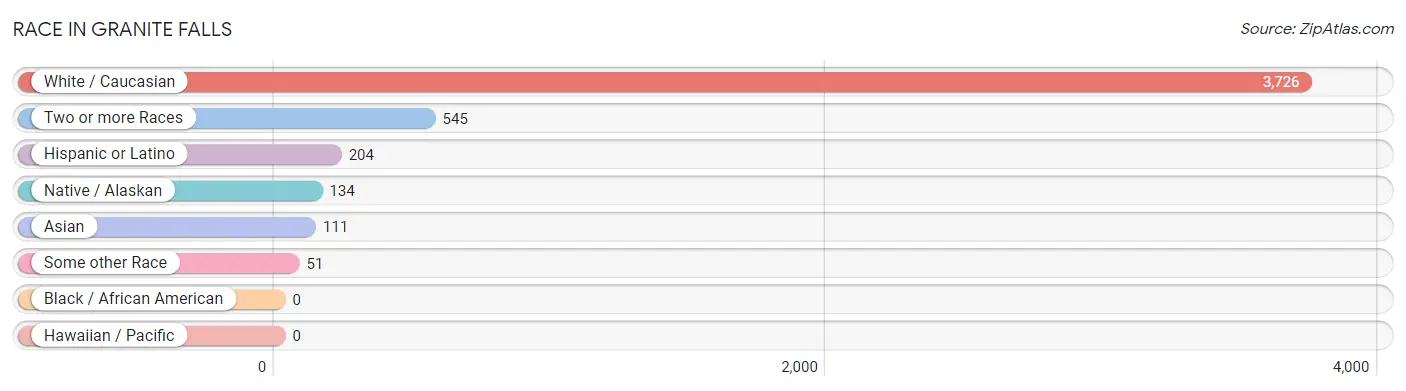
| Race | # Population | % Population |
| Asian | 111 | 2.4% |
| Black / African American | 0 | 0.0% |
| Hawaiian / Pacific | 0 | 0.0% |
| Hispanic or Latino | 204 | 4.5% |
| Native / Alaskan | 134 | 2.9% |
| White / Caucasian | 3,726 | 81.6% |
| Two or more Races | 545 | 11.9% |
| Some other Race | 51 | 1.1% |
| Total | 4,567 | 100.0% |
Ancestry in Granite Falls
The most populous ancestries reported in Granite Falls are German (913 | 20.0%), English (810 | 17.7%), Irish (779 | 17.1%), Norwegian (382 | 8.4%), and Scottish (357 | 7.8%), together accounting for 71.0% of all Granite Falls residents.
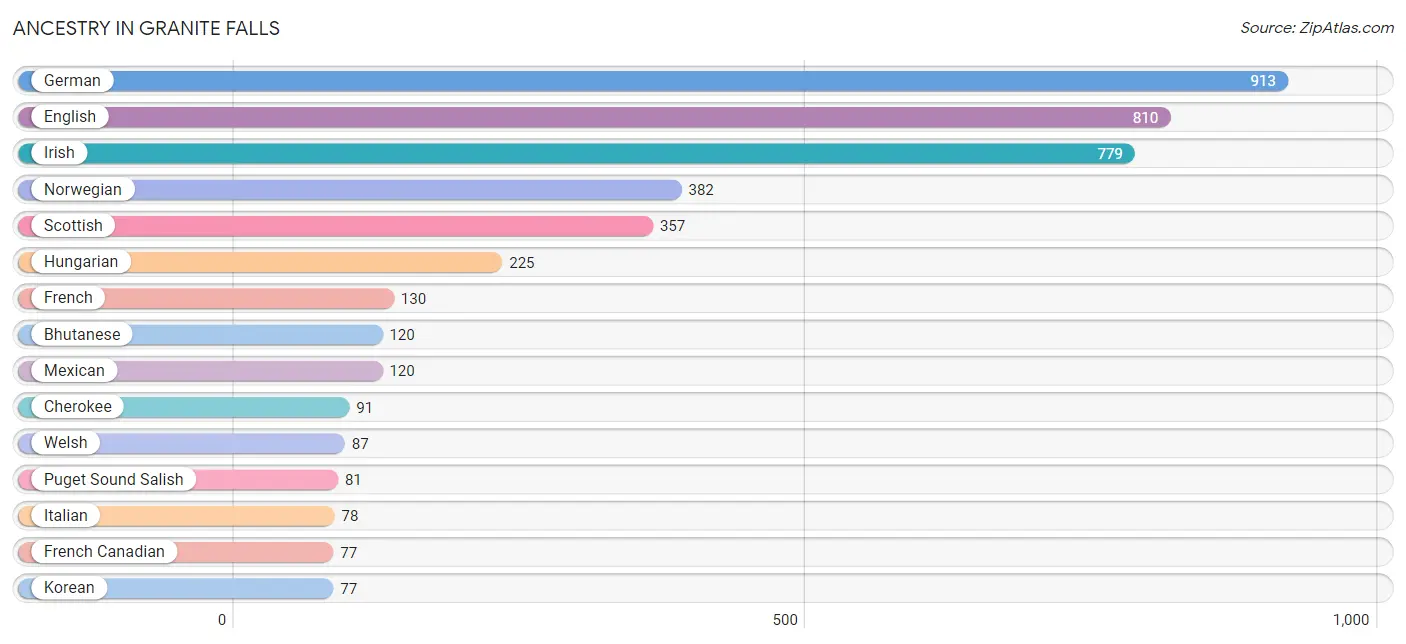
| Ancestry | # Population | % Population |
| American | 31 | 0.7% |
| Bhutanese | 120 | 2.6% |
| British | 30 | 0.7% |
| Cambodian | 39 | 0.9% |
| Cherokee | 91 | 2.0% |
| Croatian | 35 | 0.8% |
| Dutch | 23 | 0.5% |
| English | 810 | 17.7% |
| European | 53 | 1.2% |
| French | 130 | 2.9% |
| French Canadian | 77 | 1.7% |
| German | 913 | 20.0% |
| Greek | 27 | 0.6% |
| Hungarian | 225 | 4.9% |
| Indian (Asian) | 20 | 0.4% |
| Irish | 779 | 17.1% |
| Italian | 78 | 1.7% |
| Korean | 77 | 1.7% |
| Mexican | 120 | 2.6% |
| Norwegian | 382 | 8.4% |
| Polish | 31 | 0.7% |
| Portuguese | 16 | 0.4% |
| Puget Sound Salish | 81 | 1.8% |
| Russian | 9 | 0.2% |
| Scandinavian | 36 | 0.8% |
| Scottish | 357 | 7.8% |
| Spanish | 19 | 0.4% |
| Swedish | 54 | 1.2% |
| Swiss | 60 | 1.3% |
| Welsh | 87 | 1.9% | View All 30 Rows |
Immigrants in Granite Falls
The most numerous immigrant groups reported in Granite Falls came from Asia (111 | 2.4%), Philippines (65 | 1.4%), South Eastern Asia (65 | 1.4%), Eastern Asia (46 | 1.0%), and England (31 | 0.7%), together accounting for 7.0% of all Granite Falls residents.
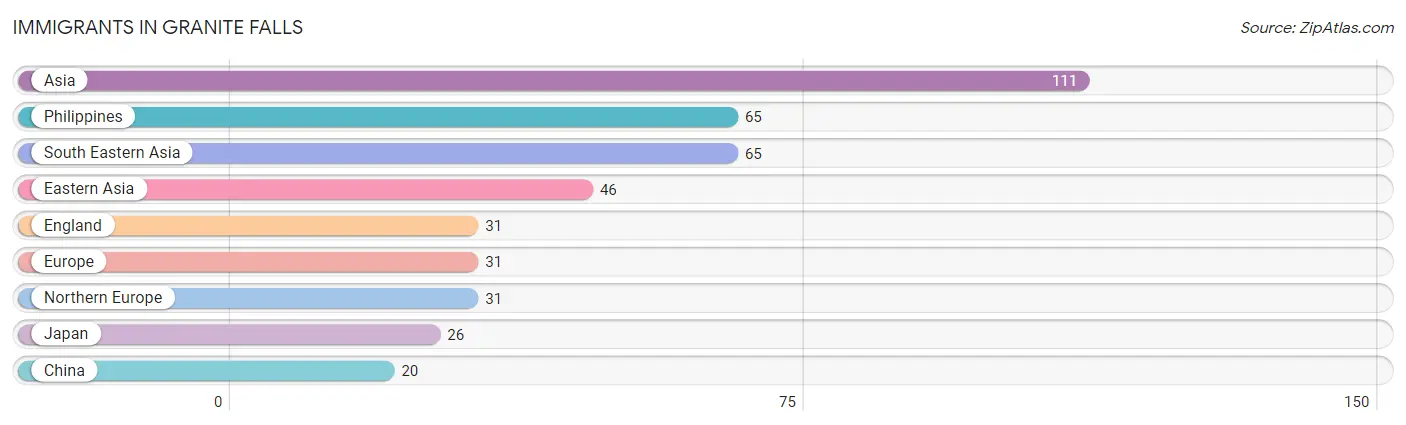
| Immigration Origin | # Population | % Population |
| Asia | 111 | 2.4% |
| China | 20 | 0.4% |
| Eastern Asia | 46 | 1.0% |
| England | 31 | 0.7% |
| Europe | 31 | 0.7% |
| Japan | 26 | 0.6% |
| Northern Europe | 31 | 0.7% |
| Philippines | 65 | 1.4% |
| South Eastern Asia | 65 | 1.4% | View All 9 Rows |
Sex and Age in Granite Falls
Sex and Age in Granite Falls
The most populous age groups in Granite Falls are Under 5 Years (241 | 11.1%) for men and 30 to 34 Years (319 | 13.3%) for women.
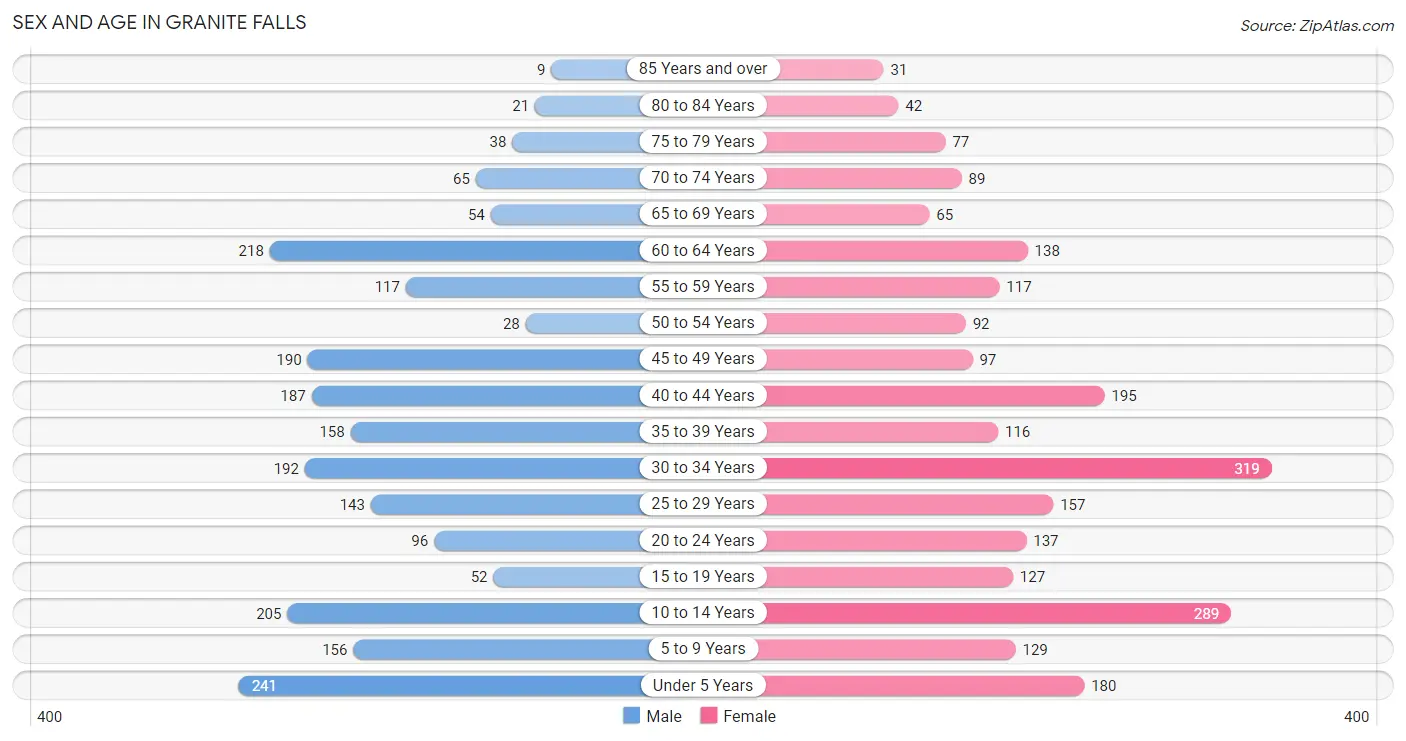
| Age Bracket | Male | Female |
| Under 5 Years | 241 (11.1%) | 180 (7.5%) |
| 5 to 9 Years | 156 (7.2%) | 129 (5.4%) |
| 10 to 14 Years | 205 (9.5%) | 289 (12.1%) |
| 15 to 19 Years | 52 (2.4%) | 127 (5.3%) |
| 20 to 24 Years | 96 (4.4%) | 137 (5.7%) |
| 25 to 29 Years | 143 (6.6%) | 157 (6.6%) |
| 30 to 34 Years | 192 (8.8%) | 319 (13.3%) |
| 35 to 39 Years | 158 (7.3%) | 116 (4.8%) |
| 40 to 44 Years | 187 (8.6%) | 195 (8.1%) |
| 45 to 49 Years | 190 (8.8%) | 97 (4.1%) |
| 50 to 54 Years | 28 (1.3%) | 92 (3.8%) |
| 55 to 59 Years | 117 (5.4%) | 117 (4.9%) |
| 60 to 64 Years | 218 (10.1%) | 138 (5.8%) |
| 65 to 69 Years | 54 (2.5%) | 65 (2.7%) |
| 70 to 74 Years | 65 (3.0%) | 89 (3.7%) |
| 75 to 79 Years | 38 (1.8%) | 77 (3.2%) |
| 80 to 84 Years | 21 (1.0%) | 42 (1.8%) |
| 85 Years and over | 9 (0.4%) | 31 (1.3%) |
| Total | 2,170 (100.0%) | 2,397 (100.0%) |
Families and Households in Granite Falls
Median Family Size in Granite Falls
The median family size in Granite Falls is 3.38 persons per family, with single male/father families (87 | 8.0%) accounting for the largest median family size of 4.24 persons per family. On the other hand, single female/mother families (146 | 13.4%) represent the smallest median family size with 2.45 persons per family.
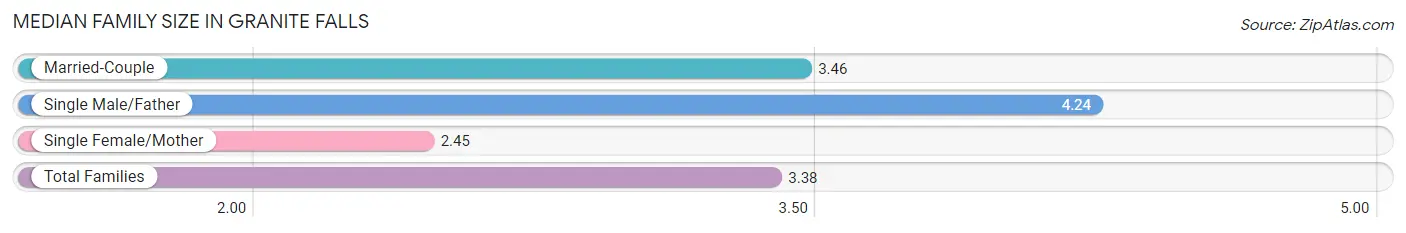
| Family Type | # Families | Family Size |
| Married-Couple | 853 (78.5%) | 3.46 |
| Single Male/Father | 87 (8.0%) | 4.24 |
| Single Female/Mother | 146 (13.4%) | 2.45 |
| Total Families | 1,086 (100.0%) | 3.38 |
Median Household Size in Granite Falls
The median household size in Granite Falls is 2.69 persons per household, with single male/father households (87 | 5.1%) accounting for the largest median household size of 4.43 persons per household. non-family households (608 | 35.9%) represent the smallest median household size with 1.19 persons per household.
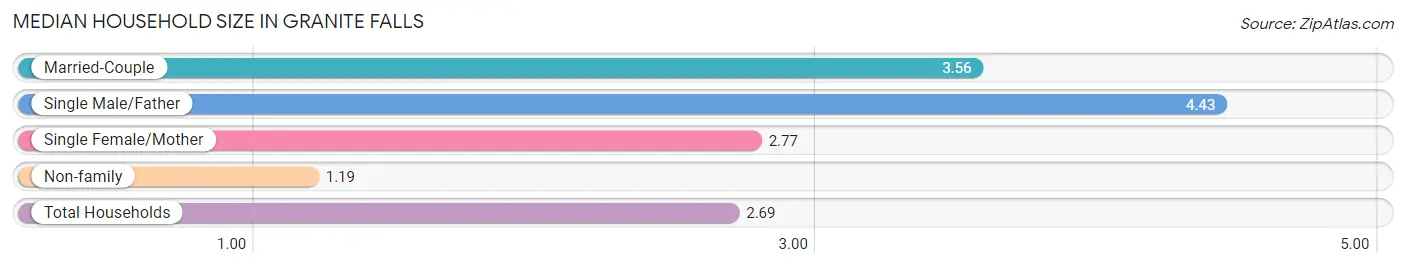
| Household Type | # Households | Household Size |
| Married-Couple | 853 (50.3%) | 3.56 |
| Single Male/Father | 87 (5.1%) | 4.43 |
| Single Female/Mother | 146 (8.6%) | 2.77 |
| Non-family | 608 (35.9%) | 1.19 |
| Total Households | 1,694 (100.0%) | 2.69 |
Household Size by Marriage Status in Granite Falls
Out of a total of 1,694 households in Granite Falls, 1,086 (64.1%) are family households, while 608 (35.9%) are nonfamily households. The most numerous type of family households are 4-person households, comprising 424, and the most common type of nonfamily households are 1-person households, comprising 527.
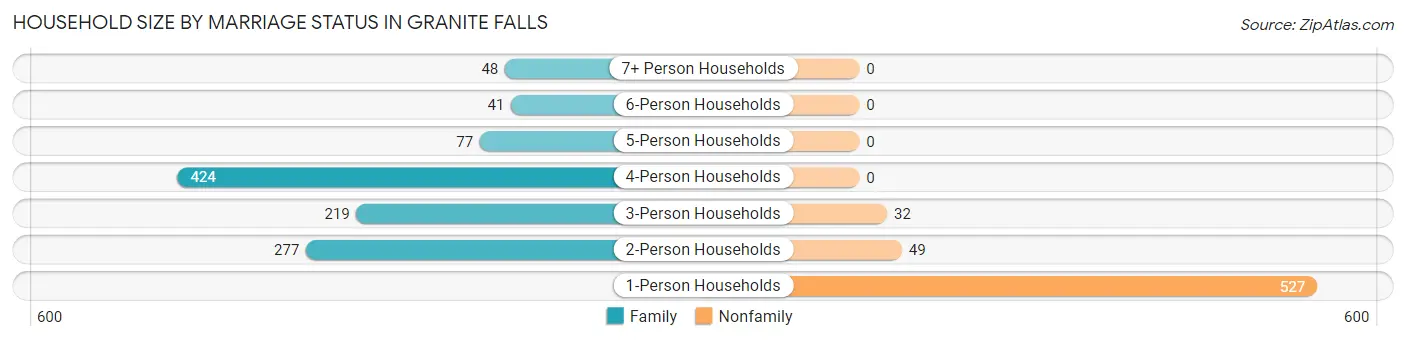
| Household Size | Family Households | Nonfamily Households |
| 1-Person Households | - | 527 (31.1%) |
| 2-Person Households | 277 (16.4%) | 49 (2.9%) |
| 3-Person Households | 219 (12.9%) | 32 (1.9%) |
| 4-Person Households | 424 (25.0%) | 0 (0.0%) |
| 5-Person Households | 77 (4.5%) | 0 (0.0%) |
| 6-Person Households | 41 (2.4%) | 0 (0.0%) |
| 7+ Person Households | 48 (2.8%) | 0 (0.0%) |
| Total | 1,086 (64.1%) | 608 (35.9%) |
Female Fertility in Granite Falls
Fertility by Age in Granite Falls
Average fertility rate in Granite Falls is 81.0 births per 1,000 women. Women in the age bracket of 20 to 34 years have the highest fertility rate with 158.0 births per 1,000 women. Women in the age bracket of 20 to 34 years acount for 100.0% of all women with births.
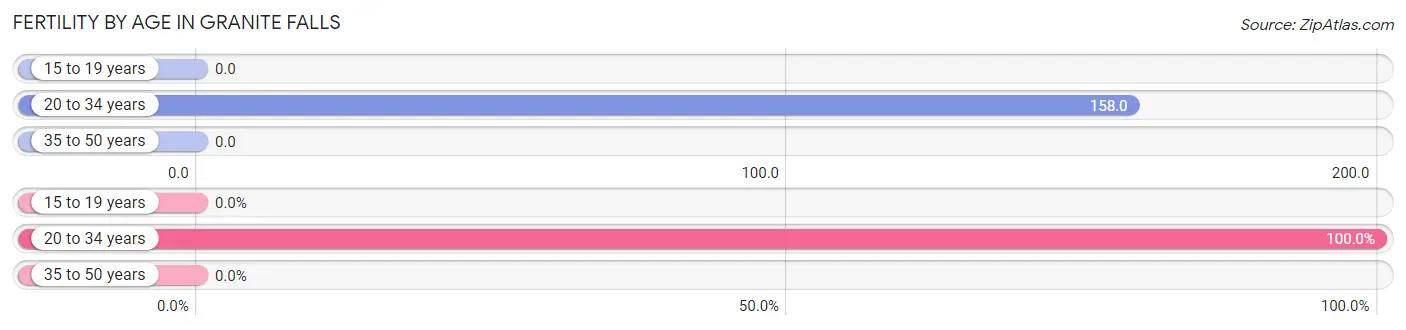
| Age Bracket | Women with Births | Births / 1,000 Women |
| 15 to 19 years | 0 (0.0%) | 0.0 |
| 20 to 34 years | 97 (100.0%) | 158.0 |
| 35 to 50 years | 0 (0.0%) | 0.0 |
| Total | 97 (100.0%) | 81.0 |
Fertility by Age by Marriage Status in Granite Falls
47.4% of women with births (97) in Granite Falls are married. The highest percentage of unmarried women with births falls into 20 to 34 years age bracket with 52.6% of them unmarried at the time of birth, while the lowest percentage of unmarried women with births belong to 20 to 34 years age bracket with 52.6% of them unmarried.
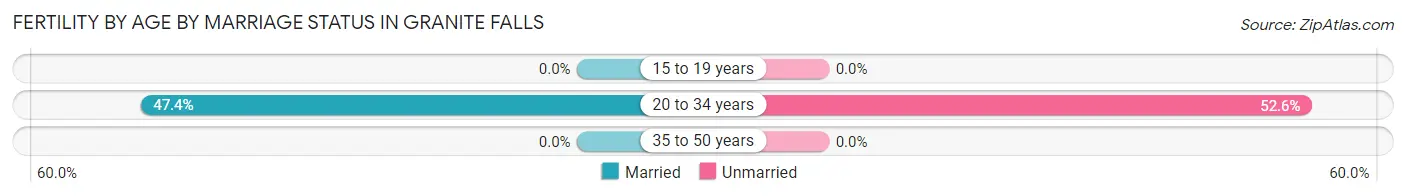
| Age Bracket | Married | Unmarried |
| 15 to 19 years | 0 (0.0%) | 0 (0.0%) |
| 20 to 34 years | 46 (47.4%) | 51 (52.6%) |
| 35 to 50 years | 0 (0.0%) | 0 (0.0%) |
| Total | 46 (47.4%) | 51 (52.6%) |
Fertility by Education in Granite Falls
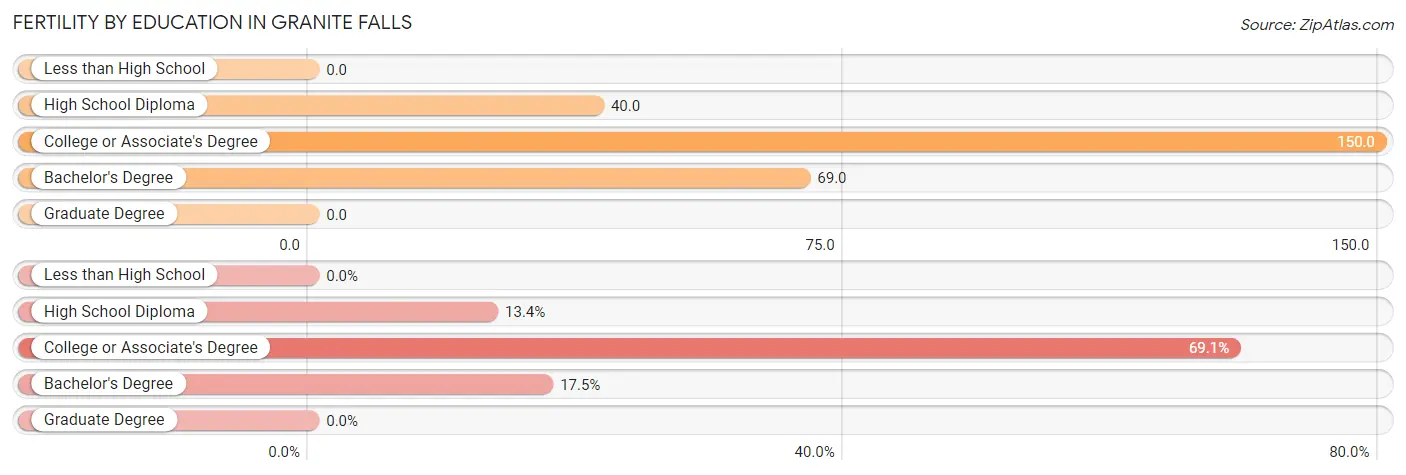
| Educational Attainment | Women with Births | Births / 1,000 Women |
| Less than High School | 0 (0.0%) | 0.0 |
| High School Diploma | 13 (13.4%) | 40.0 |
| College or Associate's Degree | 67 (69.1%) | 150.0 |
| Bachelor's Degree | 17 (17.5%) | 69.0 |
| Graduate Degree | 0 (0.0%) | 0.0 |
| Total | 97 (100.0%) | 81.0 |
Fertility by Education by Marriage Status in Granite Falls
52.6% of women with births in Granite Falls are unmarried. Women with the educational attainment of high school diploma are most likely to be married with 100.0% of them married at childbirth, while women with the educational attainment of college or associate's degree are least likely to be married with 76.1% of them unmarried at childbirth.
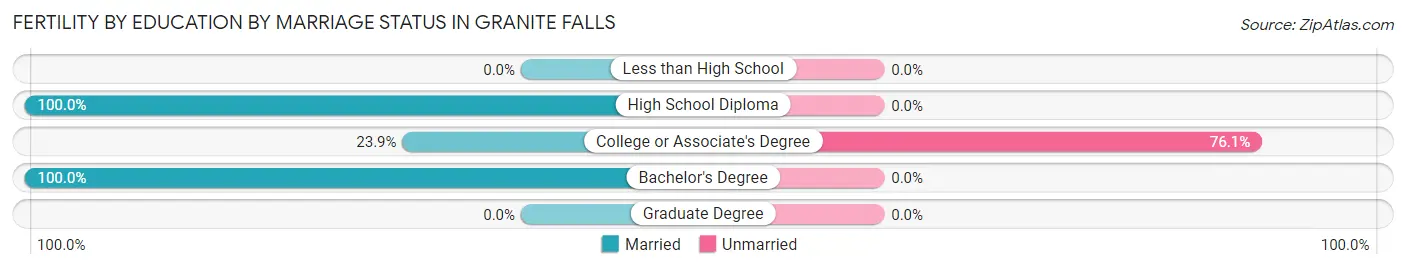
| Educational Attainment | Married | Unmarried |
| Less than High School | 0 (0.0%) | 0 (0.0%) |
| High School Diploma | 13 (100.0%) | 0 (0.0%) |
| College or Associate's Degree | 16 (23.9%) | 51 (76.1%) |
| Bachelor's Degree | 17 (100.0%) | 0 (0.0%) |
| Graduate Degree | 0 (0.0%) | 0 (0.0%) |
| Total | 46 (47.4%) | 51 (52.6%) |
Employment Characteristics in Granite Falls
Employment by Class of Employer in Granite Falls
Among the 2,054 employed individuals in Granite Falls, private company employees (1,346 | 65.5%), local government employees (180 | 8.8%), and self-employed (incorporated) (172 | 8.4%) make up the most common classes of employment.
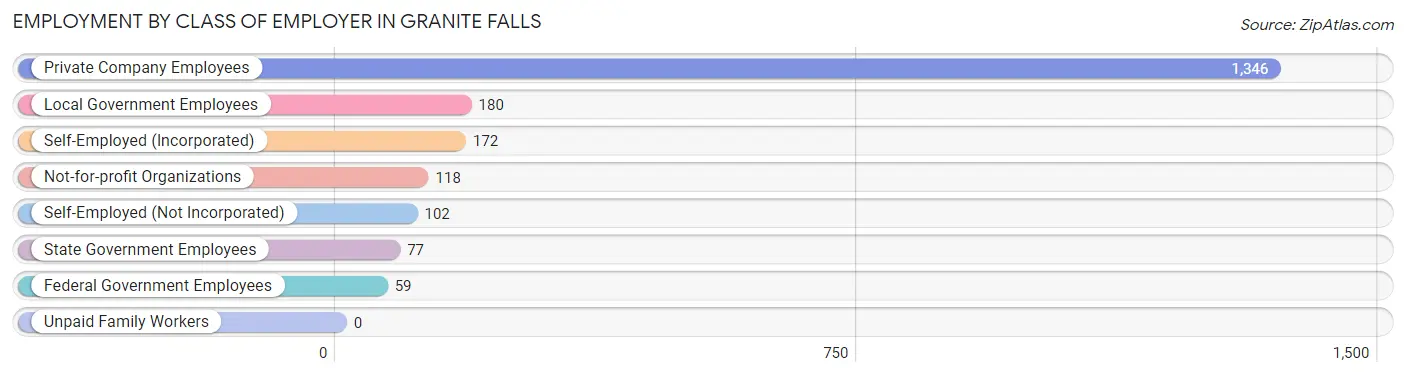
| Employer Class | # Employees | % Employees |
| Private Company Employees | 1,346 | 65.5% |
| Self-Employed (Incorporated) | 172 | 8.4% |
| Self-Employed (Not Incorporated) | 102 | 5.0% |
| Not-for-profit Organizations | 118 | 5.7% |
| Local Government Employees | 180 | 8.8% |
| State Government Employees | 77 | 3.7% |
| Federal Government Employees | 59 | 2.9% |
| Unpaid Family Workers | 0 | 0.0% |
| Total | 2,054 | 100.0% |
Employment Status by Age in Granite Falls
According to the labor force statistics for Granite Falls, out of the total population over 16 years of age (3,351), 63.4% or 2,125 individuals are in the labor force, with 1.0% or 21 of them unemployed. The age group with the highest labor force participation rate is 55 to 59 years, with 96.2% or 225 individuals in the labor force. Within the labor force, the 55 to 59 years age range has the highest percentage of unemployed individuals, with 8.9% or 20 of them being unemployed.
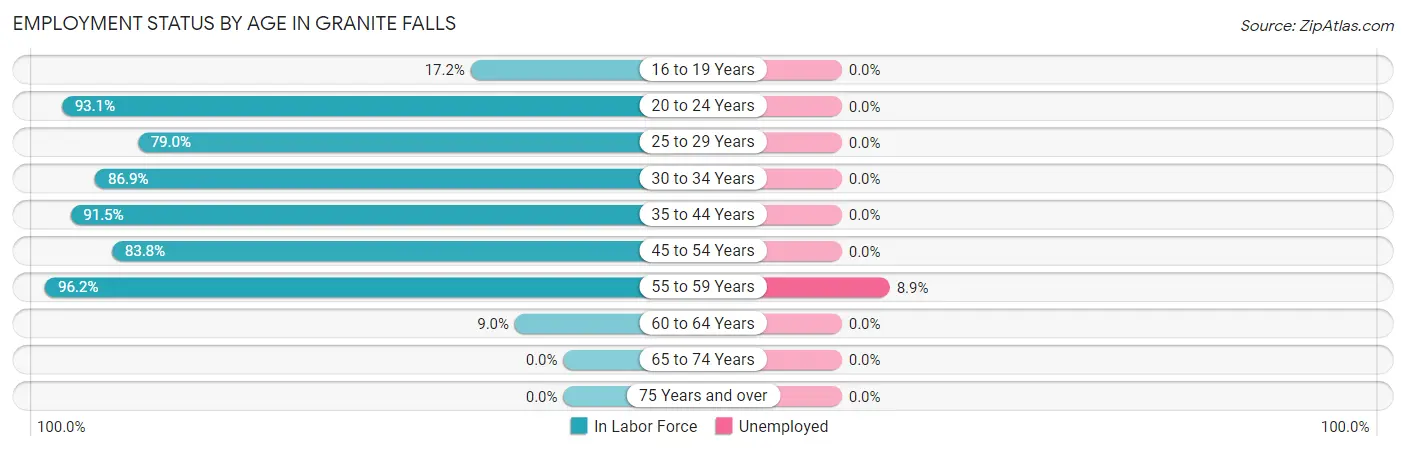
| Age Bracket | In Labor Force | Unemployed |
| 16 to 19 Years | 28 (17.2%) | 0 (0.0%) |
| 20 to 24 Years | 217 (93.1%) | 0 (0.0%) |
| 25 to 29 Years | 237 (79.0%) | 0 (0.0%) |
| 30 to 34 Years | 444 (86.9%) | 0 (0.0%) |
| 35 to 44 Years | 600 (91.5%) | 0 (0.0%) |
| 45 to 54 Years | 341 (83.8%) | 0 (0.0%) |
| 55 to 59 Years | 225 (96.2%) | 20 (8.9%) |
| 60 to 64 Years | 32 (9.0%) | 0 (0.0%) |
| 65 to 74 Years | 0 (0.0%) | 0 (0.0%) |
| 75 Years and over | 0 (0.0%) | 0 (0.0%) |
| Total | 2,125 (63.4%) | 21 (1.0%) |
Employment Status by Educational Attainment in Granite Falls
According to labor force statistics for Granite Falls, 76.3% of individuals (1,880) out of the total population between 25 and 64 years of age (2,464) are in the labor force, with 1.1% or 21 of them being unemployed. The group with the highest labor force participation rate are those with the educational attainment of high school diploma, with 79.6% or 693 individuals in the labor force. Within the labor force, individuals with college / associate degree education have the highest percentage of unemployment, with 2.8% or 20 of them being unemployed.
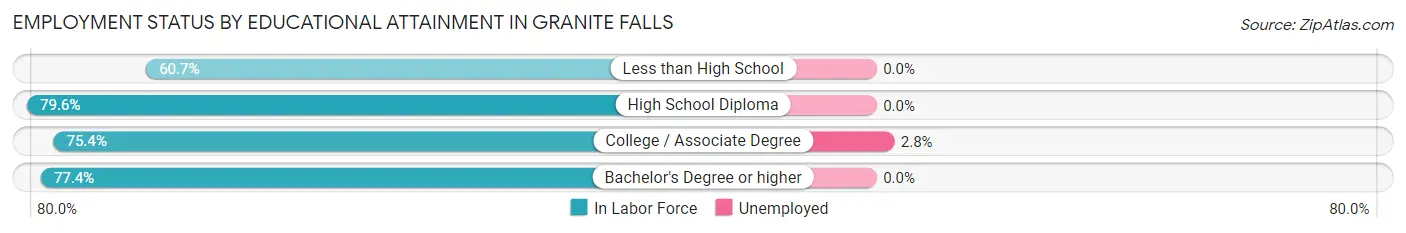
| Educational Attainment | In Labor Force | Unemployed |
| Less than High School | 102 (60.7%) | 0 (0.0%) |
| High School Diploma | 693 (79.6%) | 0 (0.0%) |
| College / Associate Degree | 724 (75.4%) | 27 (2.8%) |
| Bachelor's Degree or higher | 360 (77.4%) | 0 (0.0%) |
| Total | 1,880 (76.3%) | 27 (1.1%) |
Employment Occupations by Sex in Granite Falls
Management, Business, Science and Arts Occupations
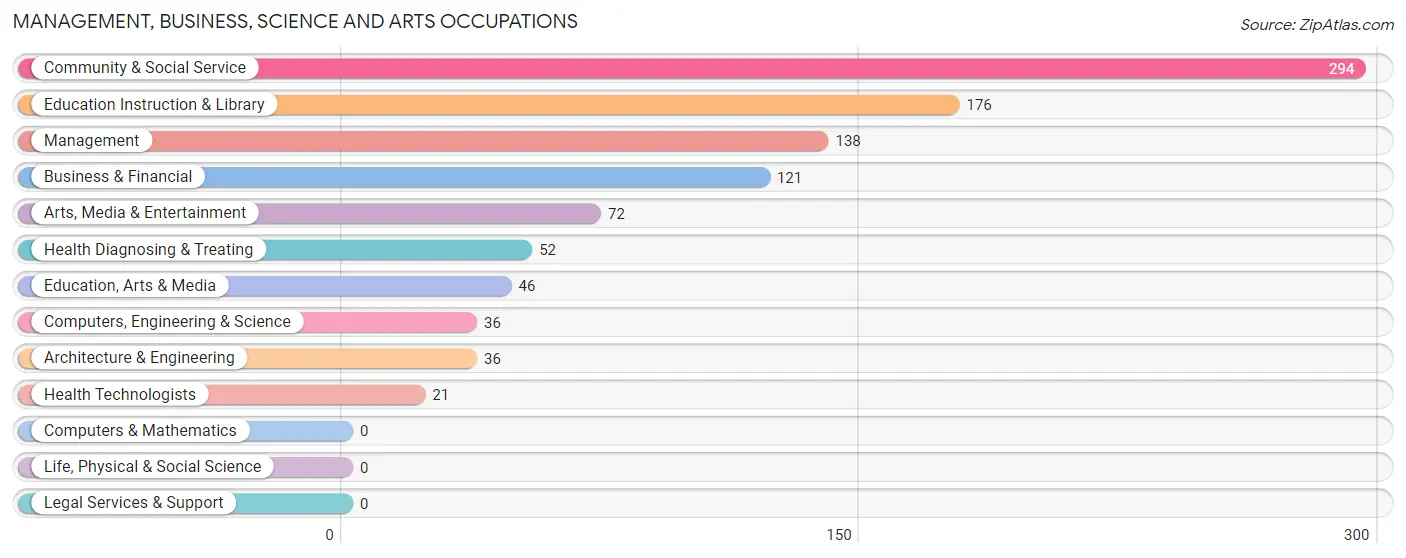
The most common Management, Business, Science and Arts occupations in Granite Falls are Community & Social Service (294 | 14.2%), Education Instruction & Library (176 | 8.5%), Management (138 | 6.7%), Business & Financial (121 | 5.9%), and Arts, Media & Entertainment (72 | 3.5%).
Management, Business, Science and Arts Occupations by Sex
Within the Management, Business, Science and Arts occupations in Granite Falls, the most male-oriented occupations are Management (81.9%), Computers, Engineering & Science (75.0%), and Architecture & Engineering (75.0%), while the most female-oriented occupations are Education, Arts & Media (100.0%), Health Technologists (100.0%), and Business & Financial (90.1%).
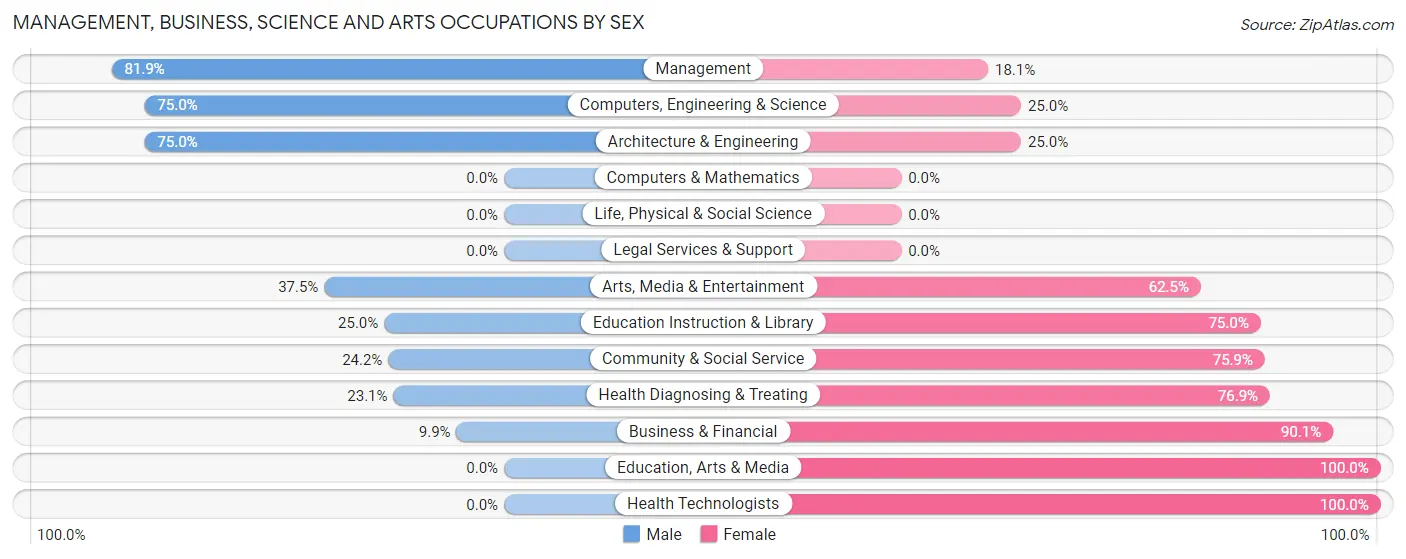
| Occupation | Male | Female |
| Management | 113 (81.9%) | 25 (18.1%) |
| Business & Financial | 12 (9.9%) | 109 (90.1%) |
| Computers, Engineering & Science | 27 (75.0%) | 9 (25.0%) |
| Computers & Mathematics | 0 (0.0%) | 0 (0.0%) |
| Architecture & Engineering | 27 (75.0%) | 9 (25.0%) |
| Life, Physical & Social Science | 0 (0.0%) | 0 (0.0%) |
| Community & Social Service | 71 (24.1%) | 223 (75.8%) |
| Education, Arts & Media | 0 (0.0%) | 46 (100.0%) |
| Legal Services & Support | 0 (0.0%) | 0 (0.0%) |
| Education Instruction & Library | 44 (25.0%) | 132 (75.0%) |
| Arts, Media & Entertainment | 27 (37.5%) | 45 (62.5%) |
| Health Diagnosing & Treating | 12 (23.1%) | 40 (76.9%) |
| Health Technologists | 0 (0.0%) | 21 (100.0%) |
| Total (Category) | 235 (36.7%) | 406 (63.3%) |
| Total (Overall) | 1,069 (51.7%) | 998 (48.3%) |
Services Occupations
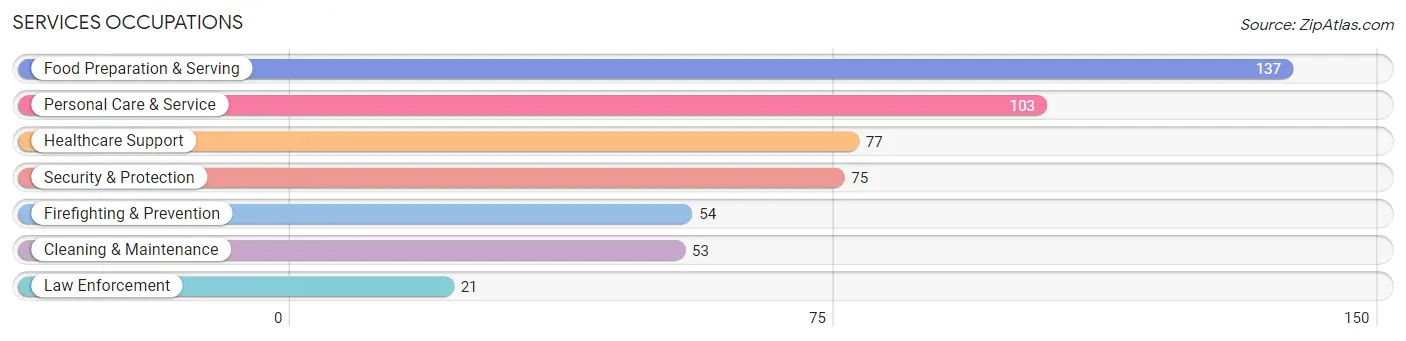
The most common Services occupations in Granite Falls are Food Preparation & Serving (137 | 6.6%), Personal Care & Service (103 | 5.0%), Healthcare Support (77 | 3.7%), Security & Protection (75 | 3.6%), and Firefighting & Prevention (54 | 2.6%).
Services Occupations by Sex
Within the Services occupations in Granite Falls, the most male-oriented occupations are Law Enforcement (100.0%), Security & Protection (65.3%), and Cleaning & Maintenance (60.4%), while the most female-oriented occupations are Personal Care & Service (100.0%), Food Preparation & Serving (86.1%), and Healthcare Support (75.3%).
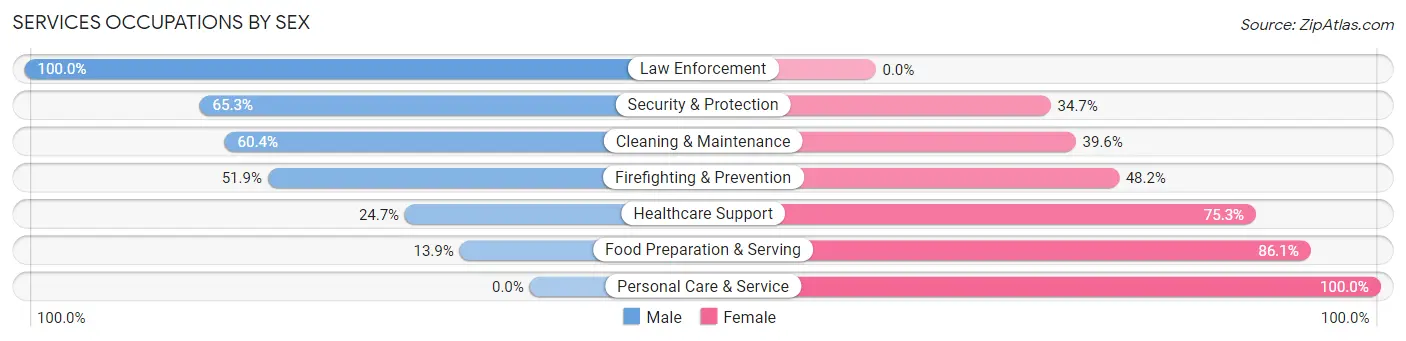
| Occupation | Male | Female |
| Healthcare Support | 19 (24.7%) | 58 (75.3%) |
| Security & Protection | 49 (65.3%) | 26 (34.7%) |
| Firefighting & Prevention | 28 (51.8%) | 26 (48.1%) |
| Law Enforcement | 21 (100.0%) | 0 (0.0%) |
| Food Preparation & Serving | 19 (13.9%) | 118 (86.1%) |
| Cleaning & Maintenance | 32 (60.4%) | 21 (39.6%) |
| Personal Care & Service | 0 (0.0%) | 103 (100.0%) |
| Total (Category) | 119 (26.7%) | 326 (73.3%) |
| Total (Overall) | 1,069 (51.7%) | 998 (48.3%) |
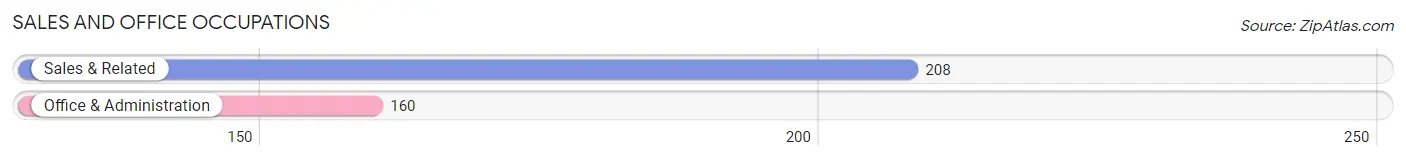
Sales and Office Occupations
The most common Sales and Office occupations in Granite Falls are Sales & Related (208 | 10.1%), and Office & Administration (160 | 7.7%).
Sales and Office Occupations by Sex
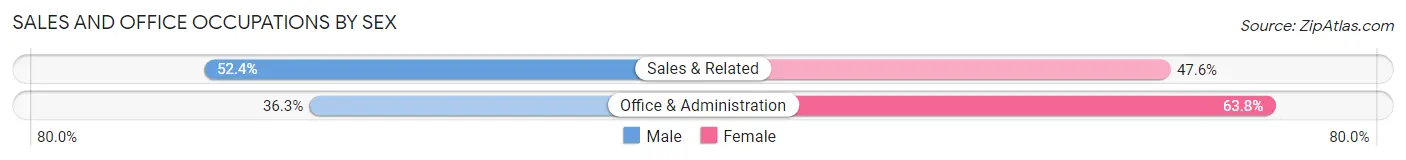
| Occupation | Male | Female |
| Sales & Related | 109 (52.4%) | 99 (47.6%) |
| Office & Administration | 58 (36.2%) | 102 (63.7%) |
| Total (Category) | 167 (45.4%) | 201 (54.6%) |
| Total (Overall) | 1,069 (51.7%) | 998 (48.3%) |
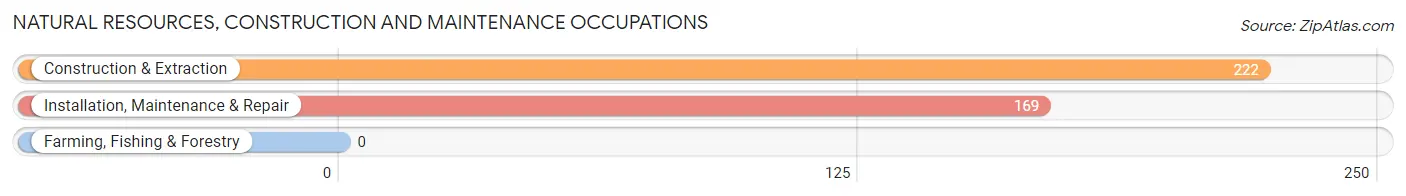
Natural Resources, Construction and Maintenance Occupations
The most common Natural Resources, Construction and Maintenance occupations in Granite Falls are Construction & Extraction (222 | 10.7%), and Installation, Maintenance & Repair (169 | 8.2%).
Natural Resources, Construction and Maintenance Occupations by Sex
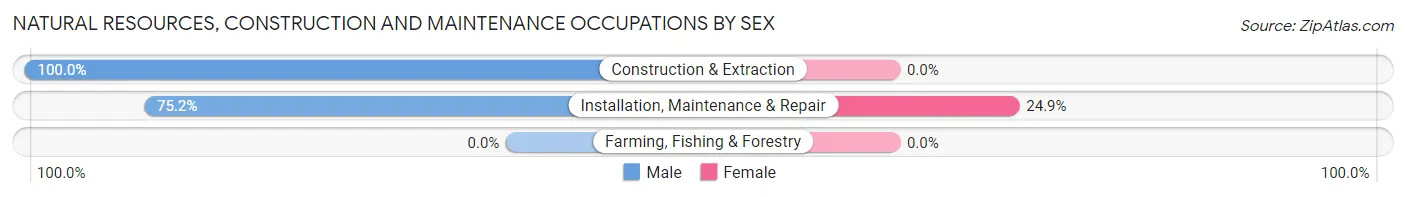
| Occupation | Male | Female |
| Farming, Fishing & Forestry | 0 (0.0%) | 0 (0.0%) |
| Construction & Extraction | 222 (100.0%) | 0 (0.0%) |
| Installation, Maintenance & Repair | 127 (75.1%) | 42 (24.8%) |
| Total (Category) | 349 (89.3%) | 42 (10.7%) |
| Total (Overall) | 1,069 (51.7%) | 998 (48.3%) |
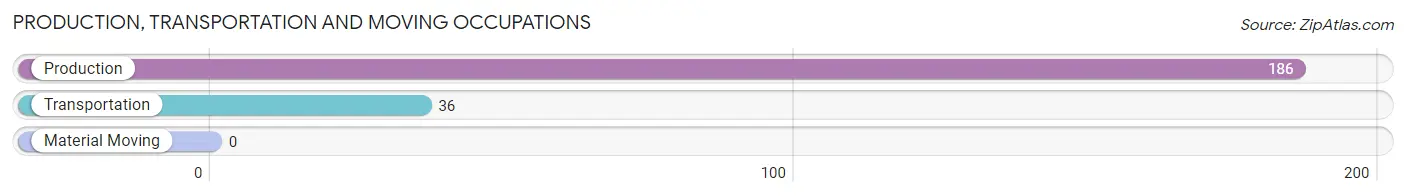
Production, Transportation and Moving Occupations
The most common Production, Transportation and Moving occupations in Granite Falls are Production (186 | 9.0%), and Transportation (36 | 1.7%).
Production, Transportation and Moving Occupations by Sex
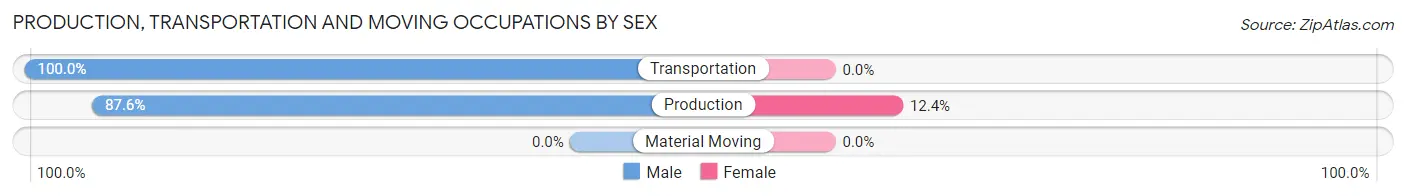
| Occupation | Male | Female |
| Production | 163 (87.6%) | 23 (12.4%) |
| Transportation | 36 (100.0%) | 0 (0.0%) |
| Material Moving | 0 (0.0%) | 0 (0.0%) |
| Total (Category) | 199 (89.6%) | 23 (10.4%) |
| Total (Overall) | 1,069 (51.7%) | 998 (48.3%) |
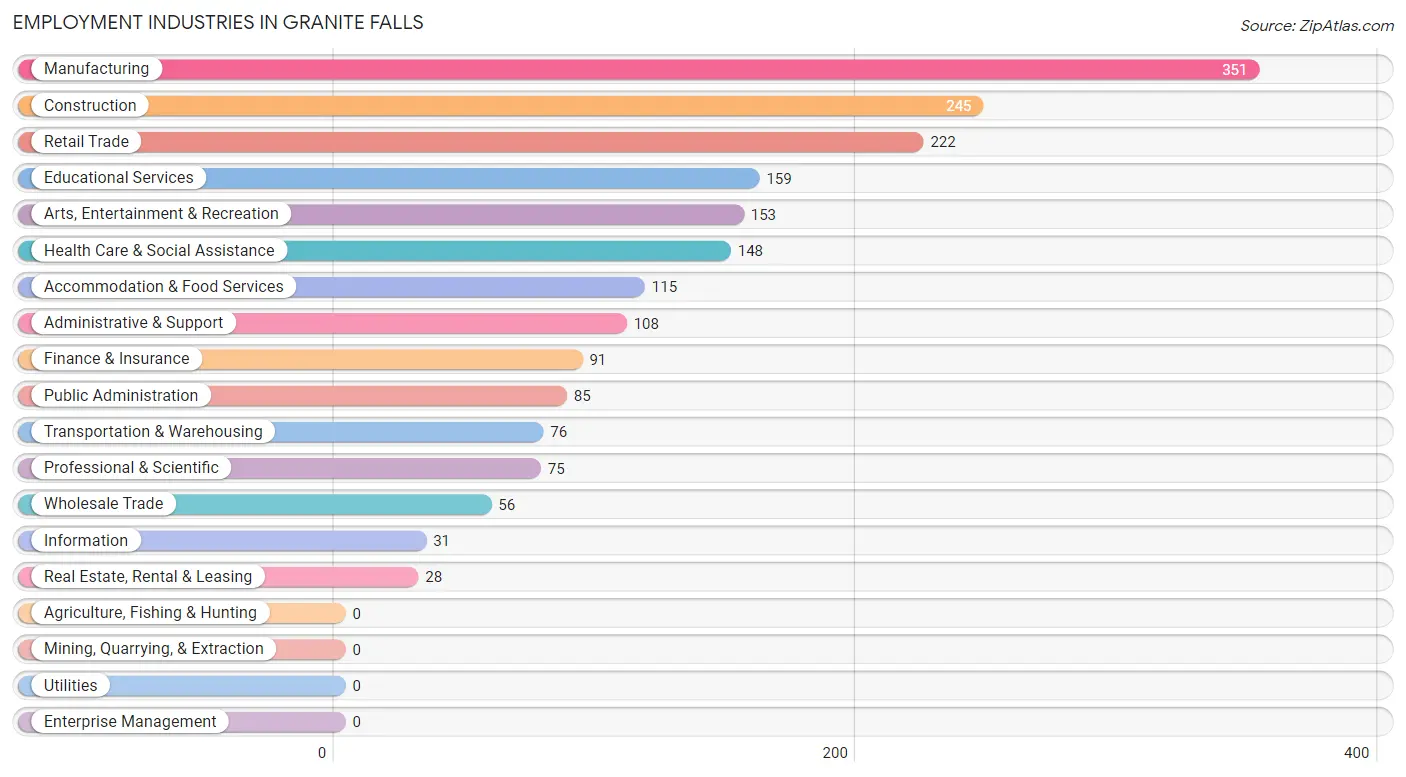
Employment Industries by Sex in Granite Falls
Employment Industries in Granite Falls
The major employment industries in Granite Falls include Manufacturing (351 | 17.0%), Construction (245 | 11.8%), Retail Trade (222 | 10.7%), Educational Services (159 | 7.7%), and Arts, Entertainment & Recreation (153 | 7.4%).
Employment Industries by Sex in Granite Falls
The Granite Falls industries that see more men than women are Real Estate, Rental & Leasing (100.0%), Construction (90.6%), and Manufacturing (88.0%), whereas the industries that tend to have a higher number of women are Finance & Insurance (100.0%), Health Care & Social Assistance (91.9%), and Wholesale Trade (76.8%).
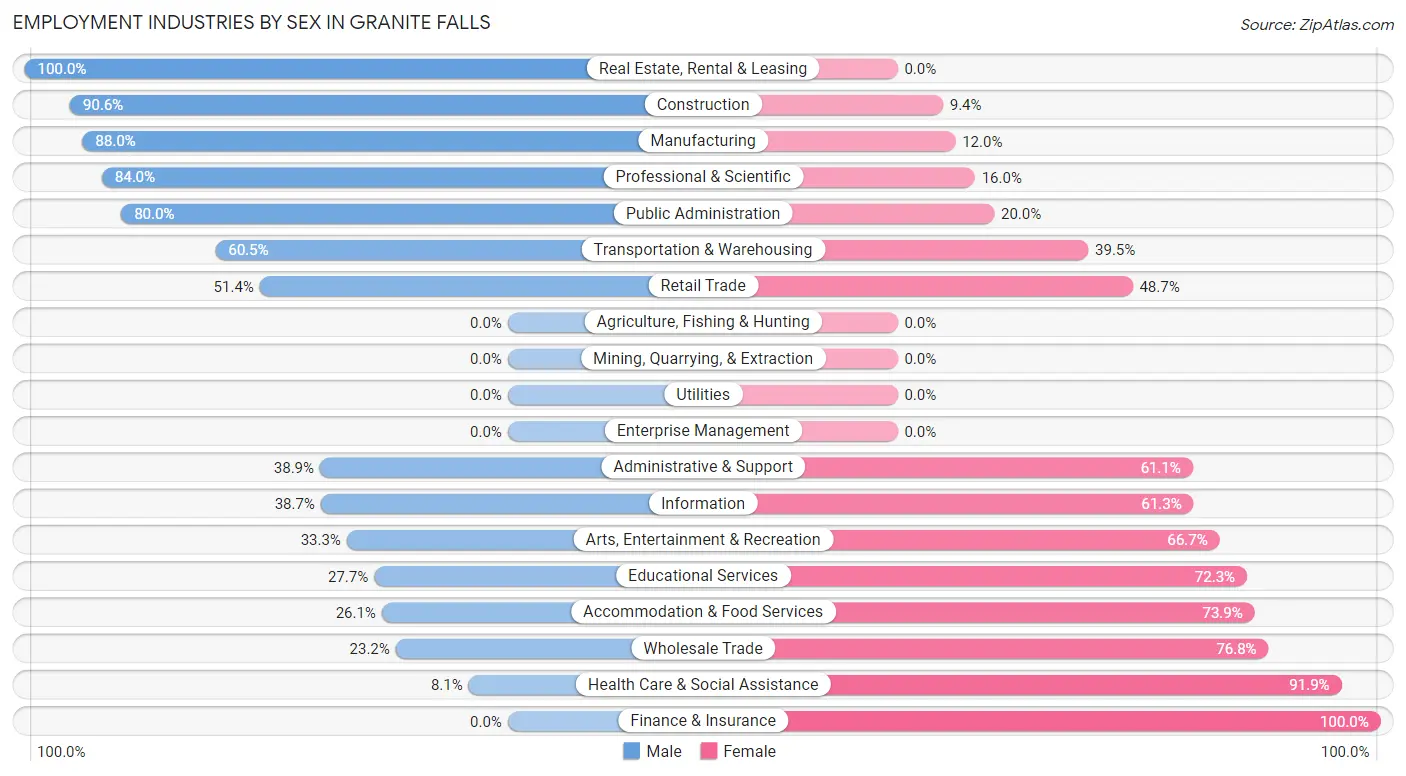
| Industry | Male | Female |
| Agriculture, Fishing & Hunting | 0 (0.0%) | 0 (0.0%) |
| Mining, Quarrying, & Extraction | 0 (0.0%) | 0 (0.0%) |
| Construction | 222 (90.6%) | 23 (9.4%) |
| Manufacturing | 309 (88.0%) | 42 (12.0%) |
| Wholesale Trade | 13 (23.2%) | 43 (76.8%) |
| Retail Trade | 114 (51.3%) | 108 (48.6%) |
| Transportation & Warehousing | 46 (60.5%) | 30 (39.5%) |
| Utilities | 0 (0.0%) | 0 (0.0%) |
| Information | 12 (38.7%) | 19 (61.3%) |
| Finance & Insurance | 0 (0.0%) | 91 (100.0%) |
| Real Estate, Rental & Leasing | 28 (100.0%) | 0 (0.0%) |
| Professional & Scientific | 63 (84.0%) | 12 (16.0%) |
| Enterprise Management | 0 (0.0%) | 0 (0.0%) |
| Administrative & Support | 42 (38.9%) | 66 (61.1%) |
| Educational Services | 44 (27.7%) | 115 (72.3%) |
| Health Care & Social Assistance | 12 (8.1%) | 136 (91.9%) |
| Arts, Entertainment & Recreation | 51 (33.3%) | 102 (66.7%) |
| Accommodation & Food Services | 30 (26.1%) | 85 (73.9%) |
| Public Administration | 68 (80.0%) | 17 (20.0%) |
| Total | 1,069 (51.7%) | 998 (48.3%) |
Education in Granite Falls
School Enrollment in Granite Falls
The most common levels of schooling among the 1,242 students in Granite Falls are middle school (349 | 28.1%), high school (333 | 26.8%), and elementary school (264 | 21.3%).
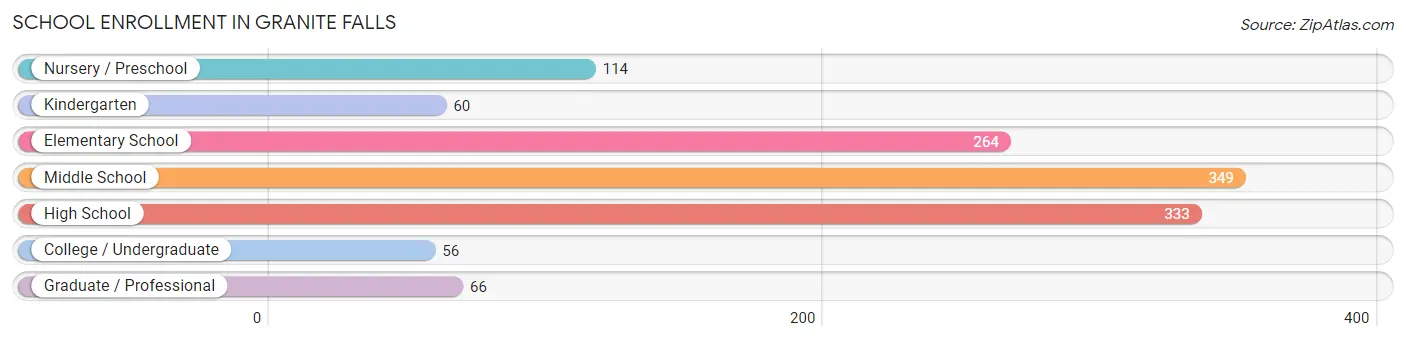
| School Level | # Students | % Students |
| Nursery / Preschool | 114 | 9.2% |
| Kindergarten | 60 | 4.8% |
| Elementary School | 264 | 21.3% |
| Middle School | 349 | 28.1% |
| High School | 333 | 26.8% |
| College / Undergraduate | 56 | 4.5% |
| Graduate / Professional | 66 | 5.3% |
| Total | 1,242 | 100.0% |
School Enrollment by Age by Funding Source in Granite Falls
Out of a total of 1,242 students who are enrolled in schools in Granite Falls, 166 (13.4%) attend a private institution, while the remaining 1,076 (86.6%) are enrolled in public schools. The age group of 20 to 24 year olds has the highest likelihood of being enrolled in private schools, with 37 (39.8% in the age bracket) enrolled. Conversely, the age group of 15 to 17 year olds has the lowest likelihood of being enrolled in a private school, with 107 (100.0% in the age bracket) attending a public institution.
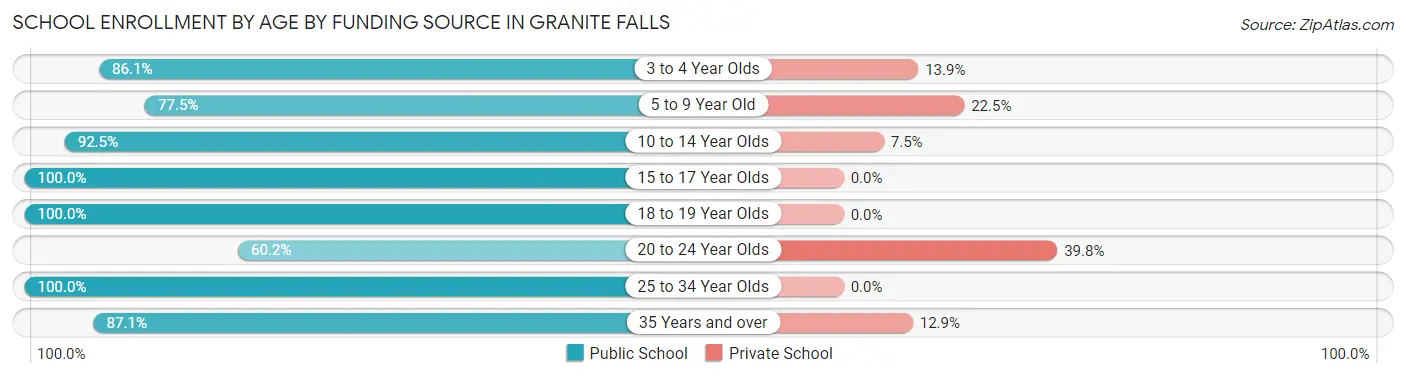
| Age Bracket | Public School | Private School |
| 3 to 4 Year Olds | 93 (86.1%) | 15 (13.9%) |
| 5 to 9 Year Old | 221 (77.5%) | 64 (22.5%) |
| 10 to 14 Year Olds | 457 (92.5%) | 37 (7.5%) |
| 15 to 17 Year Olds | 107 (100.0%) | 0 (0.0%) |
| 18 to 19 Year Olds | 38 (100.0%) | 0 (0.0%) |
| 20 to 24 Year Olds | 56 (60.2%) | 37 (39.8%) |
| 25 to 34 Year Olds | 16 (100.0%) | 0 (0.0%) |
| 35 Years and over | 88 (87.1%) | 13 (12.9%) |
| Total | 1,076 (86.6%) | 166 (13.4%) |
Educational Attainment by Field of Study in Granite Falls
Science & technology (177 | 30.8%), education (140 | 24.4%), business (65 | 11.3%), literature & languages (59 | 10.3%), and visual & performing arts (41 | 7.1%) are the most common fields of study among 574 individuals in Granite Falls who have obtained a bachelor's degree or higher.
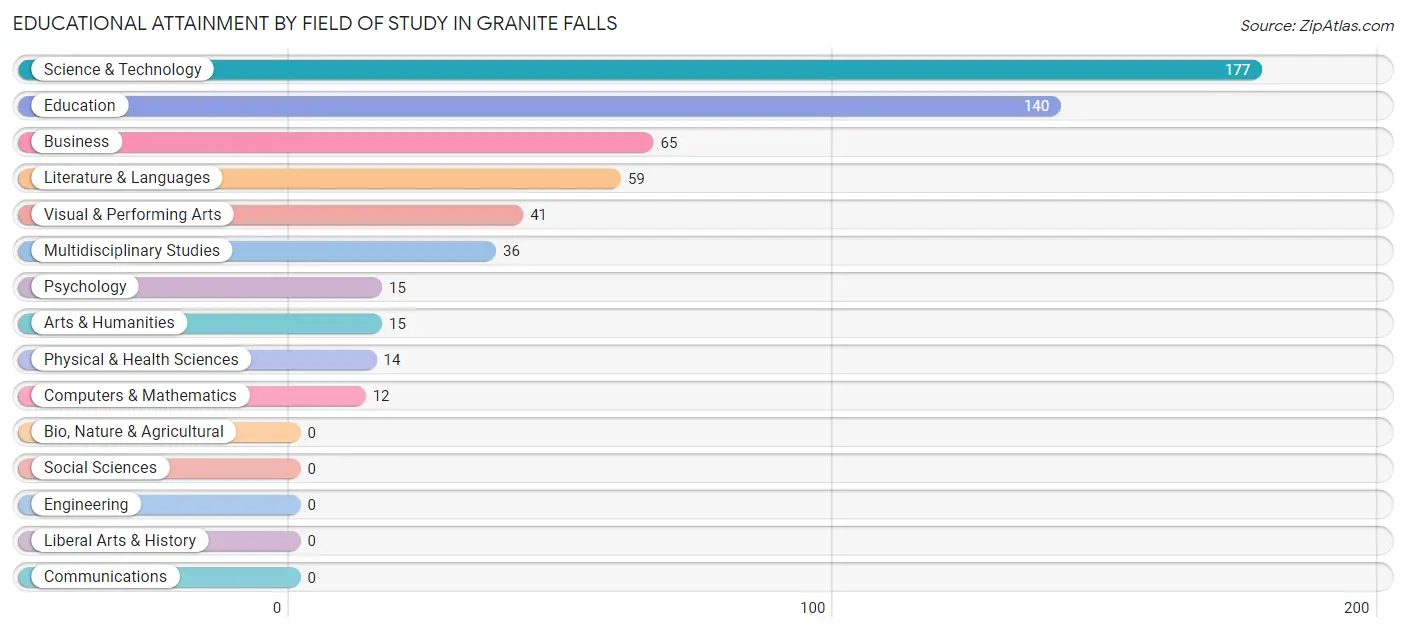
| Field of Study | # Graduates | % Graduates |
| Computers & Mathematics | 12 | 2.1% |
| Bio, Nature & Agricultural | 0 | 0.0% |
| Physical & Health Sciences | 14 | 2.4% |
| Psychology | 15 | 2.6% |
| Social Sciences | 0 | 0.0% |
| Engineering | 0 | 0.0% |
| Multidisciplinary Studies | 36 | 6.3% |
| Science & Technology | 177 | 30.8% |
| Business | 65 | 11.3% |
| Education | 140 | 24.4% |
| Literature & Languages | 59 | 10.3% |
| Liberal Arts & History | 0 | 0.0% |
| Visual & Performing Arts | 41 | 7.1% |
| Communications | 0 | 0.0% |
| Arts & Humanities | 15 | 2.6% |
| Total | 574 | 100.0% |
Transportation & Commute in Granite Falls
Vehicle Availability by Sex in Granite Falls
The most prevalent vehicle ownership categories in Granite Falls are males with 2 vehicles (445, accounting for 40.9%) and females with 2 vehicles (359, making up 46.0%).
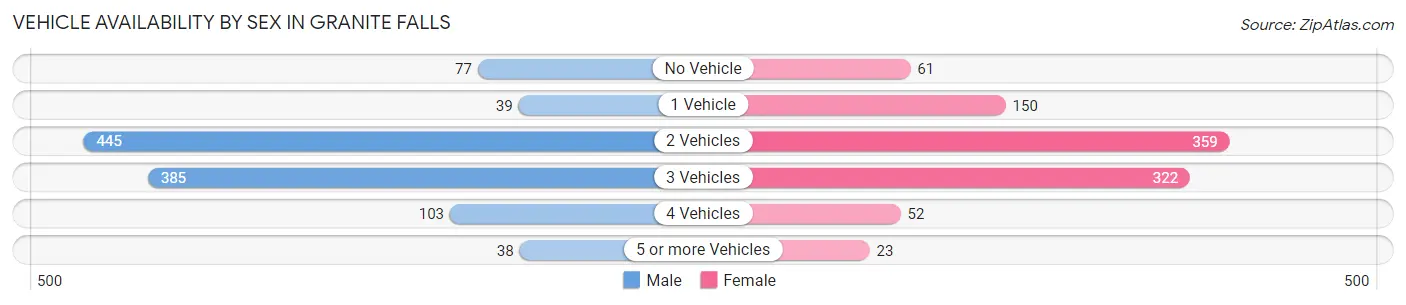
| Vehicles Available | Male | Female |
| No Vehicle | 77 (7.1%) | 61 (6.3%) |
| 1 Vehicle | 39 (3.6%) | 150 (15.5%) |
| 2 Vehicles | 445 (40.9%) | 359 (37.1%) |
| 3 Vehicles | 385 (35.4%) | 322 (33.3%) |
| 4 Vehicles | 103 (9.5%) | 52 (5.4%) |
| 5 or more Vehicles | 38 (3.5%) | 23 (2.4%) |
| Total | 1,087 (100.0%) | 967 (100.0%) |
Commute Time in Granite Falls
The most frequently occuring commute durations in Granite Falls are 45 to 59 minutes (267 commuters, 15.4%), 30 to 34 minutes (238 commuters, 13.7%), and 60 to 89 minutes (203 commuters, 11.7%).
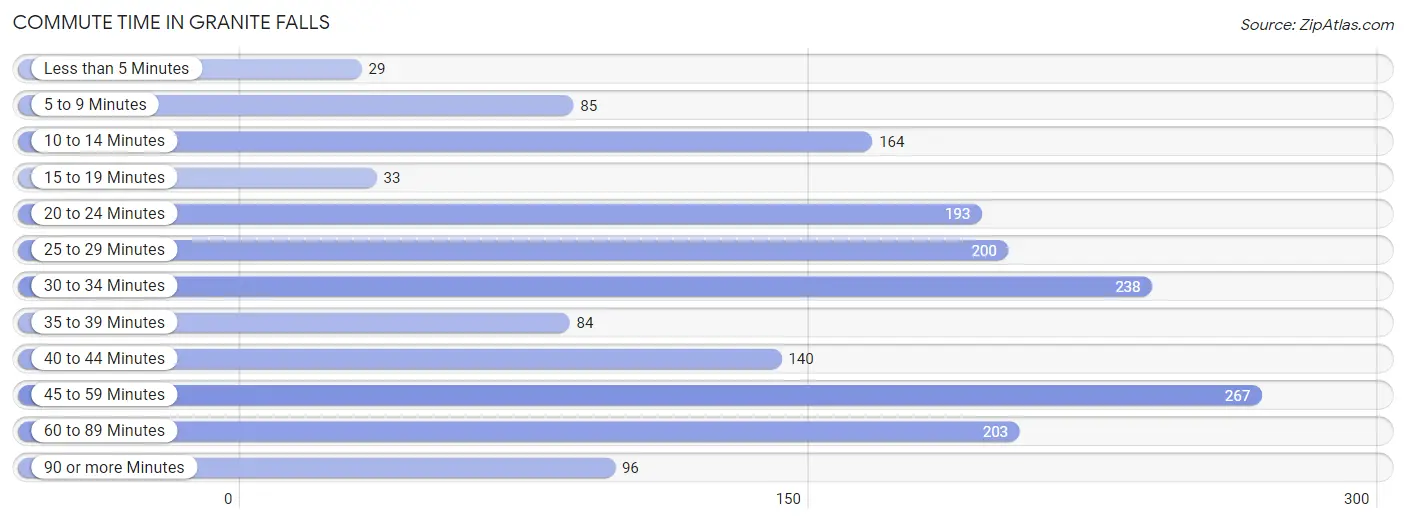
| Commute Time | # Commuters | % Commuters |
| Less than 5 Minutes | 29 | 1.7% |
| 5 to 9 Minutes | 85 | 4.9% |
| 10 to 14 Minutes | 164 | 9.5% |
| 15 to 19 Minutes | 33 | 1.9% |
| 20 to 24 Minutes | 193 | 11.1% |
| 25 to 29 Minutes | 200 | 11.6% |
| 30 to 34 Minutes | 238 | 13.7% |
| 35 to 39 Minutes | 84 | 4.9% |
| 40 to 44 Minutes | 140 | 8.1% |
| 45 to 59 Minutes | 267 | 15.4% |
| 60 to 89 Minutes | 203 | 11.7% |
| 90 or more Minutes | 96 | 5.5% |
Commute Time by Sex in Granite Falls
The most common commute times in Granite Falls are 25 to 29 minutes (163 commuters, 16.5%) for males and 30 to 34 minutes (144 commuters, 19.4%) for females.
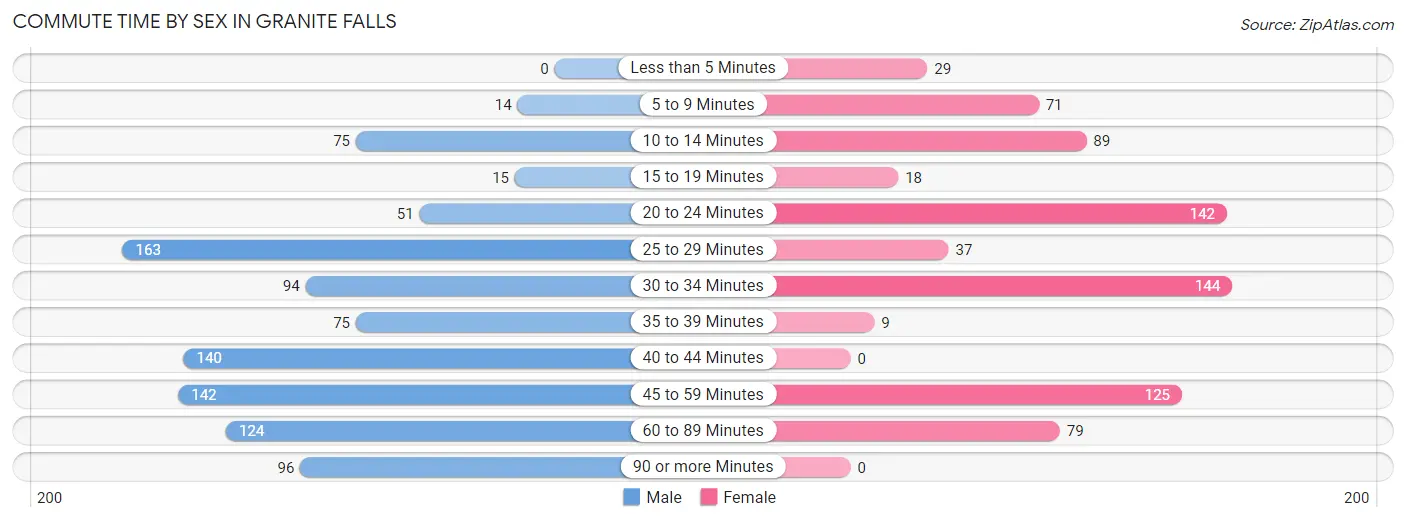
| Commute Time | Male | Female |
| Less than 5 Minutes | 0 (0.0%) | 29 (3.9%) |
| 5 to 9 Minutes | 14 (1.4%) | 71 (9.6%) |
| 10 to 14 Minutes | 75 (7.6%) | 89 (12.0%) |
| 15 to 19 Minutes | 15 (1.5%) | 18 (2.4%) |
| 20 to 24 Minutes | 51 (5.2%) | 142 (19.1%) |
| 25 to 29 Minutes | 163 (16.5%) | 37 (5.0%) |
| 30 to 34 Minutes | 94 (9.5%) | 144 (19.4%) |
| 35 to 39 Minutes | 75 (7.6%) | 9 (1.2%) |
| 40 to 44 Minutes | 140 (14.2%) | 0 (0.0%) |
| 45 to 59 Minutes | 142 (14.4%) | 125 (16.8%) |
| 60 to 89 Minutes | 124 (12.5%) | 79 (10.6%) |
| 90 or more Minutes | 96 (9.7%) | 0 (0.0%) |
Time of Departure to Work by Sex in Granite Falls
The most frequent times of departure to work in Granite Falls are 12:00 AM to 4:59 AM (259, 26.2%) for males and 7:00 AM to 7:29 AM (170, 22.9%) for females.
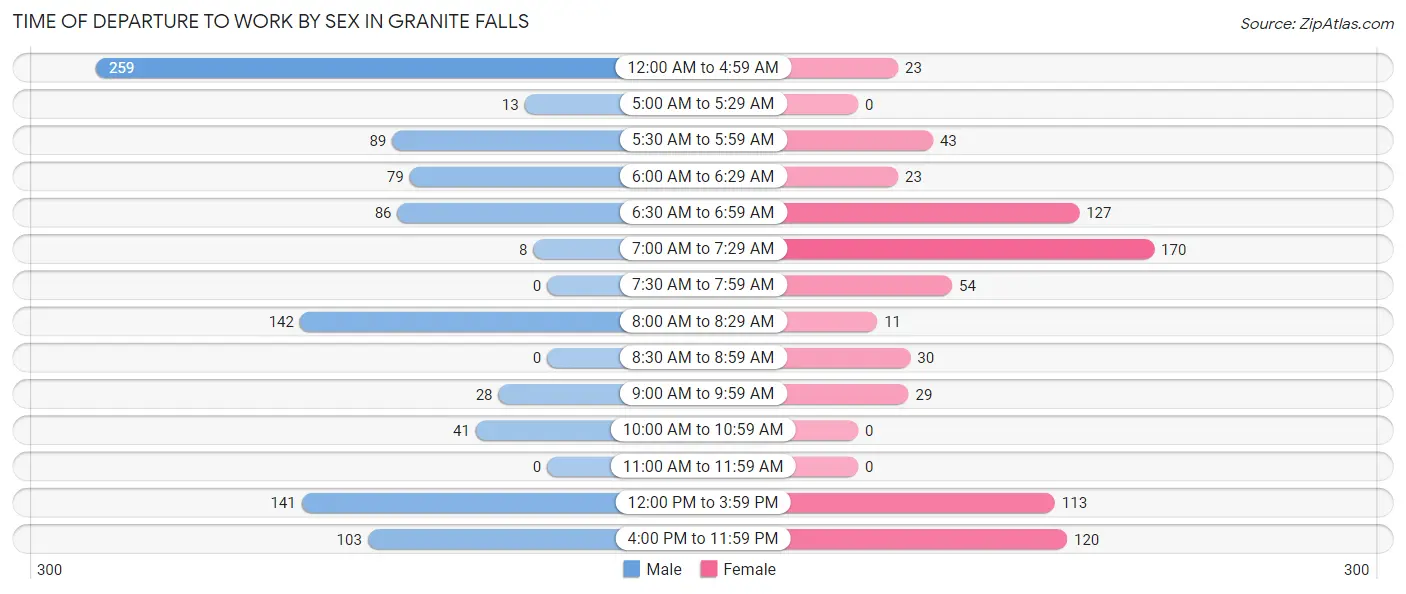
| Time of Departure | Male | Female |
| 12:00 AM to 4:59 AM | 259 (26.2%) | 23 (3.1%) |
| 5:00 AM to 5:29 AM | 13 (1.3%) | 0 (0.0%) |
| 5:30 AM to 5:59 AM | 89 (9.0%) | 43 (5.8%) |
| 6:00 AM to 6:29 AM | 79 (8.0%) | 23 (3.1%) |
| 6:30 AM to 6:59 AM | 86 (8.7%) | 127 (17.1%) |
| 7:00 AM to 7:29 AM | 8 (0.8%) | 170 (22.9%) |
| 7:30 AM to 7:59 AM | 0 (0.0%) | 54 (7.3%) |
| 8:00 AM to 8:29 AM | 142 (14.4%) | 11 (1.5%) |
| 8:30 AM to 8:59 AM | 0 (0.0%) | 30 (4.0%) |
| 9:00 AM to 9:59 AM | 28 (2.8%) | 29 (3.9%) |
| 10:00 AM to 10:59 AM | 41 (4.2%) | 0 (0.0%) |
| 11:00 AM to 11:59 AM | 0 (0.0%) | 0 (0.0%) |
| 12:00 PM to 3:59 PM | 141 (14.3%) | 113 (15.2%) |
| 4:00 PM to 11:59 PM | 103 (10.4%) | 120 (16.2%) |
| Total | 989 (100.0%) | 743 (100.0%) |
Housing Occupancy in Granite Falls
Occupancy by Ownership in Granite Falls
Of the total 1,694 dwellings in Granite Falls, owner-occupied units account for 1,246 (73.6%), while renter-occupied units make up 448 (26.5%).
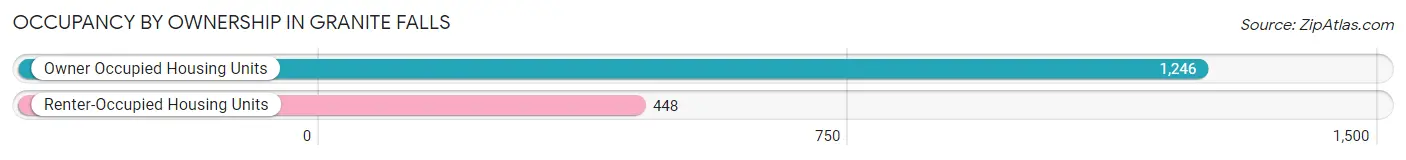
| Occupancy | # Housing Units | % Housing Units |
| Owner Occupied Housing Units | 1,246 | 73.6% |
| Renter-Occupied Housing Units | 448 | 26.5% |
| Total Occupied Housing Units | 1,694 | 100.0% |
Occupancy by Household Size in Granite Falls
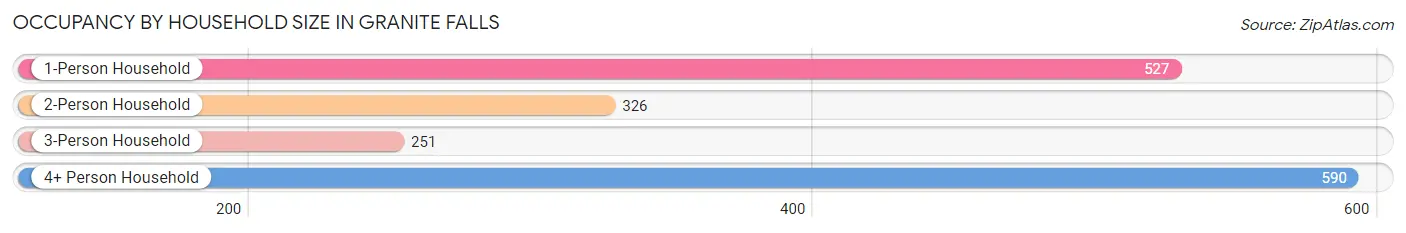
| Household Size | # Housing Units | % Housing Units |
| 1-Person Household | 527 | 31.1% |
| 2-Person Household | 326 | 19.2% |
| 3-Person Household | 251 | 14.8% |
| 4+ Person Household | 590 | 34.8% |
| Total Housing Units | 1,694 | 100.0% |
Occupancy by Ownership by Household Size in Granite Falls
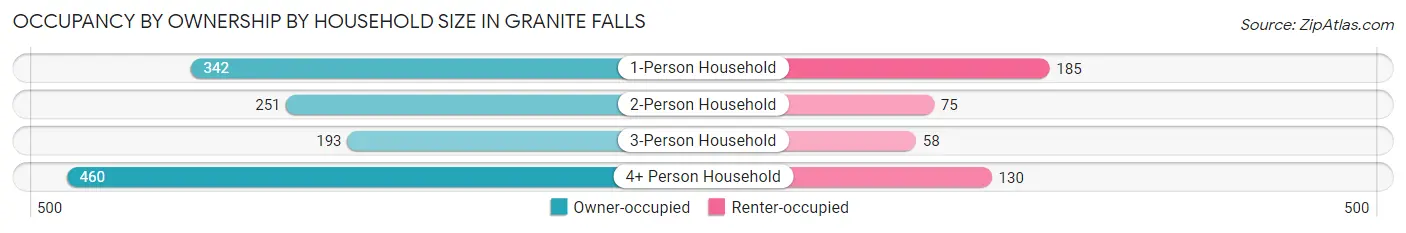
| Household Size | Owner-occupied | Renter-occupied |
| 1-Person Household | 342 (64.9%) | 185 (35.1%) |
| 2-Person Household | 251 (77.0%) | 75 (23.0%) |
| 3-Person Household | 193 (76.9%) | 58 (23.1%) |
| 4+ Person Household | 460 (78.0%) | 130 (22.0%) |
| Total Housing Units | 1,246 (73.6%) | 448 (26.5%) |
Occupancy by Educational Attainment in Granite Falls
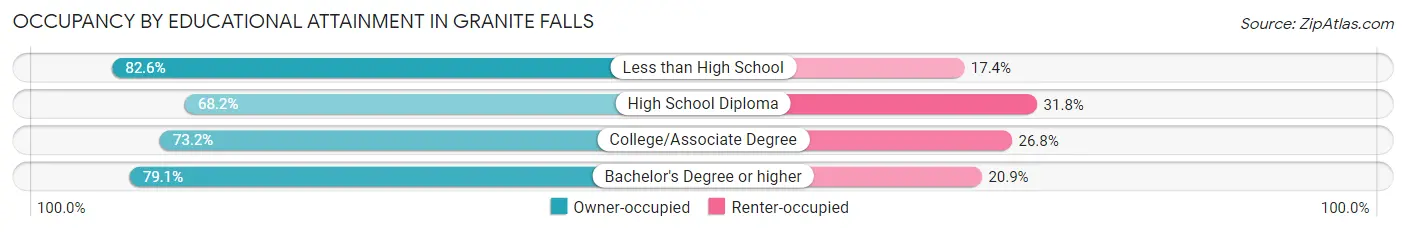
| Household Size | Owner-occupied | Renter-occupied |
| Less than High School | 76 (82.6%) | 16 (17.4%) |
| High School Diploma | 330 (68.2%) | 154 (31.8%) |
| College/Associate Degree | 548 (73.2%) | 201 (26.8%) |
| Bachelor's Degree or higher | 292 (79.1%) | 77 (20.9%) |
Occupancy by Age of Householder in Granite Falls
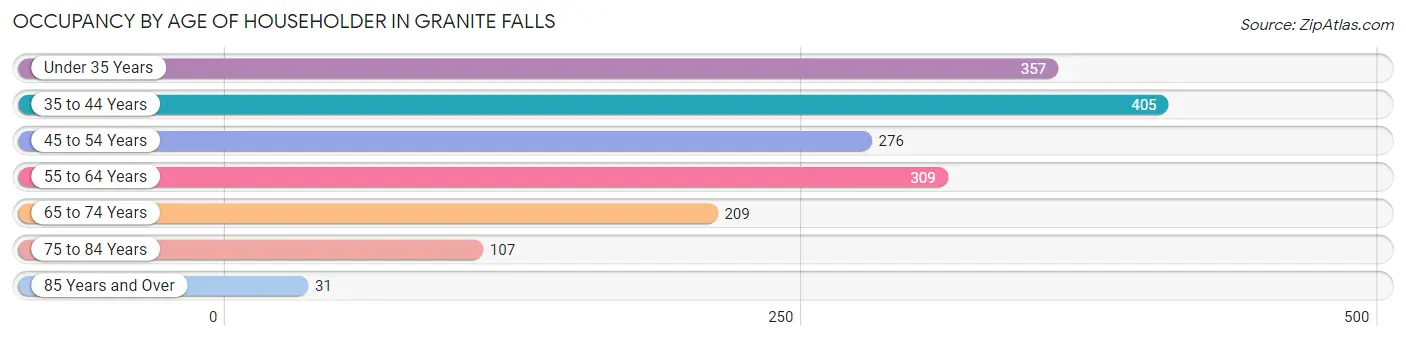
| Age Bracket | # Households | % Households |
| Under 35 Years | 357 | 21.1% |
| 35 to 44 Years | 405 | 23.9% |
| 45 to 54 Years | 276 | 16.3% |
| 55 to 64 Years | 309 | 18.2% |
| 65 to 74 Years | 209 | 12.3% |
| 75 to 84 Years | 107 | 6.3% |
| 85 Years and Over | 31 | 1.8% |
| Total | 1,694 | 100.0% |
Housing Finances in Granite Falls
Median Income by Occupancy in Granite Falls
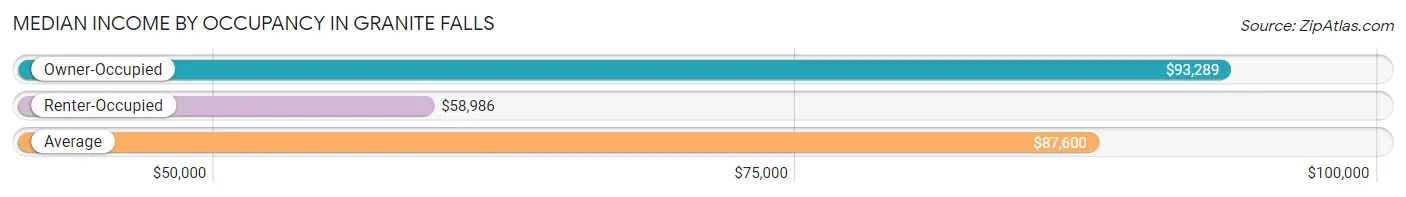
| Occupancy Type | # Households | Median Income |
| Owner-Occupied | 1,246 (73.6%) | $93,289 |
| Renter-Occupied | 448 (26.5%) | $58,986 |
| Average | 1,694 (100.0%) | $87,600 |
Occupancy by Householder Income Bracket in Granite Falls
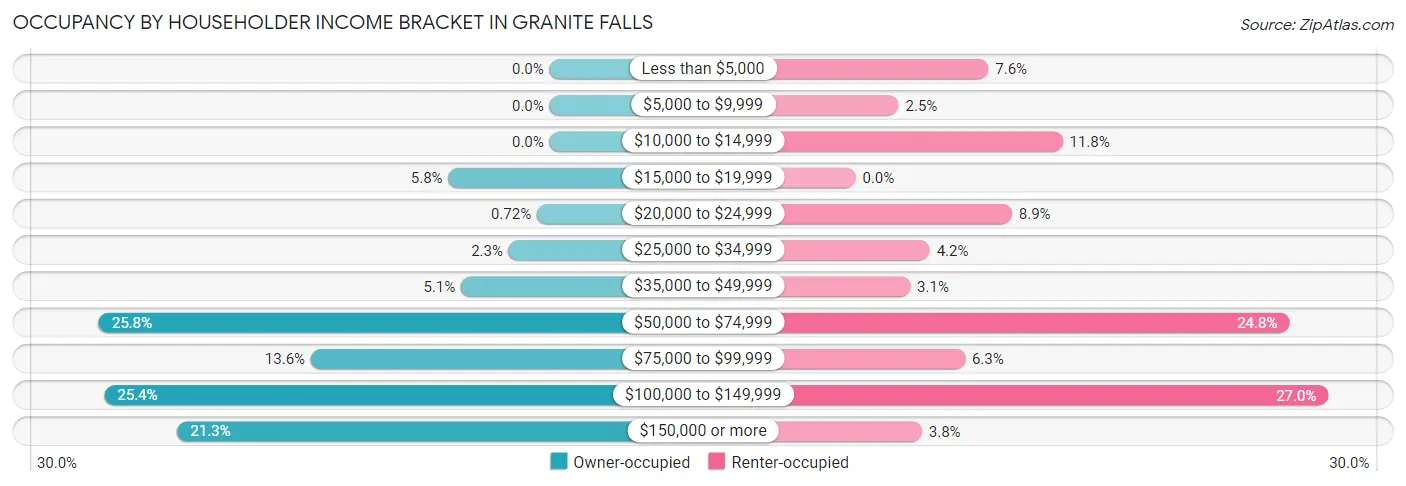
| Income Bracket | Owner-occupied | Renter-occupied |
| Less than $5,000 | 0 (0.0%) | 34 (7.6%) |
| $5,000 to $9,999 | 0 (0.0%) | 11 (2.5%) |
| $10,000 to $14,999 | 0 (0.0%) | 53 (11.8%) |
| $15,000 to $19,999 | 72 (5.8%) | 0 (0.0%) |
| $20,000 to $24,999 | 9 (0.7%) | 40 (8.9%) |
| $25,000 to $34,999 | 29 (2.3%) | 19 (4.2%) |
| $35,000 to $49,999 | 63 (5.1%) | 14 (3.1%) |
| $50,000 to $74,999 | 321 (25.8%) | 111 (24.8%) |
| $75,000 to $99,999 | 170 (13.6%) | 28 (6.2%) |
| $100,000 to $149,999 | 317 (25.4%) | 121 (27.0%) |
| $150,000 or more | 265 (21.3%) | 17 (3.8%) |
| Total | 1,246 (100.0%) | 448 (100.0%) |
Monthly Housing Cost Tiers in Granite Falls
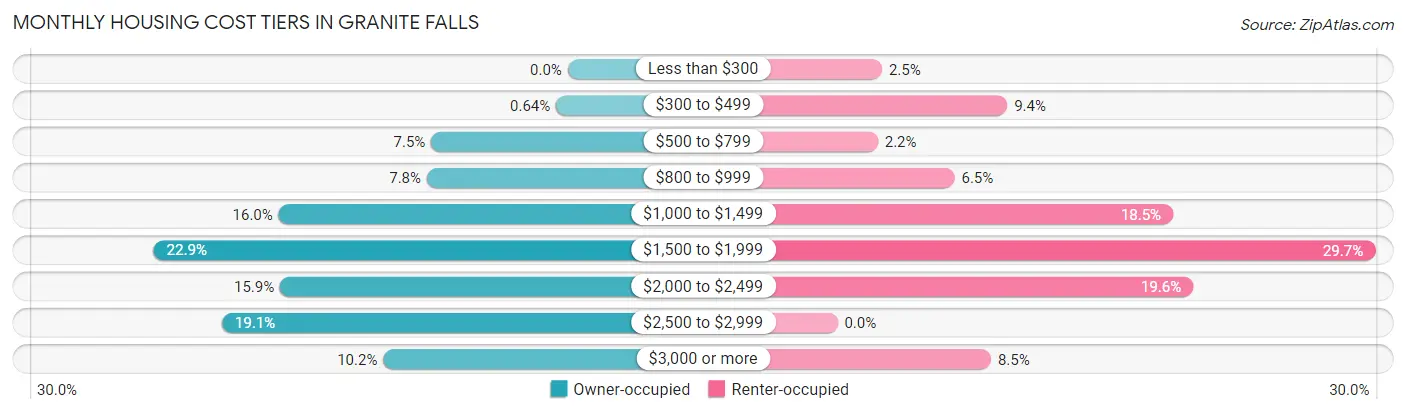
| Monthly Cost | Owner-occupied | Renter-occupied |
| Less than $300 | 0 (0.0%) | 11 (2.5%) |
| $300 to $499 | 8 (0.6%) | 42 (9.4%) |
| $500 to $799 | 94 (7.5%) | 10 (2.2%) |
| $800 to $999 | 97 (7.8%) | 29 (6.5%) |
| $1,000 to $1,499 | 199 (16.0%) | 83 (18.5%) |
| $1,500 to $1,999 | 285 (22.9%) | 133 (29.7%) |
| $2,000 to $2,499 | 198 (15.9%) | 88 (19.6%) |
| $2,500 to $2,999 | 238 (19.1%) | 0 (0.0%) |
| $3,000 or more | 127 (10.2%) | 38 (8.5%) |
| Total | 1,246 (100.0%) | 448 (100.0%) |
Physical Housing Characteristics in Granite Falls
Housing Structures in Granite Falls
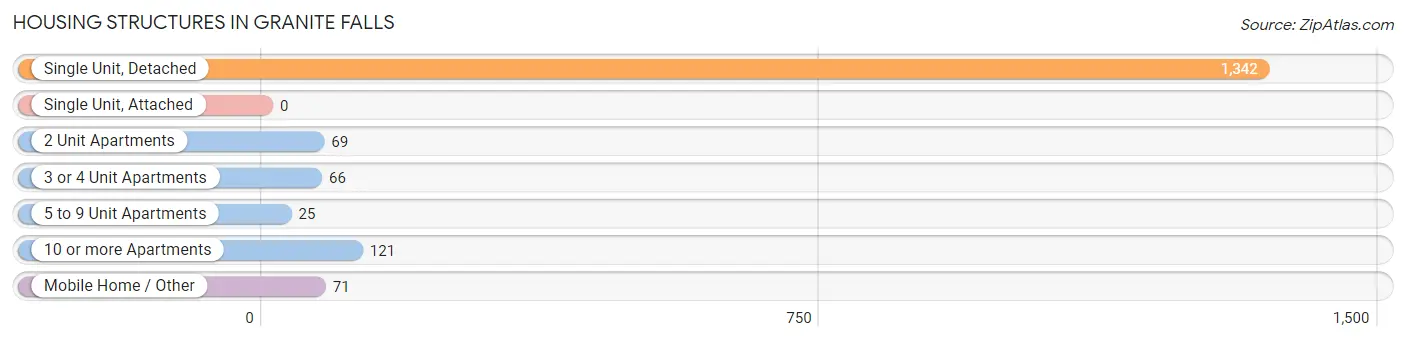
| Structure Type | # Housing Units | % Housing Units |
| Single Unit, Detached | 1,342 | 79.2% |
| Single Unit, Attached | 0 | 0.0% |
| 2 Unit Apartments | 69 | 4.1% |
| 3 or 4 Unit Apartments | 66 | 3.9% |
| 5 to 9 Unit Apartments | 25 | 1.5% |
| 10 or more Apartments | 121 | 7.1% |
| Mobile Home / Other | 71 | 4.2% |
| Total | 1,694 | 100.0% |
Housing Structures by Occupancy in Granite Falls
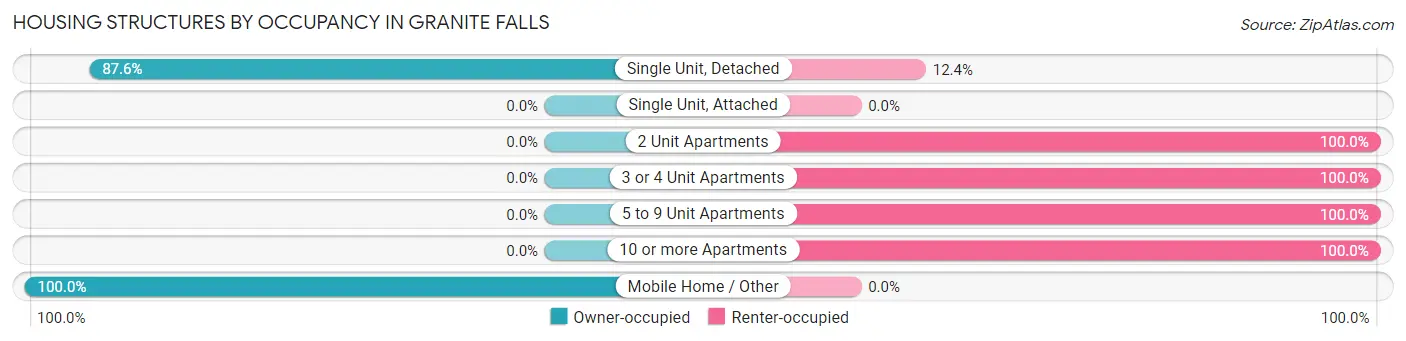
| Structure Type | Owner-occupied | Renter-occupied |
| Single Unit, Detached | 1,175 (87.6%) | 167 (12.4%) |
| Single Unit, Attached | 0 (0.0%) | 0 (0.0%) |
| 2 Unit Apartments | 0 (0.0%) | 69 (100.0%) |
| 3 or 4 Unit Apartments | 0 (0.0%) | 66 (100.0%) |
| 5 to 9 Unit Apartments | 0 (0.0%) | 25 (100.0%) |
| 10 or more Apartments | 0 (0.0%) | 121 (100.0%) |
| Mobile Home / Other | 71 (100.0%) | 0 (0.0%) |
| Total | 1,246 (73.6%) | 448 (26.5%) |
Housing Structures by Number of Rooms in Granite Falls
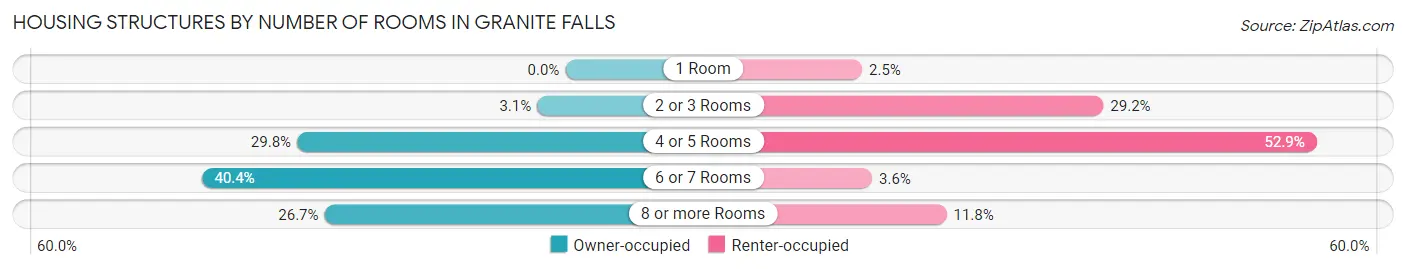
| Number of Rooms | Owner-occupied | Renter-occupied |
| 1 Room | 0 (0.0%) | 11 (2.5%) |
| 2 or 3 Rooms | 39 (3.1%) | 131 (29.2%) |
| 4 or 5 Rooms | 371 (29.8%) | 237 (52.9%) |
| 6 or 7 Rooms | 503 (40.4%) | 16 (3.6%) |
| 8 or more Rooms | 333 (26.7%) | 53 (11.8%) |
| Total | 1,246 (100.0%) | 448 (100.0%) |
Housing Structure by Heating Type in Granite Falls
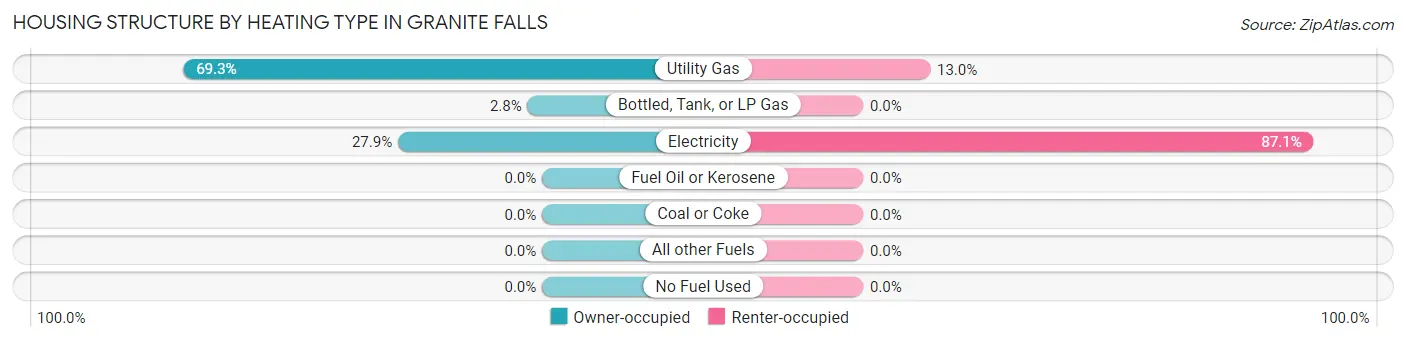
| Heating Type | Owner-occupied | Renter-occupied |
| Utility Gas | 864 (69.3%) | 58 (13.0%) |
| Bottled, Tank, or LP Gas | 35 (2.8%) | 0 (0.0%) |
| Electricity | 347 (27.9%) | 390 (87.1%) |
| Fuel Oil or Kerosene | 0 (0.0%) | 0 (0.0%) |
| Coal or Coke | 0 (0.0%) | 0 (0.0%) |
| All other Fuels | 0 (0.0%) | 0 (0.0%) |
| No Fuel Used | 0 (0.0%) | 0 (0.0%) |
| Total | 1,246 (100.0%) | 448 (100.0%) |
Household Vehicle Usage in Granite Falls
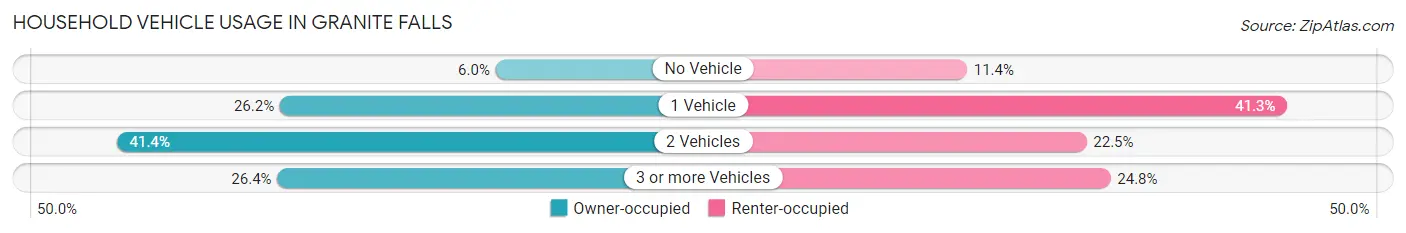
| Vehicles per Household | Owner-occupied | Renter-occupied |
| No Vehicle | 75 (6.0%) | 51 (11.4%) |
| 1 Vehicle | 326 (26.2%) | 185 (41.3%) |
| 2 Vehicles | 516 (41.4%) | 101 (22.5%) |
| 3 or more Vehicles | 329 (26.4%) | 111 (24.8%) |
| Total | 1,246 (100.0%) | 448 (100.0%) |
Real Estate & Mortgages in Granite Falls
Real Estate and Mortgage Overview in Granite Falls
| Characteristic | Without Mortgage | With Mortgage |
| Housing Units | 248 | 998 |
| Median Property Value | $440,200 | $472,500 |
| Median Household Income | $72,317 | $256 |
| Monthly Housing Costs | $844 | $127 |
| Real Estate Taxes | $4,524 | $13 |
Property Value by Mortgage Status in Granite Falls
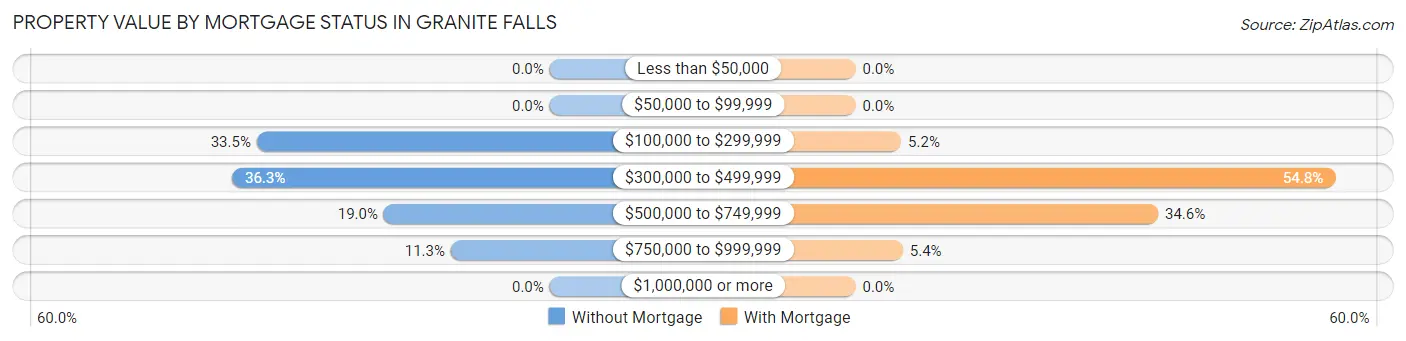
| Property Value | Without Mortgage | With Mortgage |
| Less than $50,000 | 0 (0.0%) | 0 (0.0%) |
| $50,000 to $99,999 | 0 (0.0%) | 0 (0.0%) |
| $100,000 to $299,999 | 83 (33.5%) | 52 (5.2%) |
| $300,000 to $499,999 | 90 (36.3%) | 547 (54.8%) |
| $500,000 to $749,999 | 47 (19.0%) | 345 (34.6%) |
| $750,000 to $999,999 | 28 (11.3%) | 54 (5.4%) |
| $1,000,000 or more | 0 (0.0%) | 0 (0.0%) |
| Total | 248 (100.0%) | 998 (100.0%) |
Household Income by Mortgage Status in Granite Falls
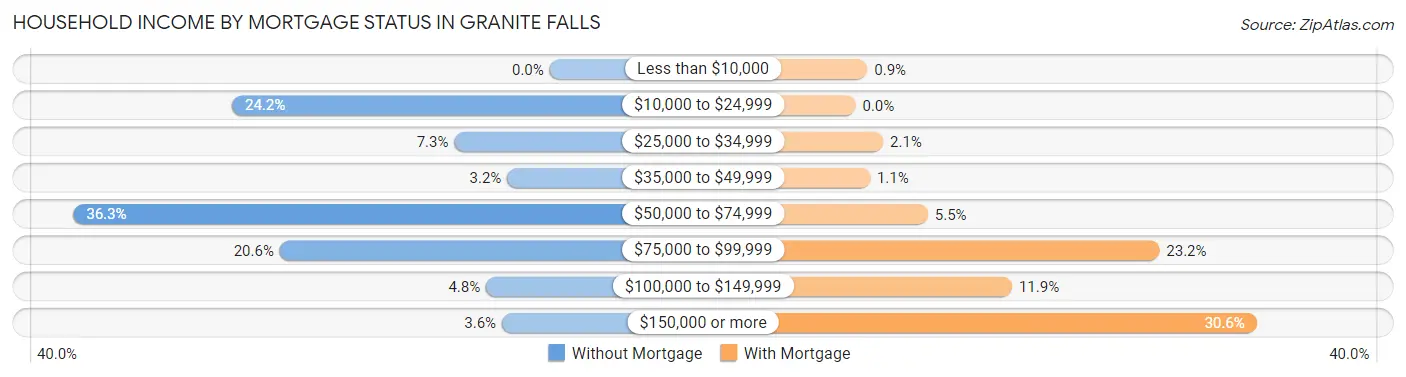
| Household Income | Without Mortgage | With Mortgage |
| Less than $10,000 | 0 (0.0%) | 9 (0.9%) |
| $10,000 to $24,999 | 60 (24.2%) | 0 (0.0%) |
| $25,000 to $34,999 | 18 (7.3%) | 21 (2.1%) |
| $35,000 to $49,999 | 8 (3.2%) | 11 (1.1%) |
| $50,000 to $74,999 | 90 (36.3%) | 55 (5.5%) |
| $75,000 to $99,999 | 51 (20.6%) | 231 (23.2%) |
| $100,000 to $149,999 | 12 (4.8%) | 119 (11.9%) |
| $150,000 or more | 9 (3.6%) | 305 (30.6%) |
| Total | 248 (100.0%) | 998 (100.0%) |
Property Value to Household Income Ratio in Granite Falls
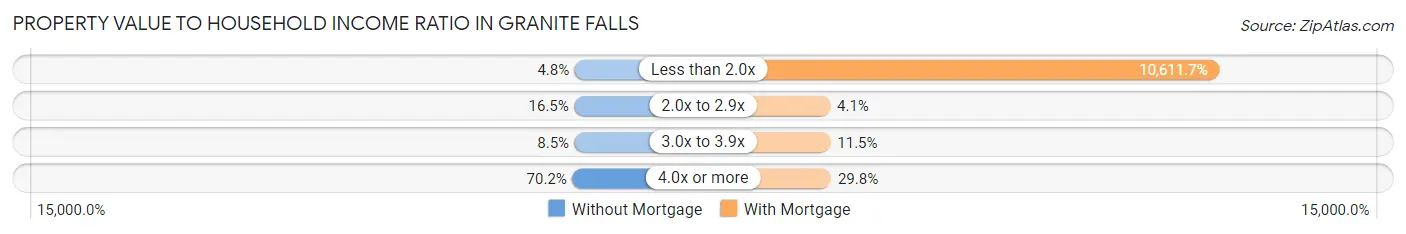
| Value-to-Income Ratio | Without Mortgage | With Mortgage |
| Less than 2.0x | 12 (4.8%) | 105,905 (10,611.7%) |
| 2.0x to 2.9x | 41 (16.5%) | 41 (4.1%) |
| 3.0x to 3.9x | 21 (8.5%) | 115 (11.5%) |
| 4.0x or more | 174 (70.2%) | 297 (29.8%) |
| Total | 248 (100.0%) | 998 (100.0%) |
Real Estate Taxes by Mortgage Status in Granite Falls
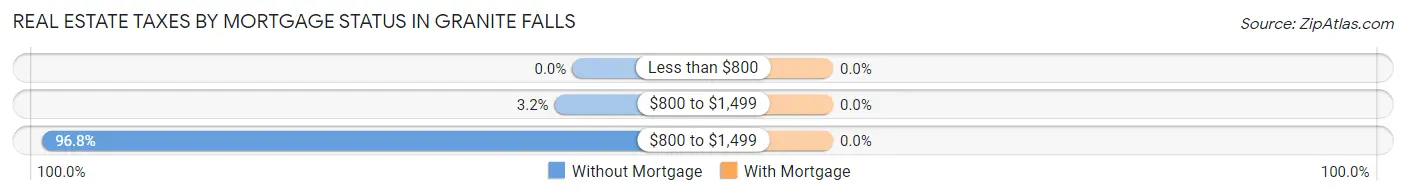
| Property Taxes | Without Mortgage | With Mortgage |
| Less than $800 | 0 (0.0%) | 0 (0.0%) |
| $800 to $1,499 | 8 (3.2%) | 0 (0.0%) |
| $800 to $1,499 | 240 (96.8%) | 0 (0.0%) |
| Total | 248 (100.0%) | 998 (100.0%) |
Health & Disability in Granite Falls
Health Insurance Coverage by Age in Granite Falls
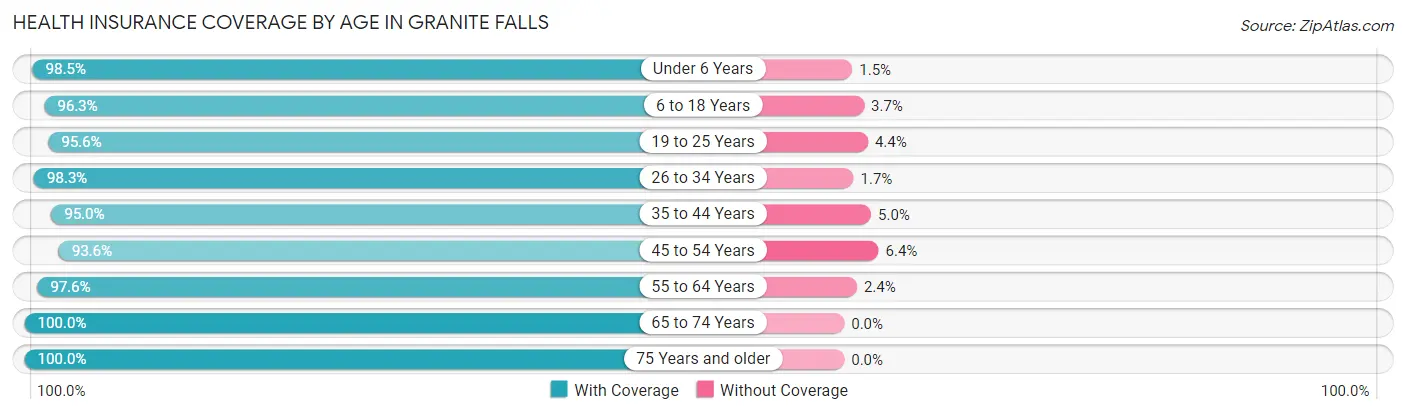
| Age Bracket | With Coverage | Without Coverage |
| Under 6 Years | 461 (98.5%) | 7 (1.5%) |
| 6 to 18 Years | 835 (96.3%) | 32 (3.7%) |
| 19 to 25 Years | 303 (95.6%) | 14 (4.4%) |
| 26 to 34 Years | 736 (98.3%) | 13 (1.7%) |
| 35 to 44 Years | 609 (95.0%) | 32 (5.0%) |
| 45 to 54 Years | 381 (93.6%) | 26 (6.4%) |
| 55 to 64 Years | 576 (97.6%) | 14 (2.4%) |
| 65 to 74 Years | 273 (100.0%) | 0 (0.0%) |
| 75 Years and older | 206 (100.0%) | 0 (0.0%) |
| Total | 4,380 (97.0%) | 138 (3.0%) |
Health Insurance Coverage by Citizenship Status in Granite Falls
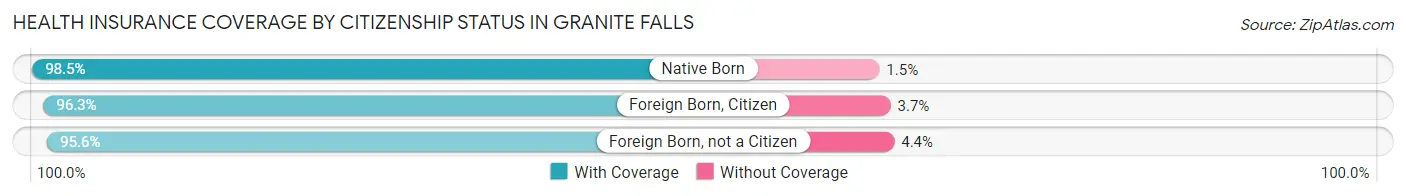
| Citizenship Status | With Coverage | Without Coverage |
| Native Born | 461 (98.5%) | 7 (1.5%) |
| Foreign Born, Citizen | 835 (96.3%) | 32 (3.7%) |
| Foreign Born, not a Citizen | 303 (95.6%) | 14 (4.4%) |
Health Insurance Coverage by Household Income in Granite Falls
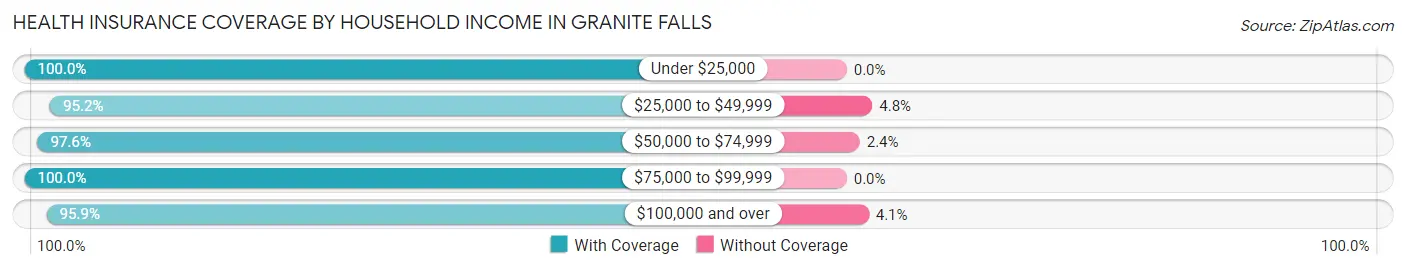
| Household Income | With Coverage | Without Coverage |
| Under $25,000 | 279 (100.0%) | 0 (0.0%) |
| $25,000 to $49,999 | 278 (95.2%) | 14 (4.8%) |
| $50,000 to $74,999 | 844 (97.6%) | 21 (2.4%) |
| $75,000 to $99,999 | 584 (100.0%) | 0 (0.0%) |
| $100,000 and over | 2,395 (95.9%) | 103 (4.1%) |
Public vs Private Health Insurance Coverage by Age in Granite Falls
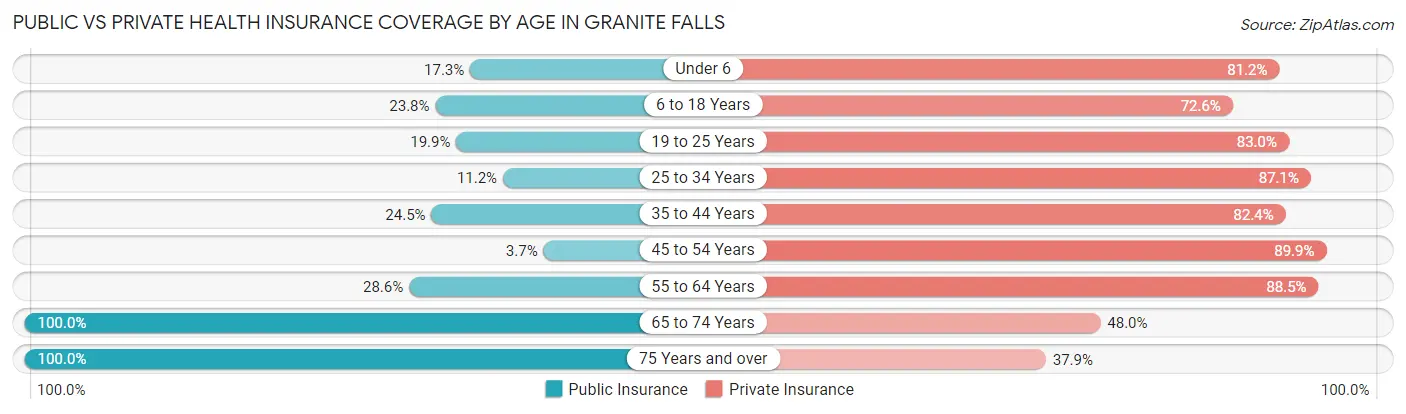
| Age Bracket | Public Insurance | Private Insurance |
| Under 6 | 81 (17.3%) | 380 (81.2%) |
| 6 to 18 Years | 206 (23.8%) | 629 (72.6%) |
| 19 to 25 Years | 63 (19.9%) | 263 (83.0%) |
| 25 to 34 Years | 84 (11.2%) | 652 (87.1%) |
| 35 to 44 Years | 157 (24.5%) | 528 (82.4%) |
| 45 to 54 Years | 15 (3.7%) | 366 (89.9%) |
| 55 to 64 Years | 169 (28.6%) | 522 (88.5%) |
| 65 to 74 Years | 273 (100.0%) | 131 (48.0%) |
| 75 Years and over | 206 (100.0%) | 78 (37.9%) |
| Total | 1,254 (27.8%) | 3,549 (78.5%) |
Disability Status by Sex by Age in Granite Falls
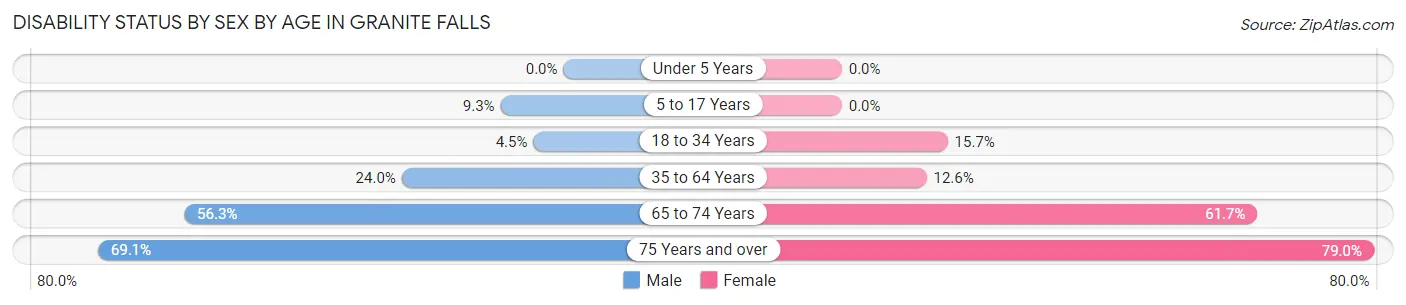
| Age Bracket | Male | Female |
| Under 5 Years | 0 (0.0%) | 0 (0.0%) |
| 5 to 17 Years | 37 (9.3%) | 0 (0.0%) |
| 18 to 34 Years | 19 (4.5%) | 105 (15.7%) |
| 35 to 64 Years | 212 (24.0%) | 95 (12.6%) |
| 65 to 74 Years | 67 (56.3%) | 95 (61.7%) |
| 75 Years and over | 47 (69.1%) | 109 (79.0%) |
Disability Class by Sex by Age in Granite Falls
Disability Class: Hearing Difficulty
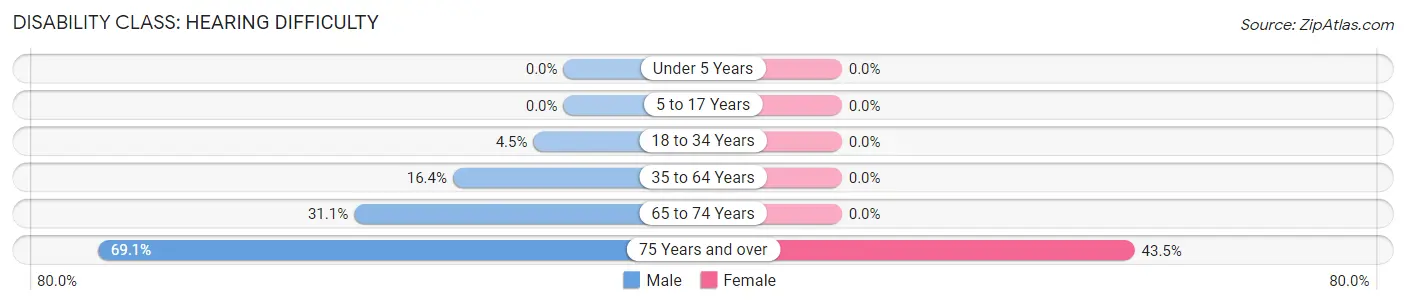
| Age Bracket | Male | Female |
| Under 5 Years | 0 (0.0%) | 0 (0.0%) |
| 5 to 17 Years | 0 (0.0%) | 0 (0.0%) |
| 18 to 34 Years | 19 (4.5%) | 0 (0.0%) |
| 35 to 64 Years | 145 (16.4%) | 0 (0.0%) |
| 65 to 74 Years | 37 (31.1%) | 0 (0.0%) |
| 75 Years and over | 47 (69.1%) | 60 (43.5%) |
Disability Class: Vision Difficulty
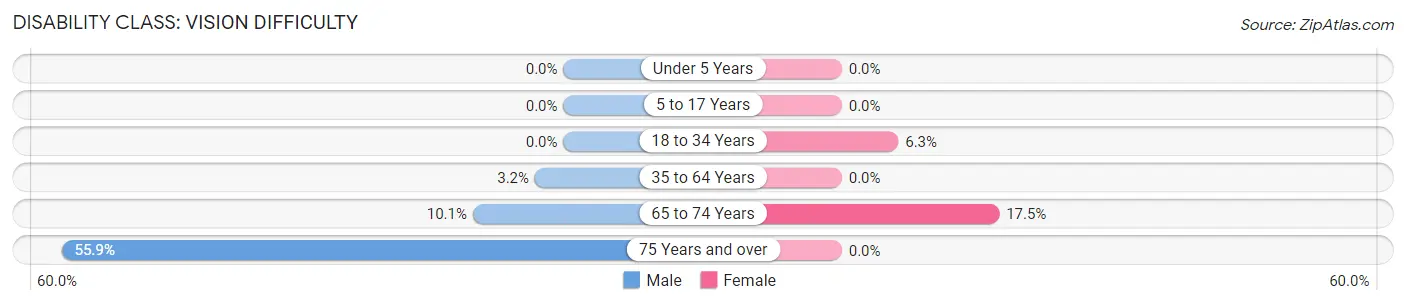
| Age Bracket | Male | Female |
| Under 5 Years | 0 (0.0%) | 0 (0.0%) |
| 5 to 17 Years | 0 (0.0%) | 0 (0.0%) |
| 18 to 34 Years | 0 (0.0%) | 42 (6.3%) |
| 35 to 64 Years | 28 (3.2%) | 0 (0.0%) |
| 65 to 74 Years | 12 (10.1%) | 27 (17.5%) |
| 75 Years and over | 38 (55.9%) | 0 (0.0%) |
Disability Class: Cognitive Difficulty
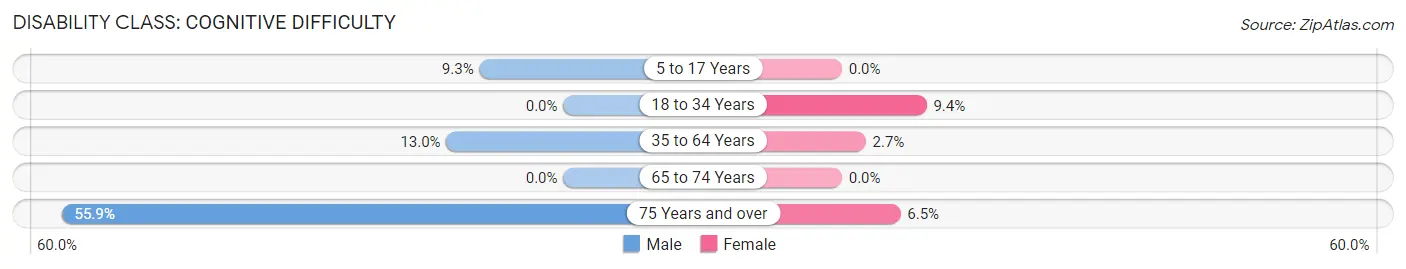
| Age Bracket | Male | Female |
| 5 to 17 Years | 37 (9.3%) | 0 (0.0%) |
| 18 to 34 Years | 0 (0.0%) | 63 (9.4%) |
| 35 to 64 Years | 115 (13.0%) | 20 (2.6%) |
| 65 to 74 Years | 0 (0.0%) | 0 (0.0%) |
| 75 Years and over | 38 (55.9%) | 9 (6.5%) |
Disability Class: Ambulatory Difficulty
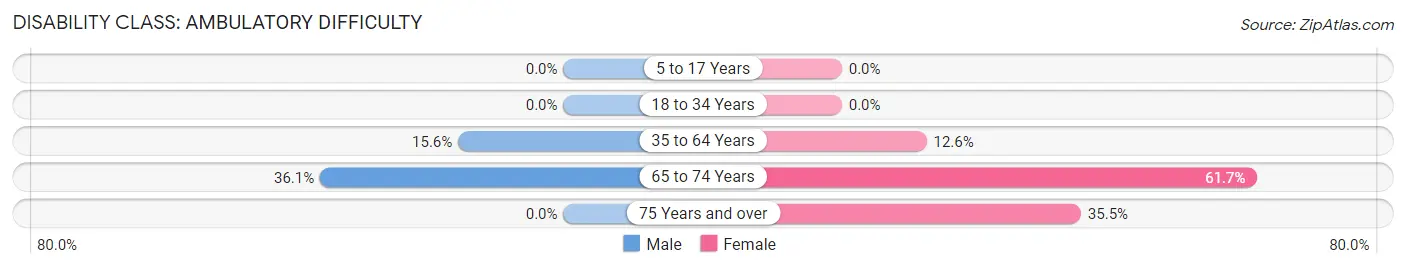
| Age Bracket | Male | Female |
| 5 to 17 Years | 0 (0.0%) | 0 (0.0%) |
| 18 to 34 Years | 0 (0.0%) | 0 (0.0%) |
| 35 to 64 Years | 138 (15.6%) | 95 (12.6%) |
| 65 to 74 Years | 43 (36.1%) | 95 (61.7%) |
| 75 Years and over | 0 (0.0%) | 49 (35.5%) |
Disability Class: Self-Care Difficulty
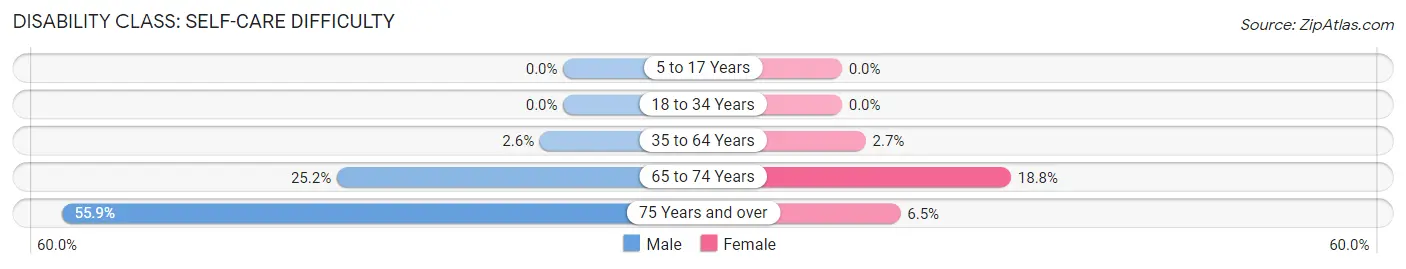
| Age Bracket | Male | Female |
| 5 to 17 Years | 0 (0.0%) | 0 (0.0%) |
| 18 to 34 Years | 0 (0.0%) | 0 (0.0%) |
| 35 to 64 Years | 23 (2.6%) | 20 (2.6%) |
| 65 to 74 Years | 30 (25.2%) | 29 (18.8%) |
| 75 Years and over | 38 (55.9%) | 9 (6.5%) |
Technology Access in Granite Falls
Computing Device Access in Granite Falls
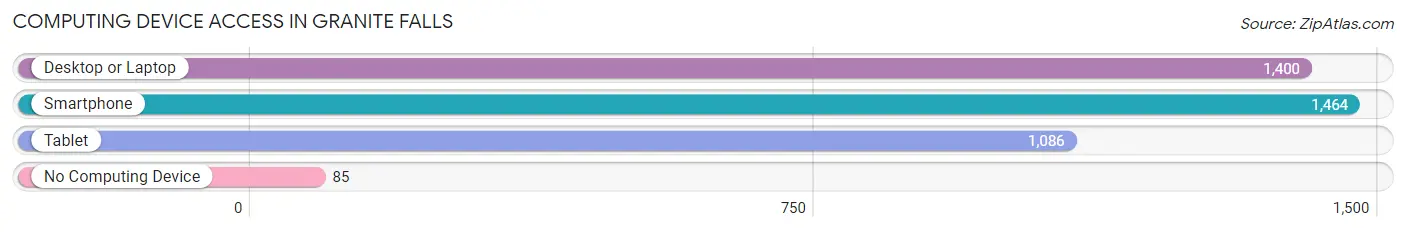
| Device Type | # Households | % Households |
| Desktop or Laptop | 1,400 | 82.6% |
| Smartphone | 1,464 | 86.4% |
| Tablet | 1,086 | 64.1% |
| No Computing Device | 85 | 5.0% |
| Total | 1,694 | 100.0% |
Internet Access in Granite Falls
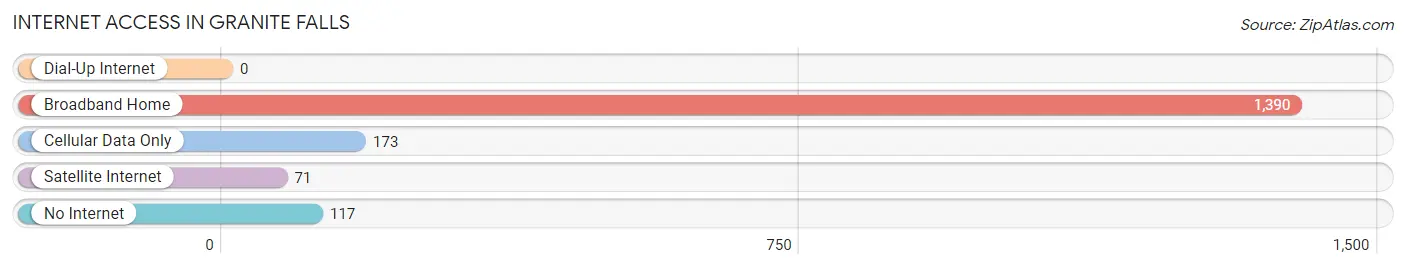
| Internet Type | # Households | % Households |
| Dial-Up Internet | 0 | 0.0% |
| Broadband Home | 1,390 | 82.1% |
| Cellular Data Only | 173 | 10.2% |
| Satellite Internet | 71 | 4.2% |
| No Internet | 117 | 6.9% |
| Total | 1,694 | 100.0% |
Granite Falls Summary
Granite Falls is a small city located in Snohomish County, Washington, United States. It is situated along the Stillaguamish River, approximately 25 miles northeast of Everett and 40 miles north of Seattle. The city is home to a population of approximately 3,500 people, and is part of the Seattle metropolitan area.
History
Granite Falls was first settled in the late 1800s by homesteaders who were attracted to the area by its abundant natural resources. The city was officially incorporated in 1910, and was named after the nearby Granite Falls, a waterfall on the Stillaguamish River. The city was initially a logging and farming community, and the local economy was largely based on the timber industry. In the early 1900s, the city was home to several sawmills and logging camps, and the local economy was further bolstered by the construction of the Great Northern Railway in 1910.
In the mid-1900s, the city began to transition away from its reliance on the timber industry, and began to focus on other industries such as tourism and manufacturing. The city was home to several manufacturing plants, including a paper mill and a cannery. In the late 1900s, the city began to focus on tourism, and the local economy was further bolstered by the construction of several recreational facilities, including a golf course and a ski resort.
Geography
Granite Falls is located in Snohomish County, Washington, approximately 25 miles northeast of Everett and 40 miles north of Seattle. The city is situated along the Stillaguamish River, and is surrounded by the Cascade Mountains to the east and the Olympic Mountains to the west. The city has a total area of 2.3 square miles, and is located at an elevation of approximately 500 feet.
The climate in Granite Falls is classified as a temperate maritime climate, with warm summers and mild winters. The average annual temperature is approximately 50 degrees Fahrenheit, and the average annual precipitation is approximately 40 inches.
Economy
Granite Falls is a small city with a population of approximately 3,500 people, and the local economy is largely based on tourism and manufacturing. The city is home to several manufacturing plants, including a paper mill and a cannery. The city is also home to several recreational facilities, including a golf course and a ski resort.
The city is also home to several small businesses, including restaurants, retail stores, and service providers. The city is also home to several educational institutions, including a community college and a technical college.
Demographics
As of the 2010 census, the population of Granite Falls was 3,521, with a population density of 1,521 people per square mile. The median age of the population was 38.7 years, and the median household income was $50,945. The racial makeup of the city was 87.3% White, 4.2% Hispanic or Latino, 2.2% Asian, 1.7% African American, and 0.8% Native American.
Conclusion
Granite Falls is a small city located in Snohomish County, Washington, United States. It is situated along the Stillaguamish River, approximately 25 miles northeast of Everett and 40 miles north of Seattle. The city is home to a population of approximately 3,500 people, and is part of the Seattle metropolitan area. The local economy is largely based on tourism and manufacturing, and the city is home to several recreational facilities, including a golf course and a ski resort. The population of Granite Falls is largely White, with a median age of 38.7 years and a median household income of $50,945.
Common Questions
What is Per Capita Income in Granite Falls?
Per Capita income in Granite Falls is $35,371.
What is the Median Family Income in Granite Falls?
Median Family Income in Granite Falls is $100,385.
What is the Median Household income in Granite Falls?
Median Household Income in Granite Falls is $87,600.
What is Income or Wage Gap in Granite Falls?
Income or Wage Gap in Granite Falls is 43.7%.
Women in Granite Falls earn 56.3 cents for every dollar earned by a man.
What is Family Income Deficit in Granite Falls?
Family Income Deficit in Granite Falls is $10,937.
Families that are below poverty line in Granite Falls earn $10,937 less on average than the poverty threshold level.
What is Inequality or Gini Index in Granite Falls?
Inequality or Gini Index in Granite Falls is 0.33.
What is the Total Population of Granite Falls?
Total Population of Granite Falls is 4,567.
What is the Total Male Population of Granite Falls?
Total Male Population of Granite Falls is 2,170.
What is the Total Female Population of Granite Falls?
Total Female Population of Granite Falls is 2,397.
What is the Ratio of Males per 100 Females in Granite Falls?
There are 90.53 Males per 100 Females in Granite Falls.
What is the Ratio of Females per 100 Males in Granite Falls?
There are 110.46 Females per 100 Males in Granite Falls.
What is the Median Population Age in Granite Falls?
Median Population Age in Granite Falls is 33.1 Years.
What is the Average Family Size in Granite Falls
Average Family Size in Granite Falls is 3.4 People.
What is the Average Household Size in Granite Falls
Average Household Size in Granite Falls is 2.7 People.
How Large is the Labor Force in Granite Falls?
There are 2,125 People in the Labor Forcein in Granite Falls.
What is the Percentage of People in the Labor Force in Granite Falls?
63.4% of People are in the Labor Force in Granite Falls.
What is the Unemployment Rate in Granite Falls?
Unemployment Rate in Granite Falls is 1.0%.