Markham, WA Map & Demographics
Markham Map
Markham Overview
$50,217
PER CAPITA INCOME
$87,212
AVG FAMILY INCOME
$64,792
AVG HOUSEHOLD INCOME
0.31
INEQUALITY / GINI INDEX
132
TOTAL POPULATION
50
MALE POPULATION
82
FEMALE POPULATION
60.98
MALES / 100 FEMALES
164.00
FEMALES / 100 MALES
65.8
MEDIAN AGE
2.1
AVG FAMILY SIZE
1.8
AVG HOUSEHOLD SIZE
41
LABOR FORCE [ PEOPLE ]
31.1%
PERCENT IN LABOR FORCE
Income in Markham
Income Overview in Markham
Per Capita Income in Markham is $50,217, while median incomes of families and households are $87,212 and $64,792 respectively.
| Characteristic | Number | Measure |
| Per Capita Income | 132 | $50,217 |
| Median Family Income | 51 | $87,212 |
| Mean Family Income | 51 | $107,178 |
| Median Household Income | 75 | $64,792 |
| Mean Household Income | 75 | $86,369 |
| Income Deficit | 51 | $0 |
| Wage / Income Gap (%) | 132 | 0.00% |
| Wage / Income Gap ($) | 132 | 100.00¢ per $1 |
| Gini / Inequality Index | 132 | 0.31 |
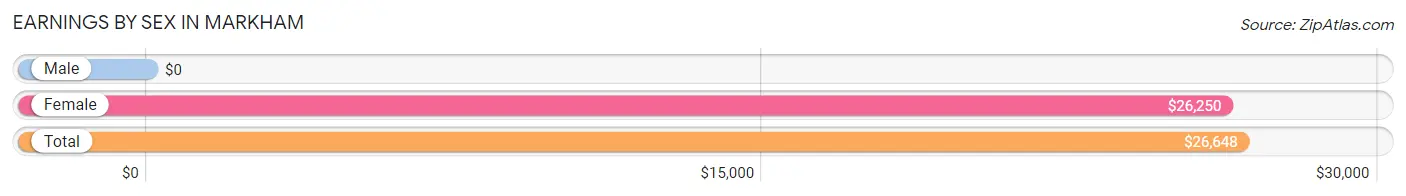
Earnings by Sex in Markham
| Sex | Number | Average Earnings |
| Male | 7 (17.1%) | $0 |
| Female | 34 (82.9%) | $26,250 |
| Total | 41 (100.0%) | $26,648 |
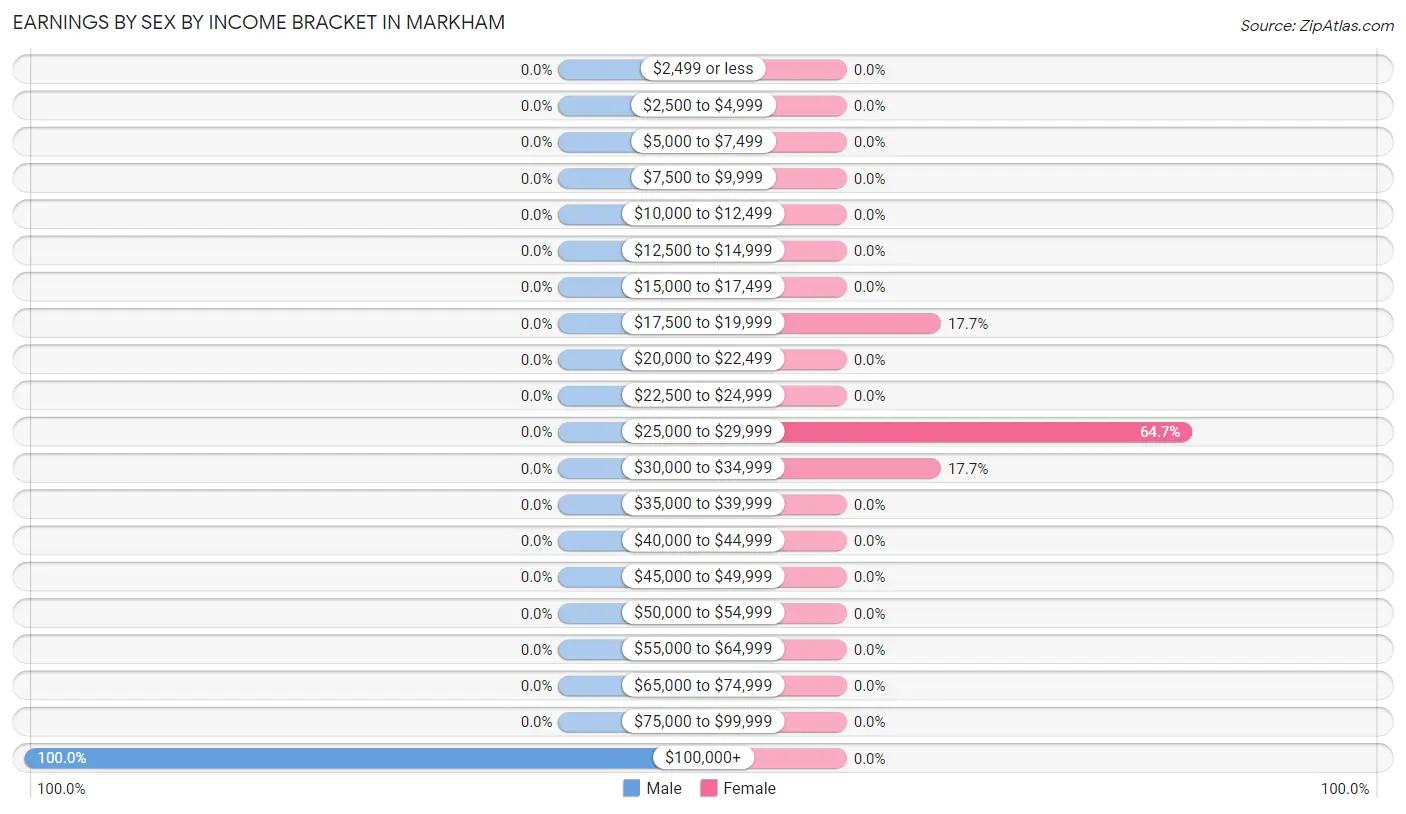
Earnings by Sex by Income Bracket in Markham
The most common earnings brackets in Markham are $100,000+ for men (7 | 100.0%) and $25,000 to $29,999 for women (22 | 64.7%).
| Income | Male | Female |
| $2,499 or less | 0 (0.0%) | 0 (0.0%) |
| $2,500 to $4,999 | 0 (0.0%) | 0 (0.0%) |
| $5,000 to $7,499 | 0 (0.0%) | 0 (0.0%) |
| $7,500 to $9,999 | 0 (0.0%) | 0 (0.0%) |
| $10,000 to $12,499 | 0 (0.0%) | 0 (0.0%) |
| $12,500 to $14,999 | 0 (0.0%) | 0 (0.0%) |
| $15,000 to $17,499 | 0 (0.0%) | 0 (0.0%) |
| $17,500 to $19,999 | 0 (0.0%) | 6 (17.6%) |
| $20,000 to $22,499 | 0 (0.0%) | 0 (0.0%) |
| $22,500 to $24,999 | 0 (0.0%) | 0 (0.0%) |
| $25,000 to $29,999 | 0 (0.0%) | 22 (64.7%) |
| $30,000 to $34,999 | 0 (0.0%) | 6 (17.6%) |
| $35,000 to $39,999 | 0 (0.0%) | 0 (0.0%) |
| $40,000 to $44,999 | 0 (0.0%) | 0 (0.0%) |
| $45,000 to $49,999 | 0 (0.0%) | 0 (0.0%) |
| $50,000 to $54,999 | 0 (0.0%) | 0 (0.0%) |
| $55,000 to $64,999 | 0 (0.0%) | 0 (0.0%) |
| $65,000 to $74,999 | 0 (0.0%) | 0 (0.0%) |
| $75,000 to $99,999 | 0 (0.0%) | 0 (0.0%) |
| $100,000+ | 7 (100.0%) | 0 (0.0%) |
| Total | 7 (100.0%) | 34 (100.0%) |
Earnings by Sex by Educational Attainment in Markham
| Educational Attainment | Male Income | Female Income |
| Less than High School | - | - |
| High School Diploma | - | - |
| College or Associate's Degree | - | - |
| Bachelor's Degree | - | - |
| Graduate Degree | - | - |
| Total | - | - |
Family Income in Markham
Family Income Brackets in Markham
According to the Markham family income data, there are 16 families falling into the $75,000 to $99,999 income range, which is the most common income bracket and makes up 31.4% of all families.
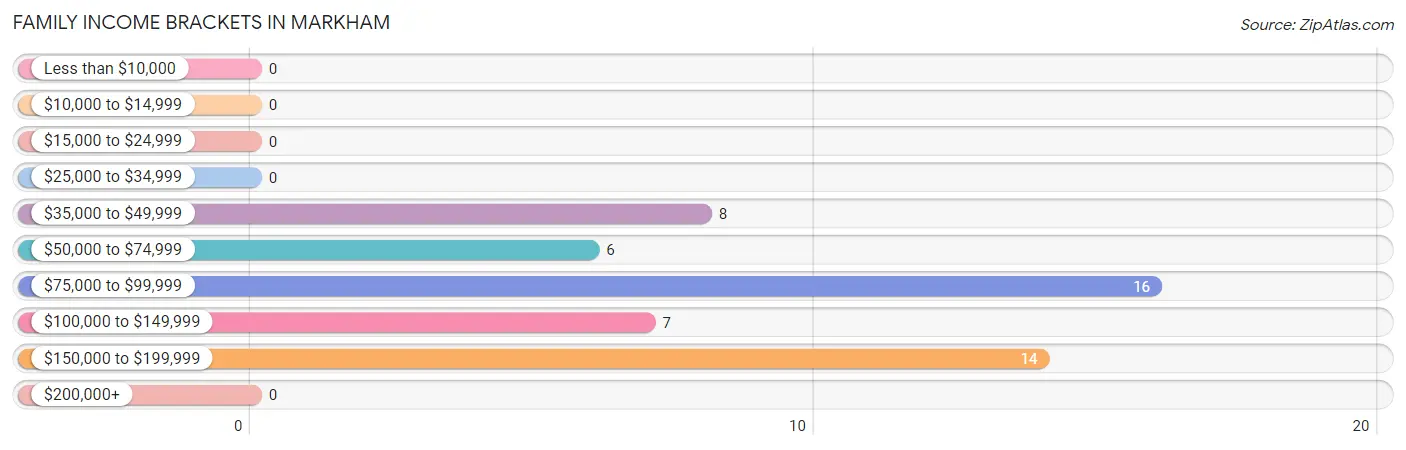
| Income Bracket | # Families | % Families |
| Less than $10,000 | 0 | 0.0% |
| $10,000 to $14,999 | 0 | 0.0% |
| $15,000 to $24,999 | 0 | 0.0% |
| $25,000 to $34,999 | 0 | 0.0% |
| $35,000 to $49,999 | 8 | 15.7% |
| $50,000 to $74,999 | 6 | 11.8% |
| $75,000 to $99,999 | 16 | 31.4% |
| $100,000 to $149,999 | 7 | 13.7% |
| $150,000 to $199,999 | 14 | 27.5% |
| $200,000+ | 0 | 0.0% |
Family Income by Famaliy Size in Markham
2-person families (51 | 100.0%) account for the highest median family income in Markham with $87,212 per family, while 2-person families (51 | 100.0%) have the highest median income of $43,606 per family member.
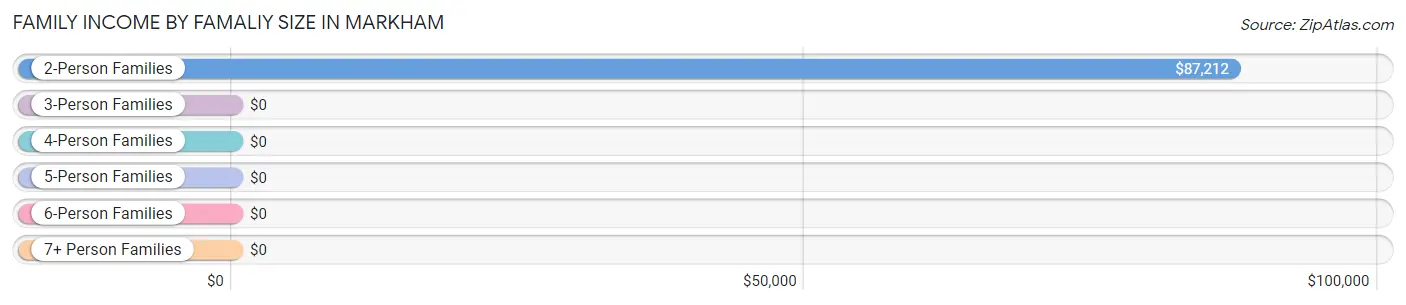
| Income Bracket | # Families | Median Income |
| 2-Person Families | 51 (100.0%) | $87,212 |
| 3-Person Families | 0 (0.0%) | $0 |
| 4-Person Families | 0 (0.0%) | $0 |
| 5-Person Families | 0 (0.0%) | $0 |
| 6-Person Families | 0 (0.0%) | $0 |
| 7+ Person Families | 0 (0.0%) | $0 |
| Total | 51 (100.0%) | $87,212 |
Family Income by Number of Earners in Markham
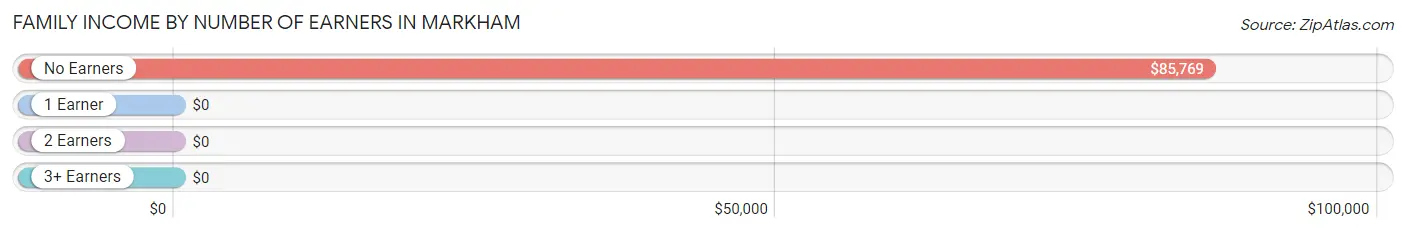
| Number of Earners | # Families | Median Income |
| No Earners | 24 (47.1%) | $85,769 |
| 1 Earner | 20 (39.2%) | $0 |
| 2 Earners | 7 (13.7%) | $0 |
| 3+ Earners | 0 (0.0%) | $0 |
| Total | 51 (100.0%) | $87,212 |
Household Income in Markham
Household Income Brackets in Markham
With 32 households falling in the category, the $35,000 to $49,999 income range is the most frequent in Markham, accounting for 42.7% of all households.
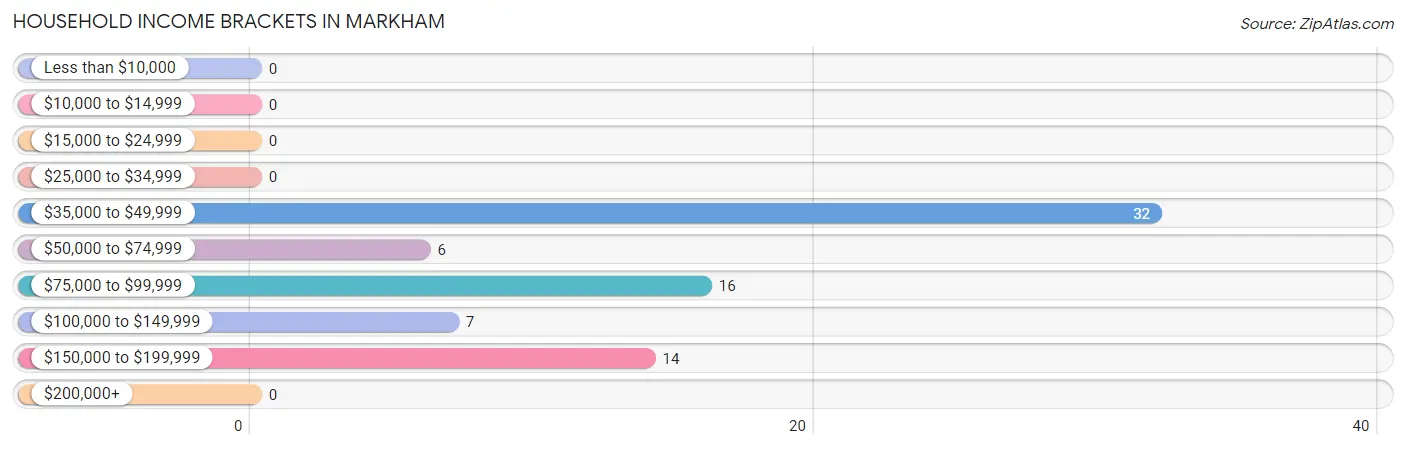
| Income Bracket | # Households | % Households |
| Less than $10,000 | 0 | 0.0% |
| $10,000 to $14,999 | 0 | 0.0% |
| $15,000 to $24,999 | 0 | 0.0% |
| $25,000 to $34,999 | 0 | 0.0% |
| $35,000 to $49,999 | 32 | 42.7% |
| $50,000 to $74,999 | 6 | 8.0% |
| $75,000 to $99,999 | 16 | 21.3% |
| $100,000 to $149,999 | 7 | 9.3% |
| $150,000 to $199,999 | 14 | 18.7% |
| $200,000+ | 0 | 0.0% |
Household Income by Householder Age in Markham
| Income Bracket | # Households | Median Income |
| 15 to 24 Years | 0 (0.0%) | $0 |
| 25 to 44 Years | 0 (0.0%) | $0 |
| 45 to 64 Years | 13 (17.3%) | $0 |
| 65+ Years | 62 (82.7%) | $0 |
| Total | 75 (100.0%) | $64,792 |
Poverty in Markham
Income Below Poverty by Sex and Age in Markham
| Age Bracket | Male | Female |
| Under 5 Years | 0 (0.0%) | 0 (0.0%) |
| 5 Years | 0 (0.0%) | 0 (0.0%) |
| 6 to 11 Years | 0 (0.0%) | 0 (0.0%) |
| 12 to 14 Years | 0 (0.0%) | 0 (0.0%) |
| 15 Years | 0 (0.0%) | 0 (0.0%) |
| 16 and 17 Years | 0 (0.0%) | 0 (0.0%) |
| 18 to 24 Years | 0 (0.0%) | 0 (0.0%) |
| 25 to 34 Years | 0 (0.0%) | 0 (0.0%) |
| 35 to 44 Years | 0 (0.0%) | 0 (0.0%) |
| 45 to 54 Years | 0 (0.0%) | 0 (0.0%) |
| 55 to 64 Years | 0 (0.0%) | 0 (0.0%) |
| 65 to 74 Years | 0 (0.0%) | 0 (0.0%) |
| 75 Years and over | 0 (0.0%) | 0 (0.0%) |
| Total | 0 (0.0%) | 0 (0.0%) |
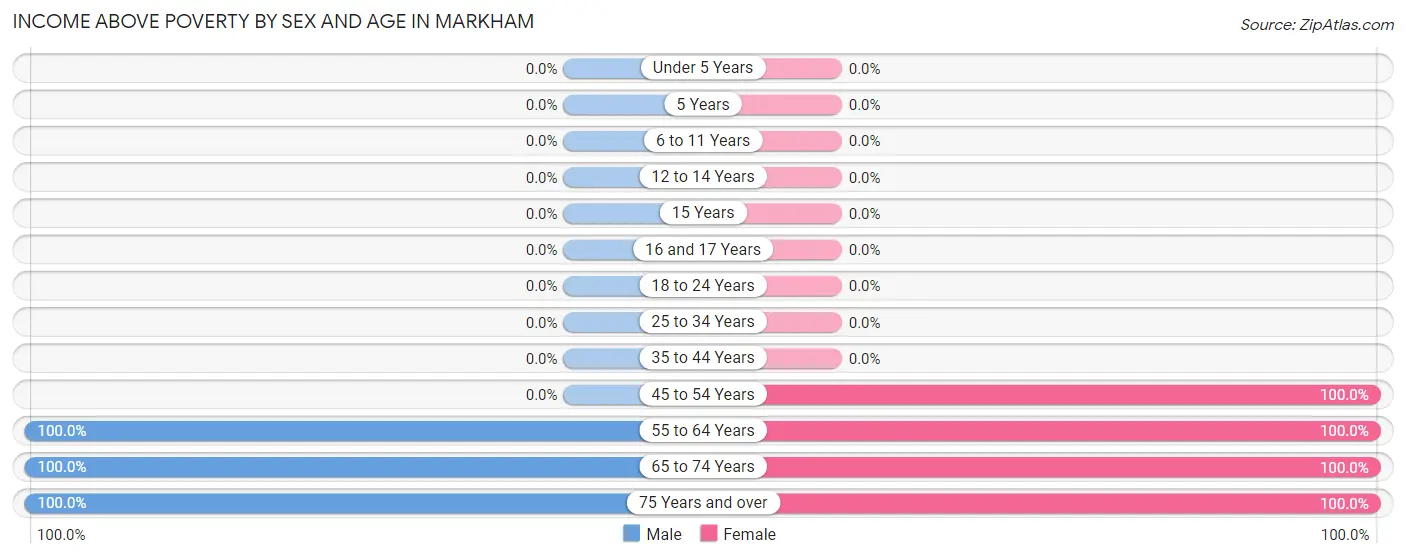
Income Above Poverty by Sex and Age in Markham
According to the poverty statistics in Markham, males aged 55 to 64 years and females aged 45 to 54 years are the age groups that are most secure financially, with 100.0% of males and 100.0% of females in these age groups living above the poverty line.
| Age Bracket | Male | Female |
| Under 5 Years | 0 (0.0%) | 0 (0.0%) |
| 5 Years | 0 (0.0%) | 0 (0.0%) |
| 6 to 11 Years | 0 (0.0%) | 0 (0.0%) |
| 12 to 14 Years | 0 (0.0%) | 0 (0.0%) |
| 15 Years | 0 (0.0%) | 0 (0.0%) |
| 16 and 17 Years | 0 (0.0%) | 0 (0.0%) |
| 18 to 24 Years | 0 (0.0%) | 0 (0.0%) |
| 25 to 34 Years | 0 (0.0%) | 0 (0.0%) |
| 35 to 44 Years | 0 (0.0%) | 0 (0.0%) |
| 45 to 54 Years | 0 (0.0%) | 28 (100.0%) |
| 55 to 64 Years | 12 (100.0%) | 6 (100.0%) |
| 65 to 74 Years | 27 (100.0%) | 27 (100.0%) |
| 75 Years and over | 11 (100.0%) | 21 (100.0%) |
| Total | 50 (100.0%) | 82 (100.0%) |
Income Below Poverty Among Married-Couple Families in Markham
| Children | Above Poverty | Below Poverty |
| No Children | 37 (100.0%) | 0 (0.0%) |
| 1 or 2 Children | 0 (0.0%) | 0 (0.0%) |
| 3 or 4 Children | 0 (0.0%) | 0 (0.0%) |
| 5 or more Children | 0 (0.0%) | 0 (0.0%) |
| Total | 37 (100.0%) | 0 (0.0%) |
Income Below Poverty Among Single-Parent Households in Markham
| Children | Single Father | Single Mother |
| No Children | 0 (0.0%) | 0 (0.0%) |
| 1 or 2 Children | 0 (0.0%) | 0 (0.0%) |
| 3 or 4 Children | 0 (0.0%) | 0 (0.0%) |
| 5 or more Children | 0 (0.0%) | 0 (0.0%) |
| Total | 0 (0.0%) | 0 (0.0%) |
Income Below Poverty Among Married-Couple vs Single-Parent Households in Markham
| Children | Married-Couple Families | Single-Parent Households |
| No Children | 0 (0.0%) | 0 (0.0%) |
| 1 or 2 Children | 0 (0.0%) | 0 (0.0%) |
| 3 or 4 Children | 0 (0.0%) | 0 (0.0%) |
| 5 or more Children | 0 (0.0%) | 0 (0.0%) |
| Total | 0 (0.0%) | 0 (0.0%) |
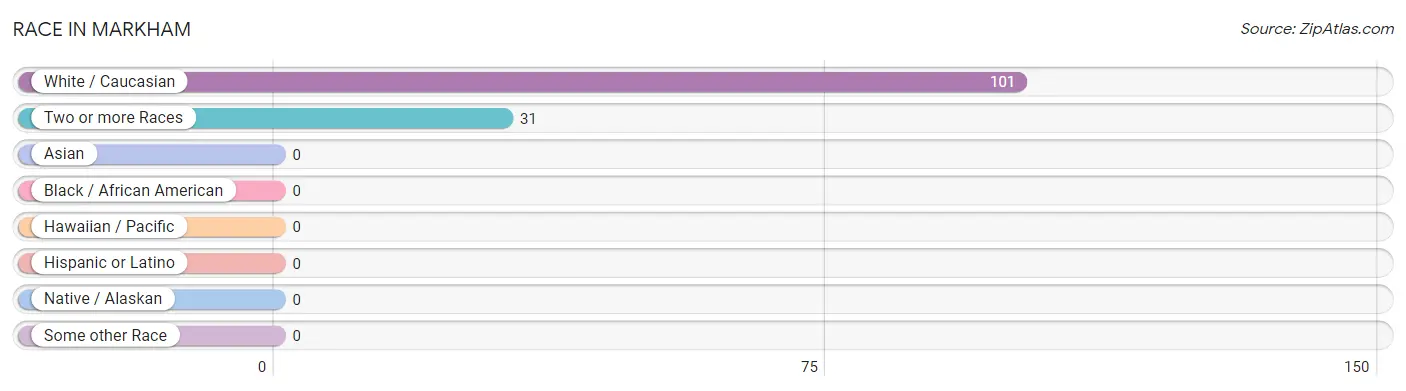
Race in Markham
The most populous races in Markham are White / Caucasian (101 | 76.5%), and Two or more Races (31 | 23.5%).
| Race | # Population | % Population |
| Asian | 0 | 0.0% |
| Black / African American | 0 | 0.0% |
| Hawaiian / Pacific | 0 | 0.0% |
| Hispanic or Latino | 0 | 0.0% |
| Native / Alaskan | 0 | 0.0% |
| White / Caucasian | 101 | 76.5% |
| Two or more Races | 31 | 23.5% |
| Some other Race | 0 | 0.0% |
| Total | 132 | 100.0% |
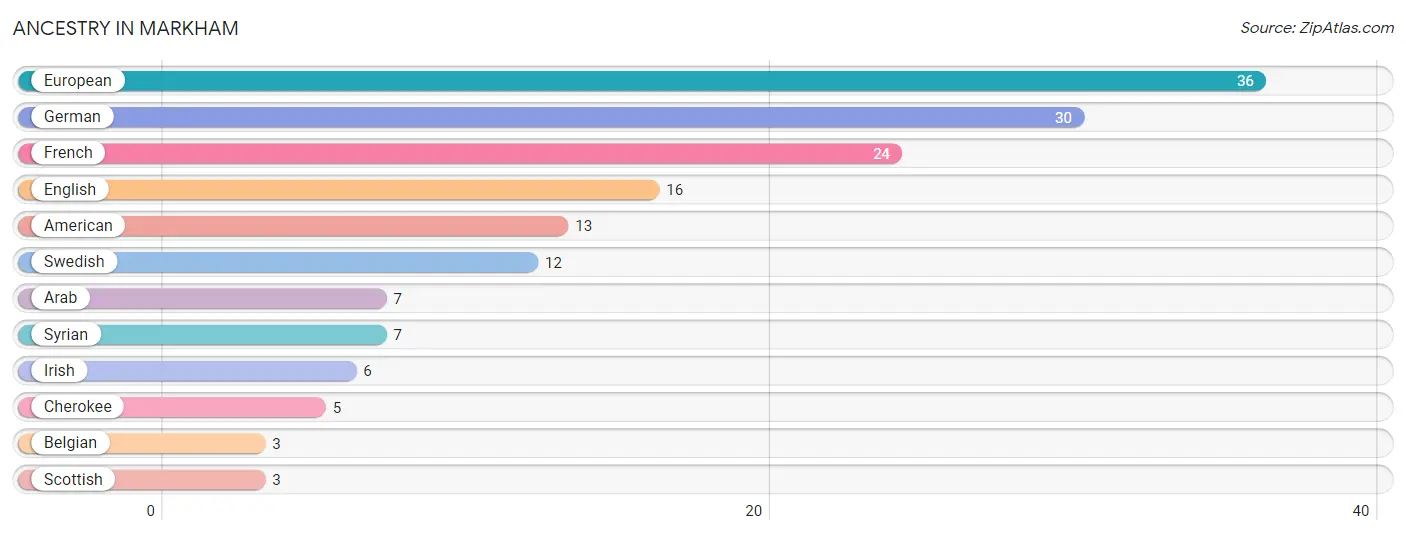
Ancestry in Markham
The most populous ancestries reported in Markham are European (36 | 27.3%), German (30 | 22.7%), French (24 | 18.2%), English (16 | 12.1%), and American (13 | 9.9%), together accounting for 90.1% of all Markham residents.
| Ancestry | # Population | % Population |
| American | 13 | 9.9% |
| Arab | 7 | 5.3% |
| Belgian | 3 | 2.3% |
| Cherokee | 5 | 3.8% |
| English | 16 | 12.1% |
| European | 36 | 27.3% |
| French | 24 | 18.2% |
| German | 30 | 22.7% |
| Irish | 6 | 4.5% |
| Scottish | 3 | 2.3% |
| Swedish | 12 | 9.1% |
| Syrian | 7 | 5.3% | View All 12 Rows |
Immigrants in Markham

| Immigration Origin | # Population | % Population | View All 0 Rows |
Sex and Age in Markham
Sex and Age in Markham
The most populous age groups in Markham are 70 to 74 Years (27 | 54.0%) for men and 65 to 69 Years (24 | 29.3%) for women.
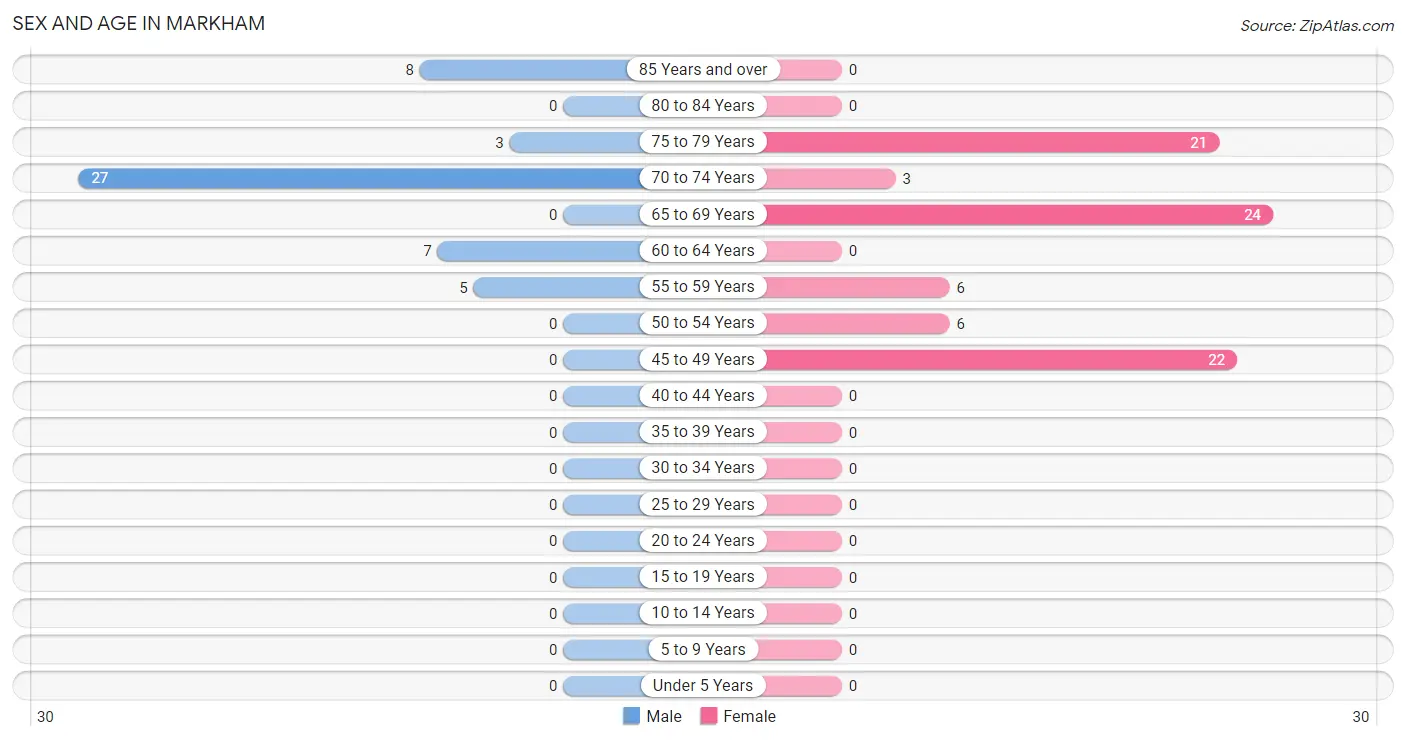
| Age Bracket | Male | Female |
| Under 5 Years | 0 (0.0%) | 0 (0.0%) |
| 5 to 9 Years | 0 (0.0%) | 0 (0.0%) |
| 10 to 14 Years | 0 (0.0%) | 0 (0.0%) |
| 15 to 19 Years | 0 (0.0%) | 0 (0.0%) |
| 20 to 24 Years | 0 (0.0%) | 0 (0.0%) |
| 25 to 29 Years | 0 (0.0%) | 0 (0.0%) |
| 30 to 34 Years | 0 (0.0%) | 0 (0.0%) |
| 35 to 39 Years | 0 (0.0%) | 0 (0.0%) |
| 40 to 44 Years | 0 (0.0%) | 0 (0.0%) |
| 45 to 49 Years | 0 (0.0%) | 22 (26.8%) |
| 50 to 54 Years | 0 (0.0%) | 6 (7.3%) |
| 55 to 59 Years | 5 (10.0%) | 6 (7.3%) |
| 60 to 64 Years | 7 (14.0%) | 0 (0.0%) |
| 65 to 69 Years | 0 (0.0%) | 24 (29.3%) |
| 70 to 74 Years | 27 (54.0%) | 3 (3.7%) |
| 75 to 79 Years | 3 (6.0%) | 21 (25.6%) |
| 80 to 84 Years | 0 (0.0%) | 0 (0.0%) |
| 85 Years and over | 8 (16.0%) | 0 (0.0%) |
| Total | 50 (100.0%) | 82 (100.0%) |
Families and Households in Markham
Median Family Size in Markham
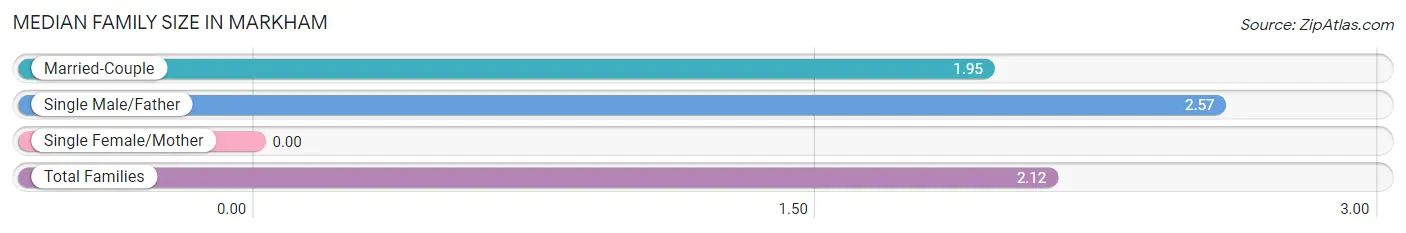
| Family Type | # Families | Family Size |
| Married-Couple | 37 (72.6%) | 1.95 |
| Single Male/Father | 14 (27.5%) | 2.57 |
| Single Female/Mother | 0 (0.0%) | - |
| Total Families | 51 (100.0%) | 2.12 |
Median Household Size in Markham
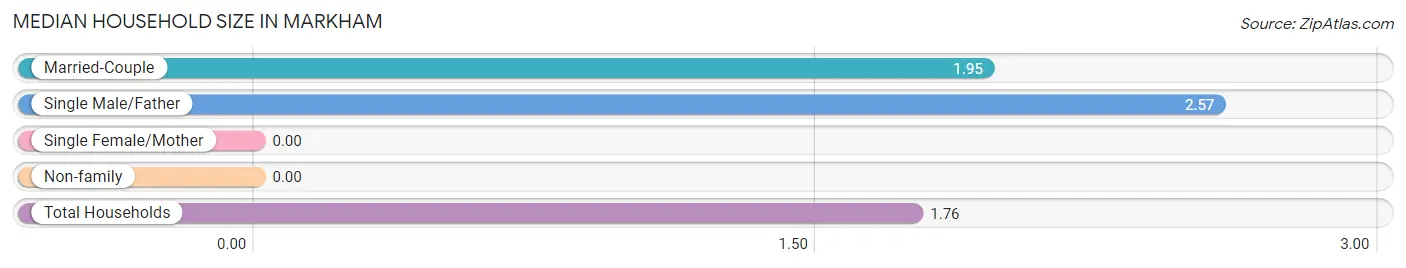
| Household Type | # Households | Household Size |
| Married-Couple | 37 (49.3%) | 1.95 |
| Single Male/Father | 14 (18.7%) | 2.57 |
| Single Female/Mother | 0 (0.0%) | - |
| Non-family | 24 (32.0%) | - |
| Total Households | 75 (100.0%) | 1.76 |
Household Size by Marriage Status in Markham
Out of a total of 75 households in Markham, 51 (68.0%) are family households, while 24 (32.0%) are nonfamily households. The most numerous type of family households are 2-person households, comprising 51, and the most common type of nonfamily households are 1-person households, comprising 24.
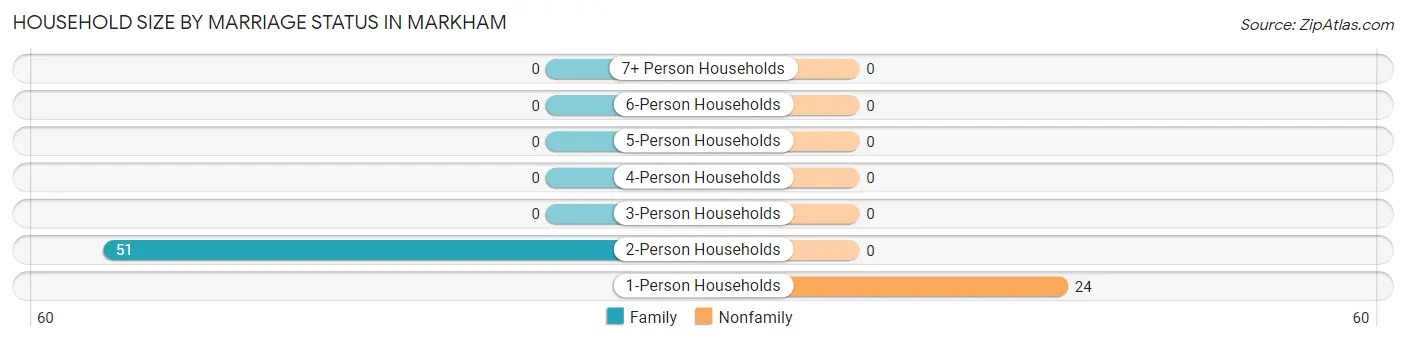
| Household Size | Family Households | Nonfamily Households |
| 1-Person Households | - | 24 (32.0%) |
| 2-Person Households | 51 (68.0%) | 0 (0.0%) |
| 3-Person Households | 0 (0.0%) | 0 (0.0%) |
| 4-Person Households | 0 (0.0%) | 0 (0.0%) |
| 5-Person Households | 0 (0.0%) | 0 (0.0%) |
| 6-Person Households | 0 (0.0%) | 0 (0.0%) |
| 7+ Person Households | 0 (0.0%) | 0 (0.0%) |
| Total | 51 (68.0%) | 24 (32.0%) |
Female Fertility in Markham
Fertility by Age in Markham
| Age Bracket | Women with Births | Births / 1,000 Women |
| 15 to 19 years | 0 (0.0%) | 0.0 |
| 20 to 34 years | 0 (0.0%) | 0.0 |
| 35 to 50 years | 0 (0.0%) | 0.0 |
| Total | 0 (0.0%) | 0.0 |
Fertility by Age by Marriage Status in Markham
| Age Bracket | Married | Unmarried |
| 15 to 19 years | 0 (0.0%) | 0 (0.0%) |
| 20 to 34 years | 0 (0.0%) | 0 (0.0%) |
| 35 to 50 years | 0 (0.0%) | 0 (0.0%) |
| Total | 0 (0.0%) | 0 (0.0%) |
Fertility by Education in Markham
| Educational Attainment | Women with Births | Births / 1,000 Women |
| Less than High School | 0 (0.0%) | 0.0 |
| High School Diploma | 0 (0.0%) | 0.0 |
| College or Associate's Degree | 0 (0.0%) | 0.0 |
| Bachelor's Degree | 0 (0.0%) | 0.0 |
| Graduate Degree | 0 (0.0%) | 0.0 |
| Total | 0 (0.0%) | 0.0 |
Fertility by Education by Marriage Status in Markham
| Educational Attainment | Married | Unmarried |
| Less than High School | 0 (0.0%) | 0 (0.0%) |
| High School Diploma | 0 (0.0%) | 0 (0.0%) |
| College or Associate's Degree | 0 (0.0%) | 0 (0.0%) |
| Bachelor's Degree | 0 (0.0%) | 0 (0.0%) |
| Graduate Degree | 0 (0.0%) | 0 (0.0%) |
| Total | 0 (0.0%) | 0 (0.0%) |
Employment Characteristics in Markham
Employment by Class of Employer in Markham
Among the 41 employed individuals in Markham, private company employees (35 | 85.4%), and state government employees (6 | 14.6%) make up the most common classes of employment.
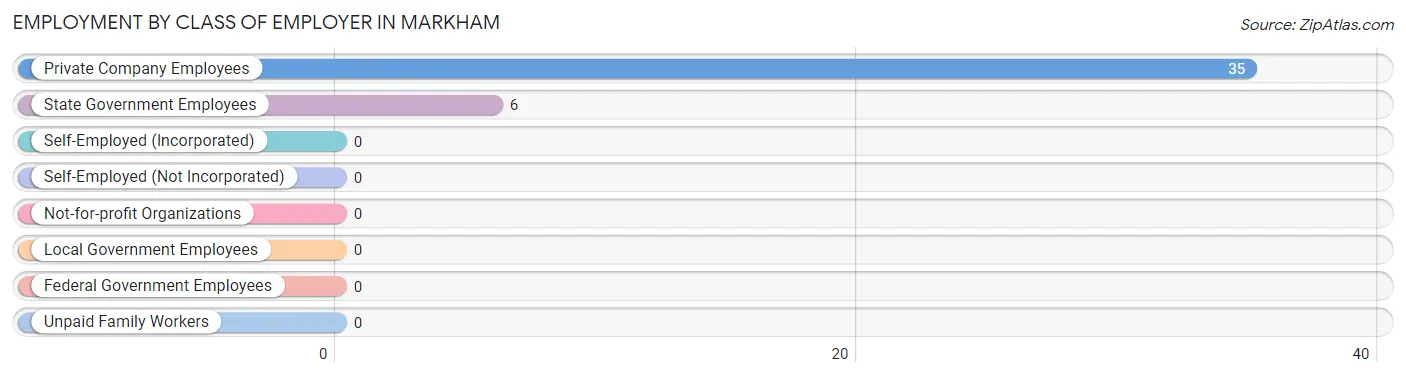
| Employer Class | # Employees | % Employees |
| Private Company Employees | 35 | 85.4% |
| Self-Employed (Incorporated) | 0 | 0.0% |
| Self-Employed (Not Incorporated) | 0 | 0.0% |
| Not-for-profit Organizations | 0 | 0.0% |
| Local Government Employees | 0 | 0.0% |
| State Government Employees | 6 | 14.6% |
| Federal Government Employees | 0 | 0.0% |
| Unpaid Family Workers | 0 | 0.0% |
| Total | 41 | 100.0% |
Employment Status by Age in Markham
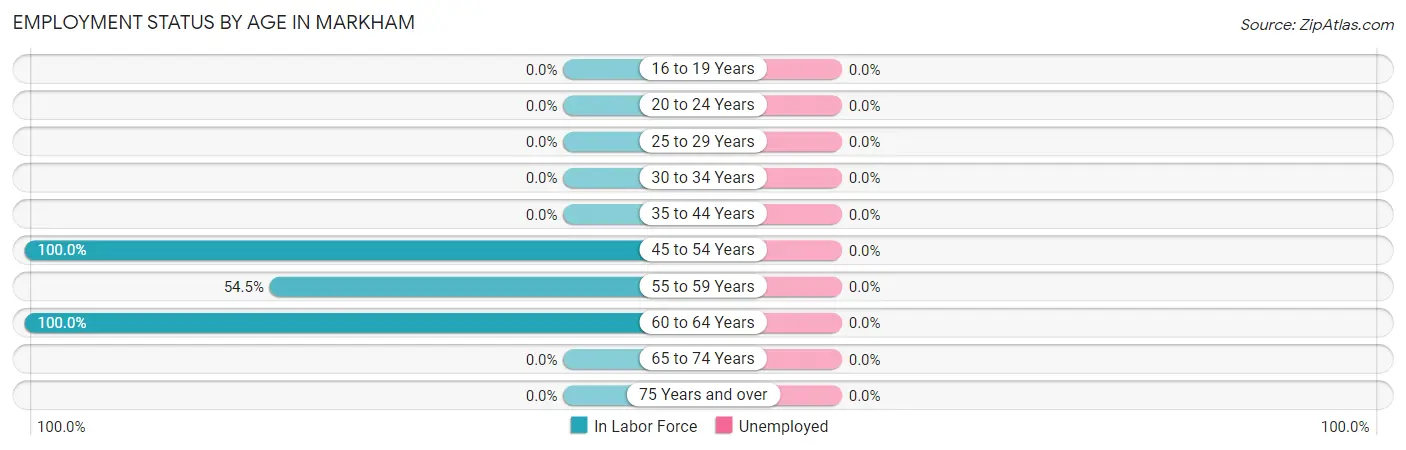
| Age Bracket | In Labor Force | Unemployed |
| 16 to 19 Years | 0 (0.0%) | 0 (0.0%) |
| 20 to 24 Years | 0 (0.0%) | 0 (0.0%) |
| 25 to 29 Years | 0 (0.0%) | 0 (0.0%) |
| 30 to 34 Years | 0 (0.0%) | 0 (0.0%) |
| 35 to 44 Years | 0 (0.0%) | 0 (0.0%) |
| 45 to 54 Years | 28 (100.0%) | 0 (0.0%) |
| 55 to 59 Years | 6 (54.5%) | 0 (0.0%) |
| 60 to 64 Years | 7 (100.0%) | 0 (0.0%) |
| 65 to 74 Years | 0 (0.0%) | 0 (0.0%) |
| 75 Years and over | 0 (0.0%) | 0 (0.0%) |
| Total | 41 (31.1%) | 0 (0.0%) |
Employment Status by Educational Attainment in Markham
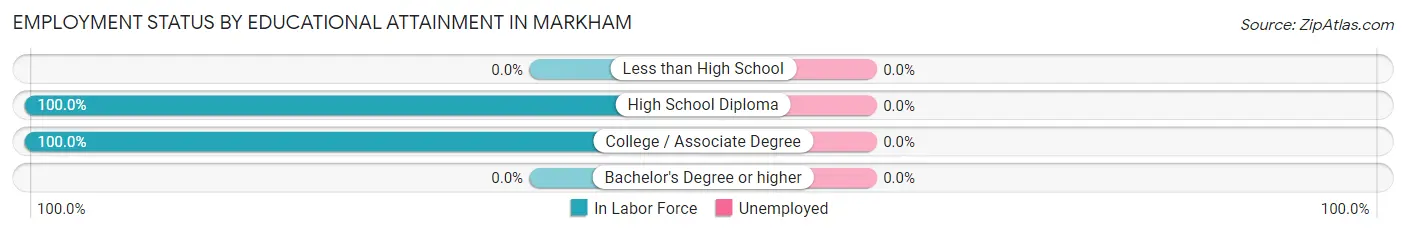
| Educational Attainment | In Labor Force | Unemployed |
| Less than High School | 0 (0.0%) | 0 (0.0%) |
| High School Diploma | 22 (100.0%) | 0 (0.0%) |
| College / Associate Degree | 19 (100.0%) | 0 (0.0%) |
| Bachelor's Degree or higher | 0 (0.0%) | 0 (0.0%) |
| Total | 41 (89.1%) | 0 (0.0%) |
Employment Occupations by Sex in Markham
Management, Business, Science and Arts Occupations
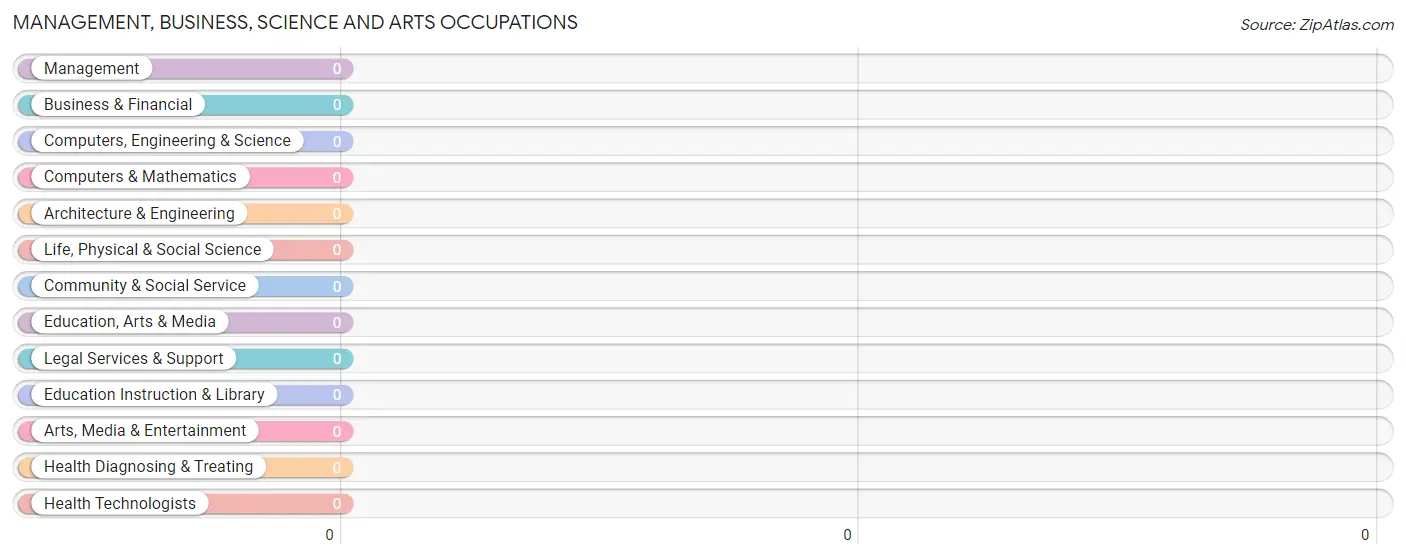
Management, Business, Science and Arts Occupations by Sex
| Occupation | Male | Female |
| Management | 0 (0.0%) | 0 (0.0%) |
| Business & Financial | 0 (0.0%) | 0 (0.0%) |
| Computers, Engineering & Science | 0 (0.0%) | 0 (0.0%) |
| Computers & Mathematics | 0 (0.0%) | 0 (0.0%) |
| Architecture & Engineering | 0 (0.0%) | 0 (0.0%) |
| Life, Physical & Social Science | 0 (0.0%) | 0 (0.0%) |
| Community & Social Service | 0 (0.0%) | 0 (0.0%) |
| Education, Arts & Media | 0 (0.0%) | 0 (0.0%) |
| Legal Services & Support | 0 (0.0%) | 0 (0.0%) |
| Education Instruction & Library | 0 (0.0%) | 0 (0.0%) |
| Arts, Media & Entertainment | 0 (0.0%) | 0 (0.0%) |
| Health Diagnosing & Treating | 0 (0.0%) | 0 (0.0%) |
| Health Technologists | 0 (0.0%) | 0 (0.0%) |
| Total (Category) | 0 (0.0%) | 0 (0.0%) |
| Total (Overall) | 7 (17.1%) | 34 (82.9%) |
Services Occupations
The most common Services occupations in Markham are , and Healthcare Support (6 | 14.6%).
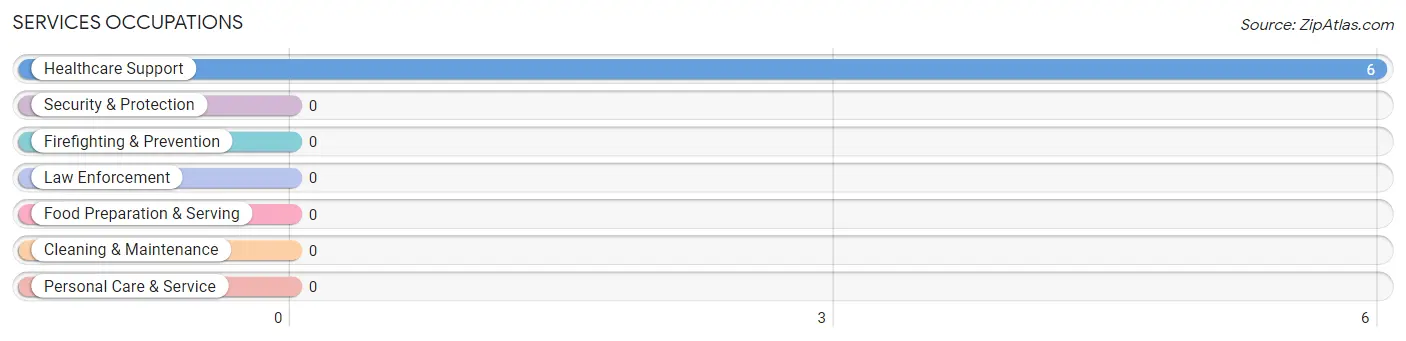
Services Occupations by Sex
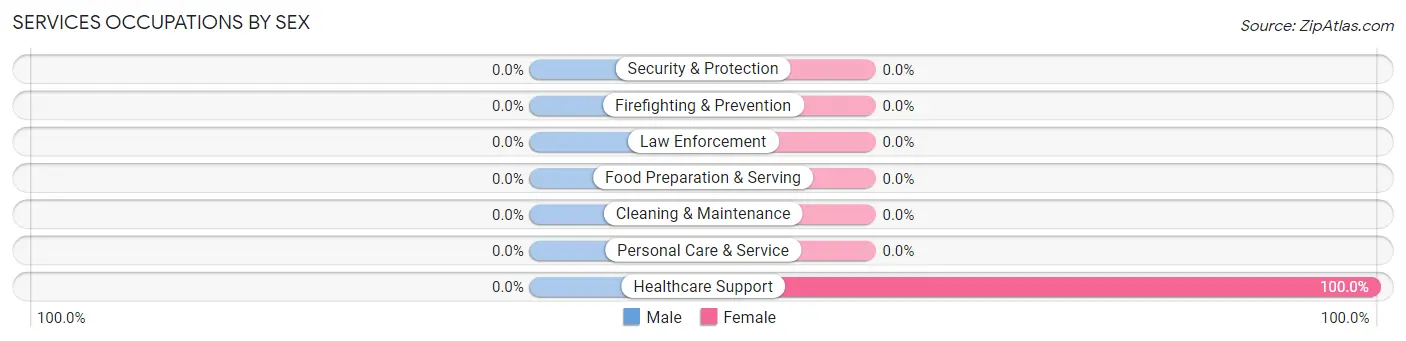
| Occupation | Male | Female |
| Healthcare Support | 0 (0.0%) | 6 (100.0%) |
| Security & Protection | 0 (0.0%) | 0 (0.0%) |
| Firefighting & Prevention | 0 (0.0%) | 0 (0.0%) |
| Law Enforcement | 0 (0.0%) | 0 (0.0%) |
| Food Preparation & Serving | 0 (0.0%) | 0 (0.0%) |
| Cleaning & Maintenance | 0 (0.0%) | 0 (0.0%) |
| Personal Care & Service | 0 (0.0%) | 0 (0.0%) |
| Total (Category) | 0 (0.0%) | 6 (100.0%) |
| Total (Overall) | 7 (17.1%) | 34 (82.9%) |
Sales and Office Occupations
The most common Sales and Office occupations in Markham are , and Office & Administration (6 | 14.6%).
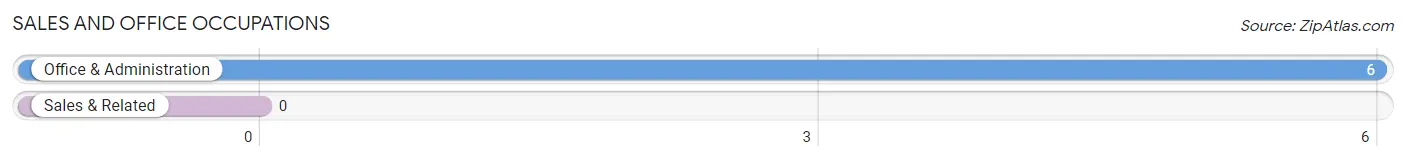
Sales and Office Occupations by Sex
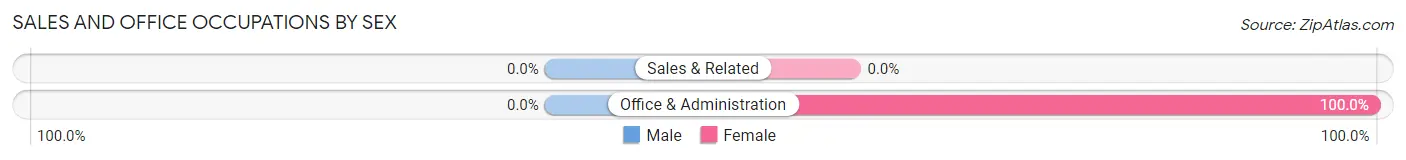
| Occupation | Male | Female |
| Sales & Related | 0 (0.0%) | 0 (0.0%) |
| Office & Administration | 0 (0.0%) | 6 (100.0%) |
| Total (Category) | 0 (0.0%) | 6 (100.0%) |
| Total (Overall) | 7 (17.1%) | 34 (82.9%) |
Natural Resources, Construction and Maintenance Occupations
The most common Natural Resources, Construction and Maintenance occupations in Markham are , and Installation, Maintenance & Repair (7 | 17.1%).
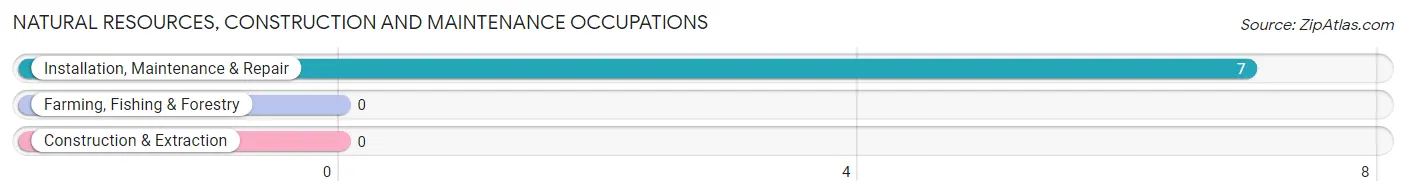
Natural Resources, Construction and Maintenance Occupations by Sex
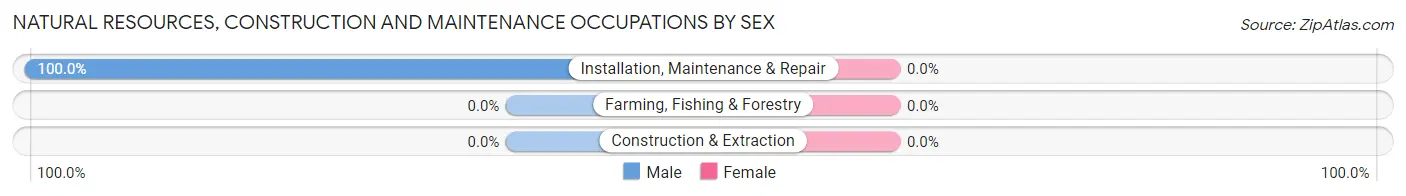
| Occupation | Male | Female |
| Farming, Fishing & Forestry | 0 (0.0%) | 0 (0.0%) |
| Construction & Extraction | 0 (0.0%) | 0 (0.0%) |
| Installation, Maintenance & Repair | 7 (100.0%) | 0 (0.0%) |
| Total (Category) | 7 (100.0%) | 0 (0.0%) |
| Total (Overall) | 7 (17.1%) | 34 (82.9%) |
Production, Transportation and Moving Occupations
The most common Production, Transportation and Moving occupations in Markham are , and Transportation (22 | 53.7%).
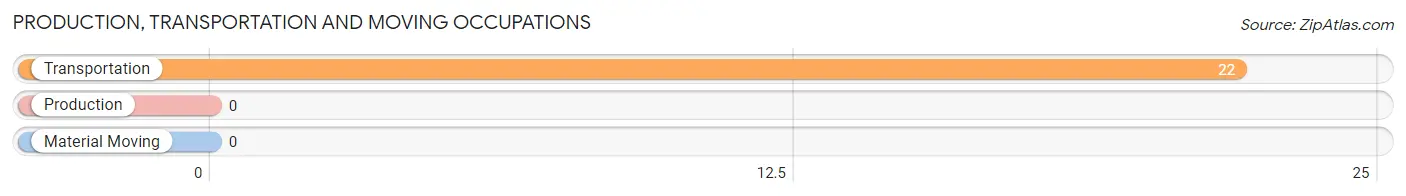
Production, Transportation and Moving Occupations by Sex
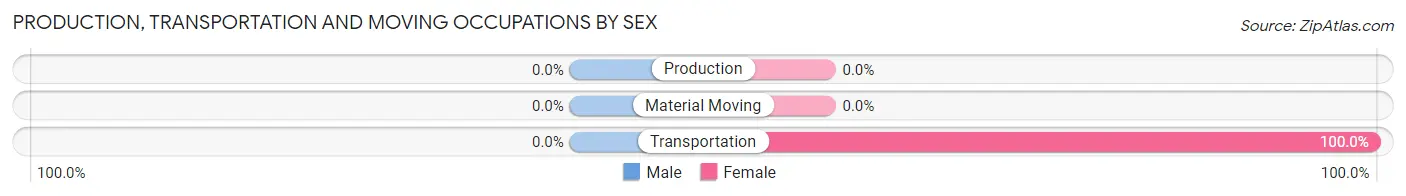
| Occupation | Male | Female |
| Production | 0 (0.0%) | 0 (0.0%) |
| Transportation | 0 (0.0%) | 22 (100.0%) |
| Material Moving | 0 (0.0%) | 0 (0.0%) |
| Total (Category) | 0 (0.0%) | 22 (100.0%) |
| Total (Overall) | 7 (17.1%) | 34 (82.9%) |
Employment Industries by Sex in Markham
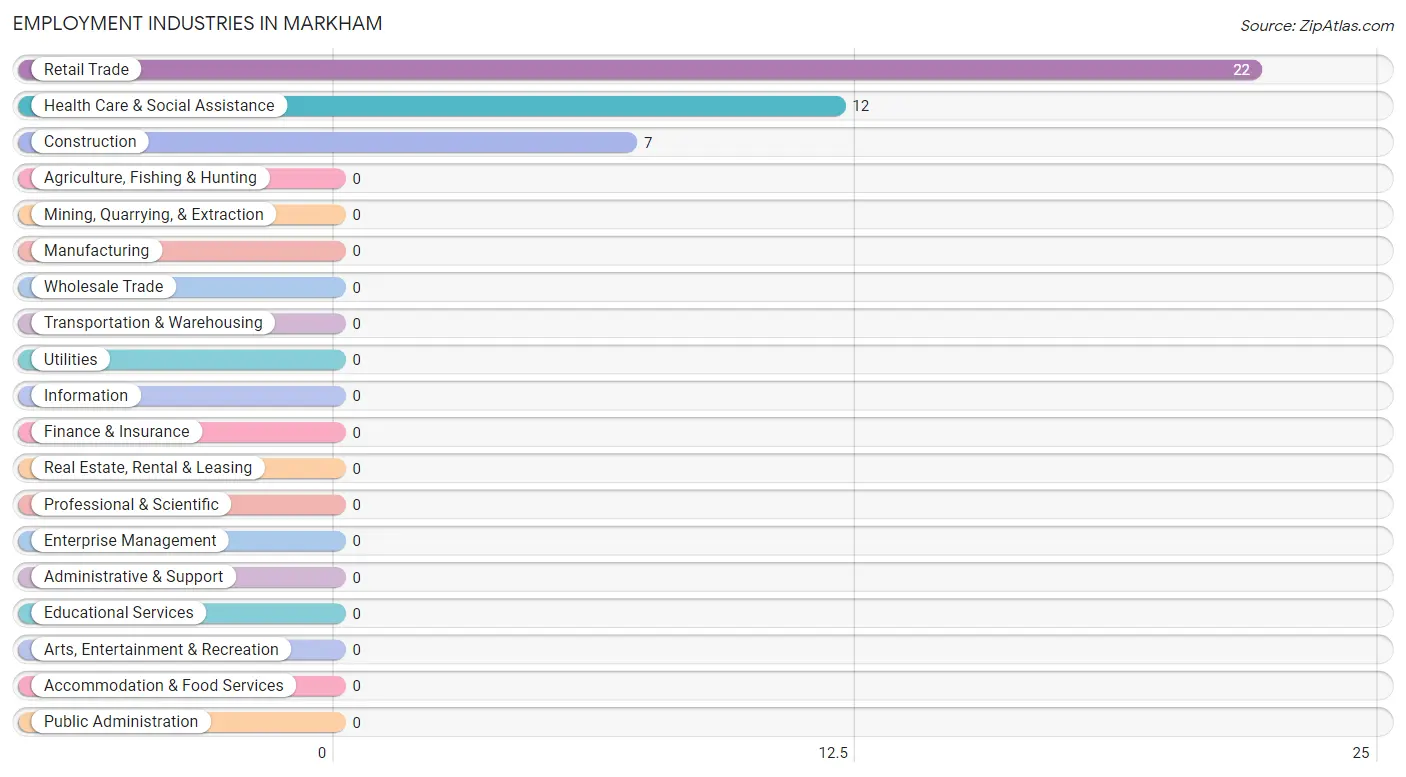
Employment Industries in Markham
The major employment industries in Markham include Retail Trade (22 | 53.7%), Health Care & Social Assistance (12 | 29.3%), and Construction (7 | 17.1%).
Employment Industries by Sex in Markham
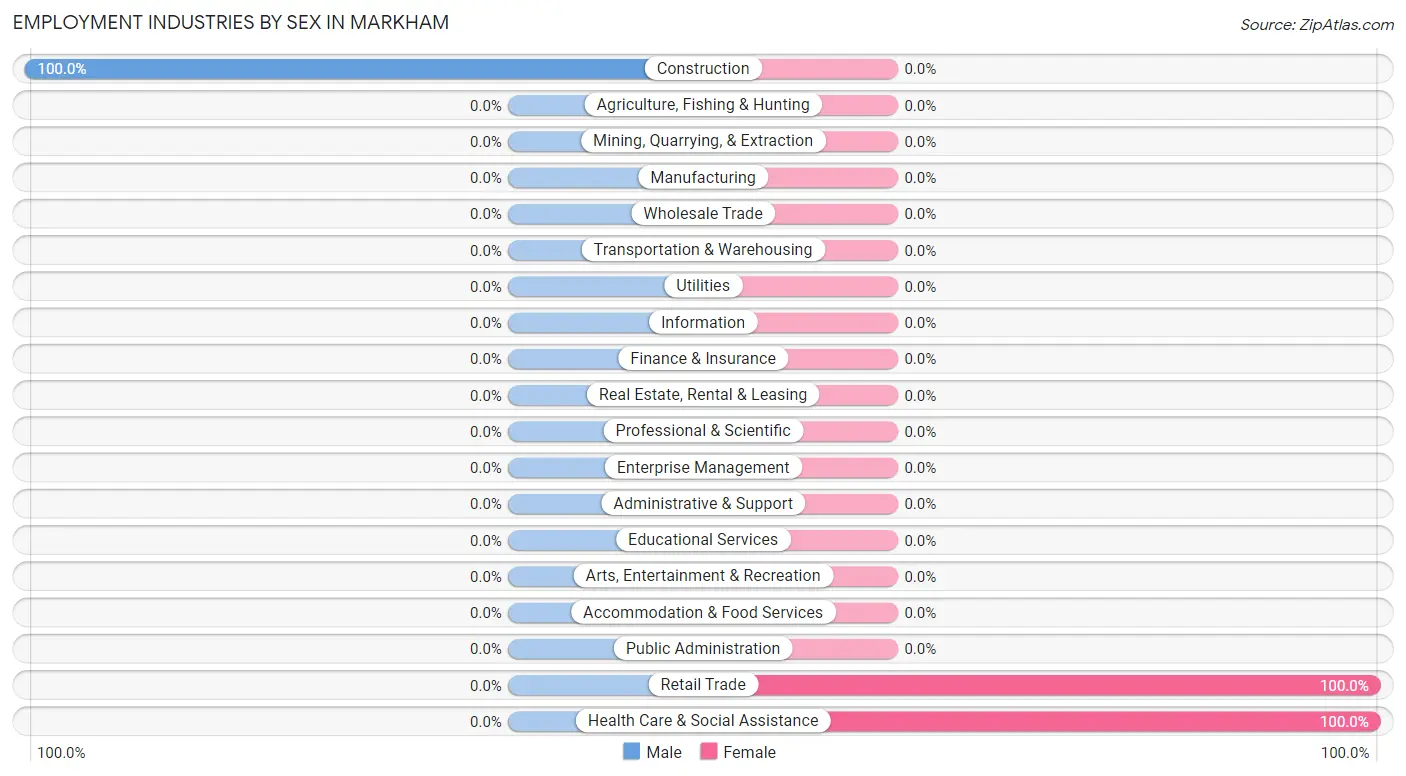
| Industry | Male | Female |
| Agriculture, Fishing & Hunting | 0 (0.0%) | 0 (0.0%) |
| Mining, Quarrying, & Extraction | 0 (0.0%) | 0 (0.0%) |
| Construction | 7 (100.0%) | 0 (0.0%) |
| Manufacturing | 0 (0.0%) | 0 (0.0%) |
| Wholesale Trade | 0 (0.0%) | 0 (0.0%) |
| Retail Trade | 0 (0.0%) | 22 (100.0%) |
| Transportation & Warehousing | 0 (0.0%) | 0 (0.0%) |
| Utilities | 0 (0.0%) | 0 (0.0%) |
| Information | 0 (0.0%) | 0 (0.0%) |
| Finance & Insurance | 0 (0.0%) | 0 (0.0%) |
| Real Estate, Rental & Leasing | 0 (0.0%) | 0 (0.0%) |
| Professional & Scientific | 0 (0.0%) | 0 (0.0%) |
| Enterprise Management | 0 (0.0%) | 0 (0.0%) |
| Administrative & Support | 0 (0.0%) | 0 (0.0%) |
| Educational Services | 0 (0.0%) | 0 (0.0%) |
| Health Care & Social Assistance | 0 (0.0%) | 12 (100.0%) |
| Arts, Entertainment & Recreation | 0 (0.0%) | 0 (0.0%) |
| Accommodation & Food Services | 0 (0.0%) | 0 (0.0%) |
| Public Administration | 0 (0.0%) | 0 (0.0%) |
| Total | 7 (17.1%) | 34 (82.9%) |
Education in Markham
School Enrollment in Markham
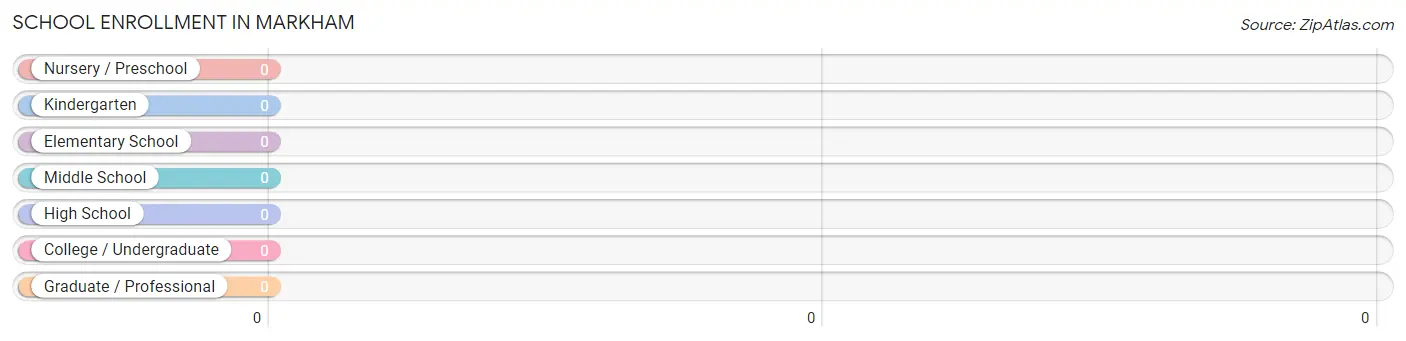
| School Level | # Students | % Students |
| Nursery / Preschool | 0 | 0.0% |
| Kindergarten | 0 | 0.0% |
| Elementary School | 0 | 0.0% |
| Middle School | 0 | 0.0% |
| High School | 0 | 0.0% |
| College / Undergraduate | 0 | 0.0% |
| Graduate / Professional | 0 | 0.0% |
| Total | 0 | 0.0% |
School Enrollment by Age by Funding Source in Markham
| Age Bracket | Public School | Private School |
| 3 to 4 Year Olds | 0 (0.0%) | 0 (0.0%) |
| 5 to 9 Year Old | 0 (0.0%) | 0 (0.0%) |
| 10 to 14 Year Olds | 0 (0.0%) | 0 (0.0%) |
| 15 to 17 Year Olds | 0 (0.0%) | 0 (0.0%) |
| 18 to 19 Year Olds | 0 (0.0%) | 0 (0.0%) |
| 20 to 24 Year Olds | 0 (0.0%) | 0 (0.0%) |
| 25 to 34 Year Olds | 0 (0.0%) | 0 (0.0%) |
| 35 Years and over | 0 (0.0%) | 0 (0.0%) |
| Total | 0 (0.0%) | 0 (0.0%) |
Educational Attainment by Field of Study in Markham
Physical & health sciences (3 | 25.0%), psychology (3 | 25.0%), science & technology (3 | 25.0%), and education (3 | 25.0%) are the most common fields of study among 12 individuals in Markham who have obtained a bachelor's degree or higher.
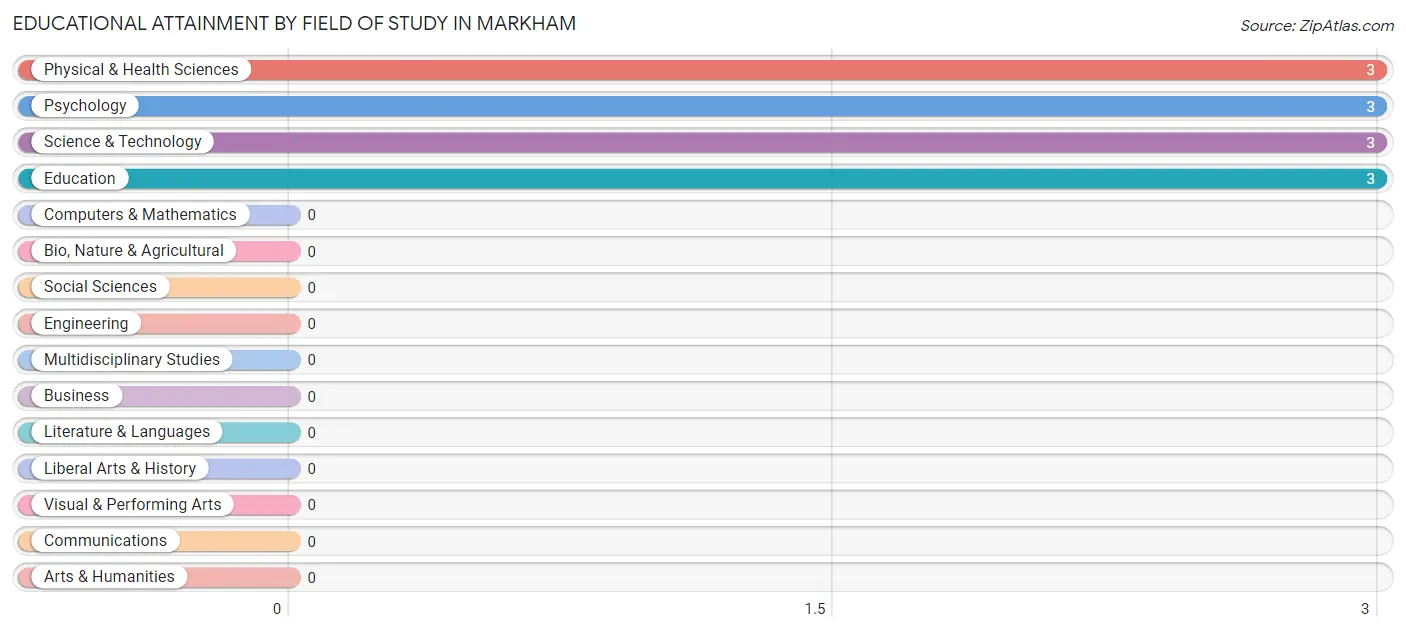
| Field of Study | # Graduates | % Graduates |
| Computers & Mathematics | 0 | 0.0% |
| Bio, Nature & Agricultural | 0 | 0.0% |
| Physical & Health Sciences | 3 | 25.0% |
| Psychology | 3 | 25.0% |
| Social Sciences | 0 | 0.0% |
| Engineering | 0 | 0.0% |
| Multidisciplinary Studies | 0 | 0.0% |
| Science & Technology | 3 | 25.0% |
| Business | 0 | 0.0% |
| Education | 3 | 25.0% |
| Literature & Languages | 0 | 0.0% |
| Liberal Arts & History | 0 | 0.0% |
| Visual & Performing Arts | 0 | 0.0% |
| Communications | 0 | 0.0% |
| Arts & Humanities | 0 | 0.0% |
| Total | 12 | 100.0% |
Transportation & Commute in Markham
Vehicle Availability by Sex in Markham
The most prevalent vehicle ownership categories in Markham are males with 2 vehicles (7, accounting for 100.0%) and females with 2 vehicles (12, making up 20.6%).
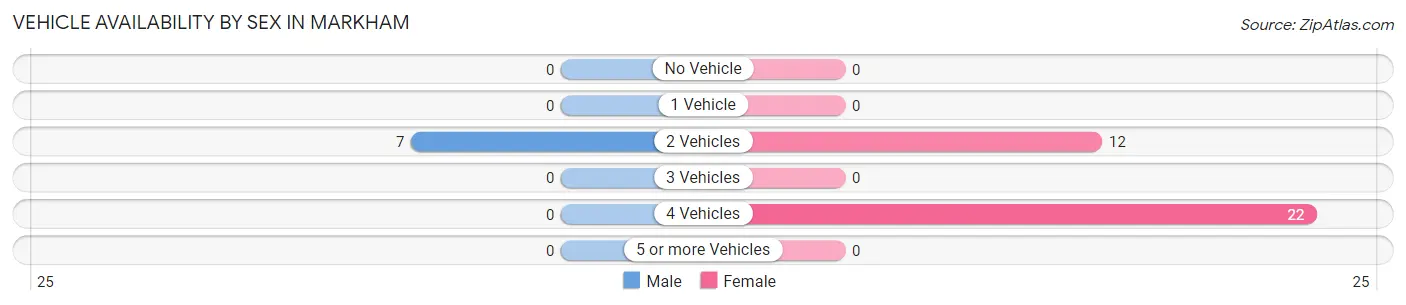
| Vehicles Available | Male | Female |
| No Vehicle | 0 (0.0%) | 0 (0.0%) |
| 1 Vehicle | 0 (0.0%) | 0 (0.0%) |
| 2 Vehicles | 7 (100.0%) | 12 (35.3%) |
| 3 Vehicles | 0 (0.0%) | 0 (0.0%) |
| 4 Vehicles | 0 (0.0%) | 22 (64.7%) |
| 5 or more Vehicles | 0 (0.0%) | 0 (0.0%) |
| Total | 7 (100.0%) | 34 (100.0%) |
Commute Time in Markham
The most frequently occuring commute durations in Markham are 15 to 19 minutes (22 commuters, 53.7%), 20 to 24 minutes (12 commuters, 29.3%), and 30 to 34 minutes (7 commuters, 17.1%).
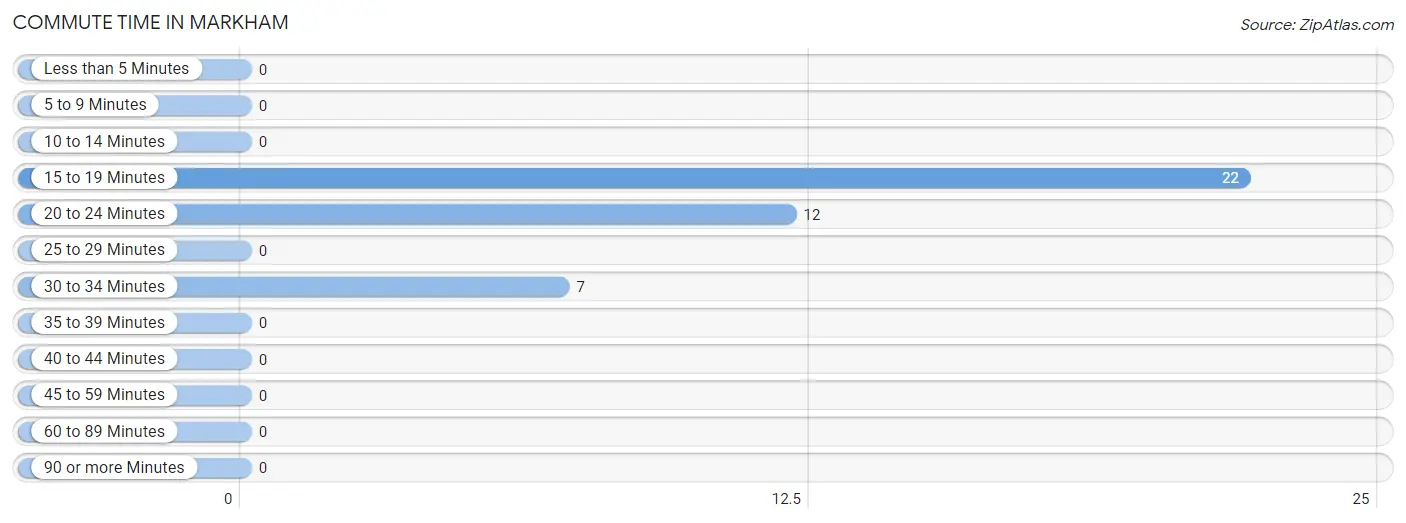
| Commute Time | # Commuters | % Commuters |
| Less than 5 Minutes | 0 | 0.0% |
| 5 to 9 Minutes | 0 | 0.0% |
| 10 to 14 Minutes | 0 | 0.0% |
| 15 to 19 Minutes | 22 | 53.7% |
| 20 to 24 Minutes | 12 | 29.3% |
| 25 to 29 Minutes | 0 | 0.0% |
| 30 to 34 Minutes | 7 | 17.1% |
| 35 to 39 Minutes | 0 | 0.0% |
| 40 to 44 Minutes | 0 | 0.0% |
| 45 to 59 Minutes | 0 | 0.0% |
| 60 to 89 Minutes | 0 | 0.0% |
| 90 or more Minutes | 0 | 0.0% |
Commute Time by Sex in Markham
The most common commute times in Markham are 30 to 34 minutes (7 commuters, 100.0%) for males and 15 to 19 minutes (22 commuters, 64.7%) for females.
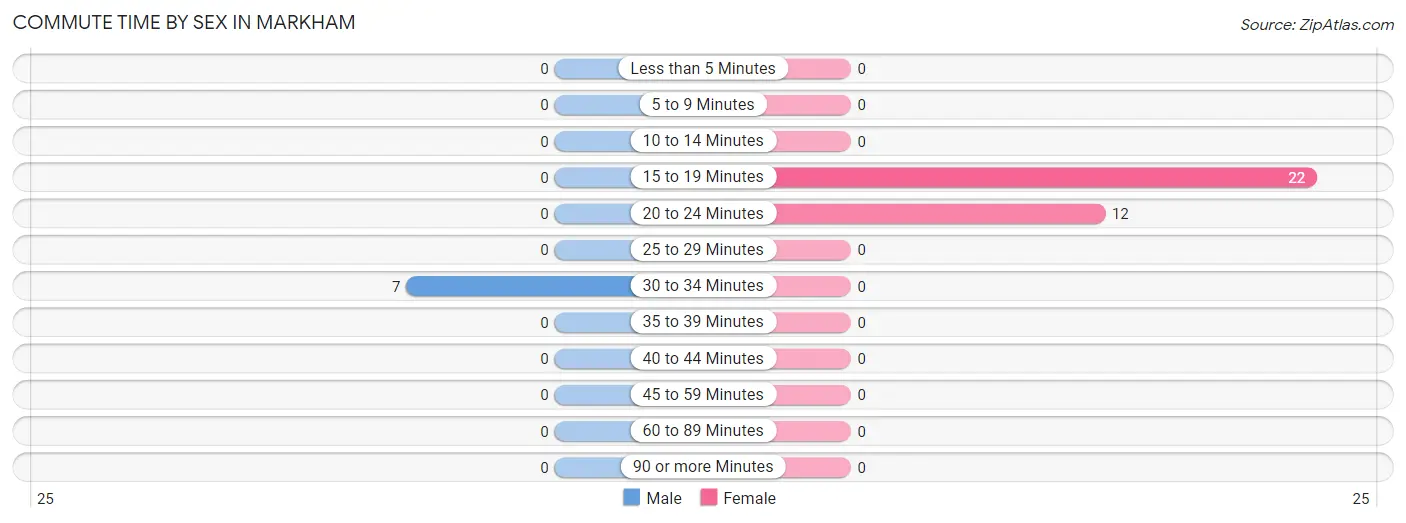
| Commute Time | Male | Female |
| Less than 5 Minutes | 0 (0.0%) | 0 (0.0%) |
| 5 to 9 Minutes | 0 (0.0%) | 0 (0.0%) |
| 10 to 14 Minutes | 0 (0.0%) | 0 (0.0%) |
| 15 to 19 Minutes | 0 (0.0%) | 22 (64.7%) |
| 20 to 24 Minutes | 0 (0.0%) | 12 (35.3%) |
| 25 to 29 Minutes | 0 (0.0%) | 0 (0.0%) |
| 30 to 34 Minutes | 7 (100.0%) | 0 (0.0%) |
| 35 to 39 Minutes | 0 (0.0%) | 0 (0.0%) |
| 40 to 44 Minutes | 0 (0.0%) | 0 (0.0%) |
| 45 to 59 Minutes | 0 (0.0%) | 0 (0.0%) |
| 60 to 89 Minutes | 0 (0.0%) | 0 (0.0%) |
| 90 or more Minutes | 0 (0.0%) | 0 (0.0%) |
Time of Departure to Work by Sex in Markham
The most frequent times of departure to work in Markham are 6:00 AM to 6:29 AM (7, 100.0%) for males and 6:00 AM to 6:29 AM (22, 64.7%) for females.
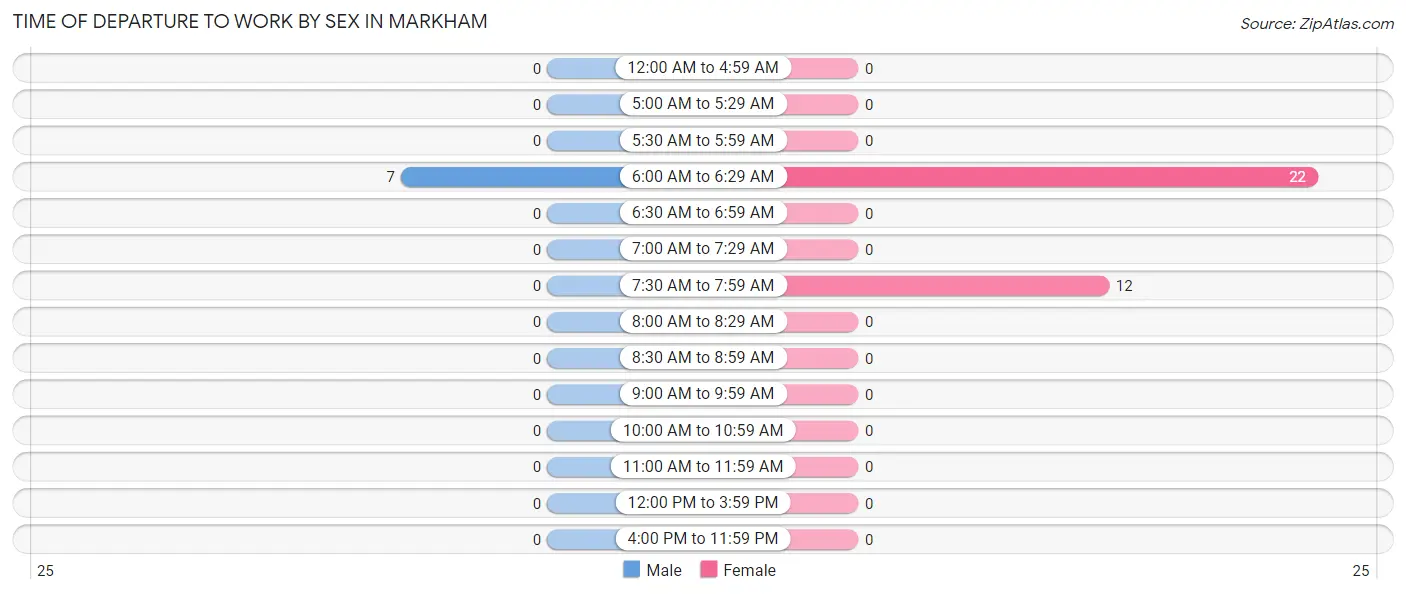
| Time of Departure | Male | Female |
| 12:00 AM to 4:59 AM | 0 (0.0%) | 0 (0.0%) |
| 5:00 AM to 5:29 AM | 0 (0.0%) | 0 (0.0%) |
| 5:30 AM to 5:59 AM | 0 (0.0%) | 0 (0.0%) |
| 6:00 AM to 6:29 AM | 7 (100.0%) | 22 (64.7%) |
| 6:30 AM to 6:59 AM | 0 (0.0%) | 0 (0.0%) |
| 7:00 AM to 7:29 AM | 0 (0.0%) | 0 (0.0%) |
| 7:30 AM to 7:59 AM | 0 (0.0%) | 12 (35.3%) |
| 8:00 AM to 8:29 AM | 0 (0.0%) | 0 (0.0%) |
| 8:30 AM to 8:59 AM | 0 (0.0%) | 0 (0.0%) |
| 9:00 AM to 9:59 AM | 0 (0.0%) | 0 (0.0%) |
| 10:00 AM to 10:59 AM | 0 (0.0%) | 0 (0.0%) |
| 11:00 AM to 11:59 AM | 0 (0.0%) | 0 (0.0%) |
| 12:00 PM to 3:59 PM | 0 (0.0%) | 0 (0.0%) |
| 4:00 PM to 11:59 PM | 0 (0.0%) | 0 (0.0%) |
| Total | 7 (100.0%) | 34 (100.0%) |
Housing Occupancy in Markham
Occupancy by Ownership in Markham
Of the total 75 dwellings in Markham, owner-occupied units account for 75 (100.0%), while renter-occupied units make up 0 (0.0%).
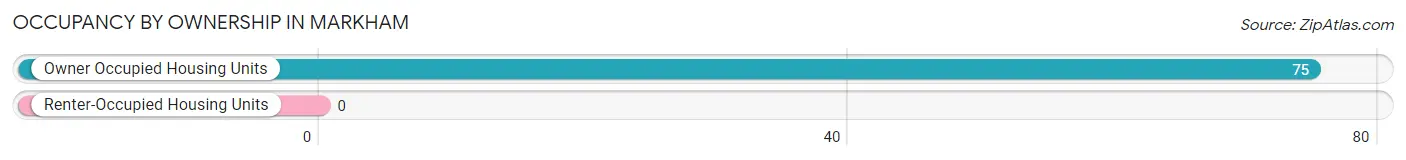
| Occupancy | # Housing Units | % Housing Units |
| Owner Occupied Housing Units | 75 | 100.0% |
| Renter-Occupied Housing Units | 0 | 0.0% |
| Total Occupied Housing Units | 75 | 100.0% |
Occupancy by Household Size in Markham
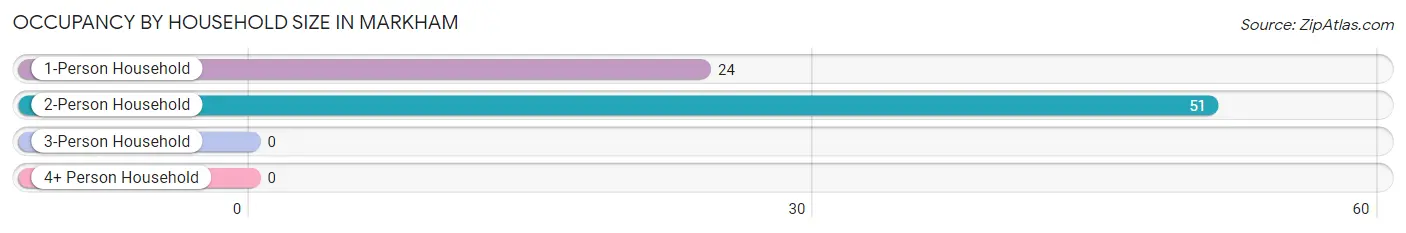
| Household Size | # Housing Units | % Housing Units |
| 1-Person Household | 24 | 32.0% |
| 2-Person Household | 51 | 68.0% |
| 3-Person Household | 0 | 0.0% |
| 4+ Person Household | 0 | 0.0% |
| Total Housing Units | 75 | 100.0% |
Occupancy by Ownership by Household Size in Markham
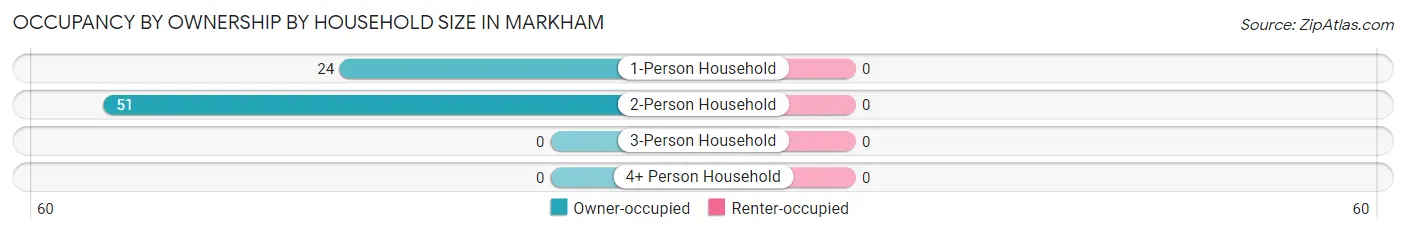
| Household Size | Owner-occupied | Renter-occupied |
| 1-Person Household | 24 (100.0%) | 0 (0.0%) |
| 2-Person Household | 51 (100.0%) | 0 (0.0%) |
| 3-Person Household | 0 (0.0%) | 0 (0.0%) |
| 4+ Person Household | 0 (0.0%) | 0 (0.0%) |
| Total Housing Units | 75 (100.0%) | 0 (0.0%) |
Occupancy by Educational Attainment in Markham
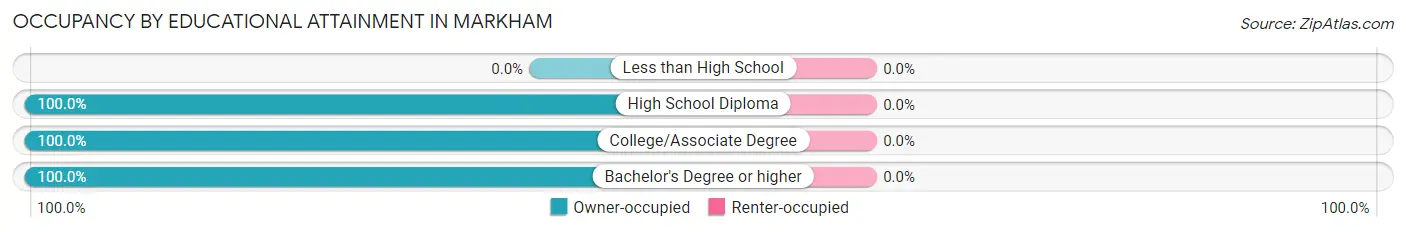
| Household Size | Owner-occupied | Renter-occupied |
| Less than High School | 0 (0.0%) | 0 (0.0%) |
| High School Diploma | 46 (100.0%) | 0 (0.0%) |
| College/Associate Degree | 26 (100.0%) | 0 (0.0%) |
| Bachelor's Degree or higher | 3 (100.0%) | 0 (0.0%) |
Occupancy by Age of Householder in Markham
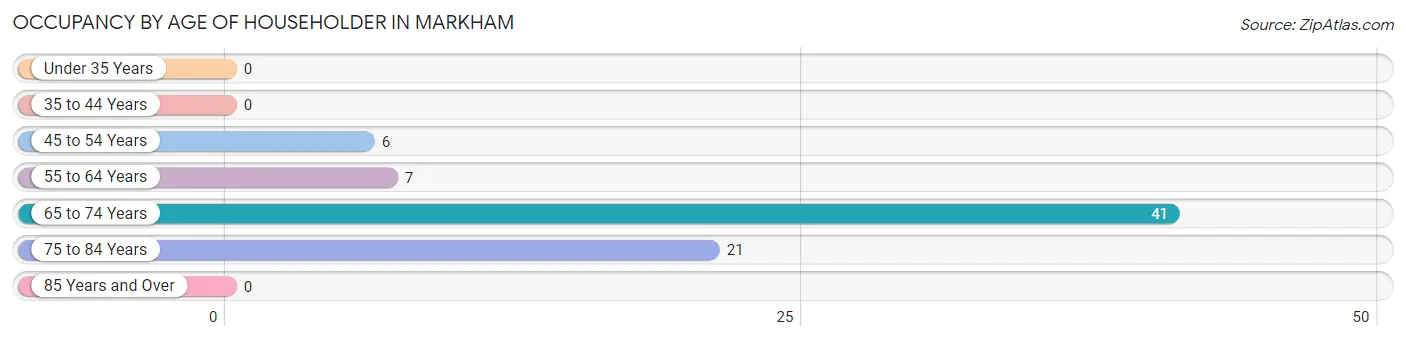
| Age Bracket | # Households | % Households |
| Under 35 Years | 0 | 0.0% |
| 35 to 44 Years | 0 | 0.0% |
| 45 to 54 Years | 6 | 8.0% |
| 55 to 64 Years | 7 | 9.3% |
| 65 to 74 Years | 41 | 54.7% |
| 75 to 84 Years | 21 | 28.0% |
| 85 Years and Over | 0 | 0.0% |
| Total | 75 | 100.0% |
Housing Finances in Markham
Median Income by Occupancy in Markham
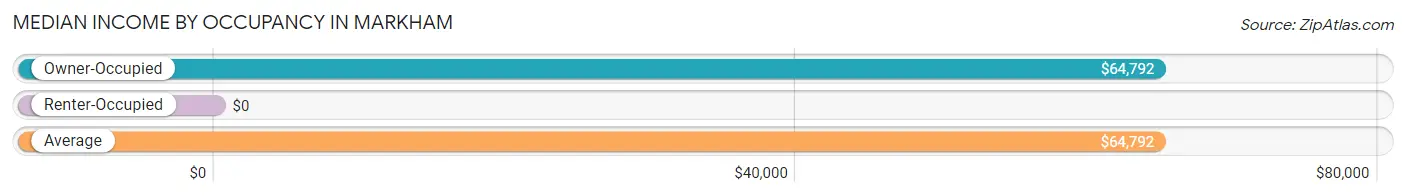
| Occupancy Type | # Households | Median Income |
| Owner-Occupied | 75 (100.0%) | $64,792 |
| Renter-Occupied | 0 (0.0%) | $0 |
| Average | 75 (100.0%) | $64,792 |
Occupancy by Householder Income Bracket in Markham
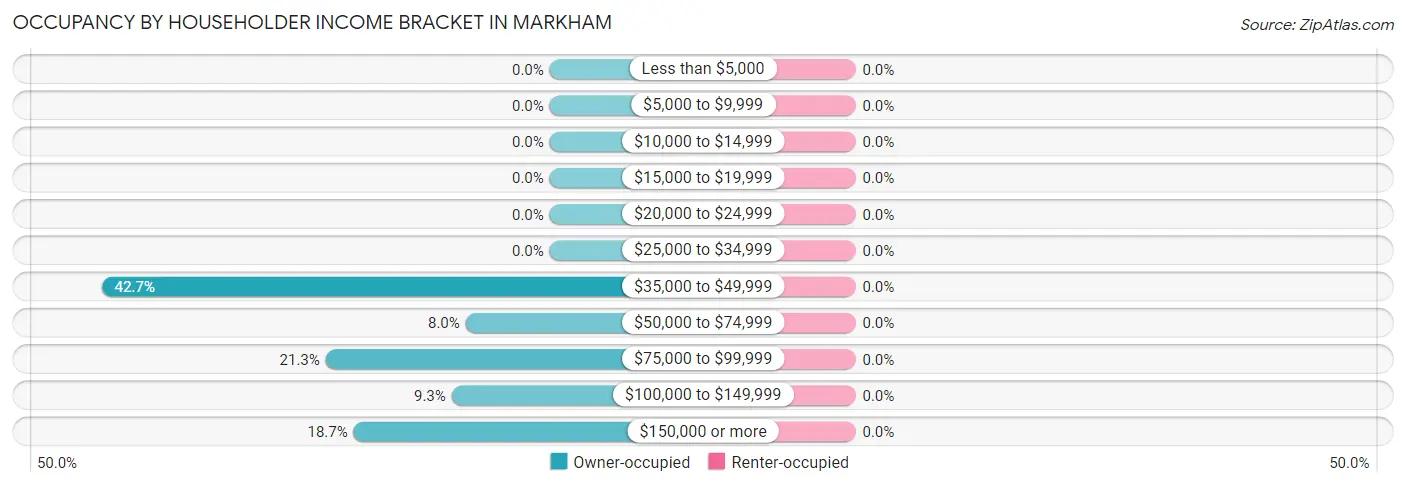
| Income Bracket | Owner-occupied | Renter-occupied |
| Less than $5,000 | 0 (0.0%) | 0 (0.0%) |
| $5,000 to $9,999 | 0 (0.0%) | 0 (0.0%) |
| $10,000 to $14,999 | 0 (0.0%) | 0 (0.0%) |
| $15,000 to $19,999 | 0 (0.0%) | 0 (0.0%) |
| $20,000 to $24,999 | 0 (0.0%) | 0 (0.0%) |
| $25,000 to $34,999 | 0 (0.0%) | 0 (0.0%) |
| $35,000 to $49,999 | 32 (42.7%) | 0 (0.0%) |
| $50,000 to $74,999 | 6 (8.0%) | 0 (0.0%) |
| $75,000 to $99,999 | 16 (21.3%) | 0 (0.0%) |
| $100,000 to $149,999 | 7 (9.3%) | 0 (0.0%) |
| $150,000 or more | 14 (18.7%) | 0 (0.0%) |
| Total | 75 (100.0%) | 0 (0.0%) |
Monthly Housing Cost Tiers in Markham
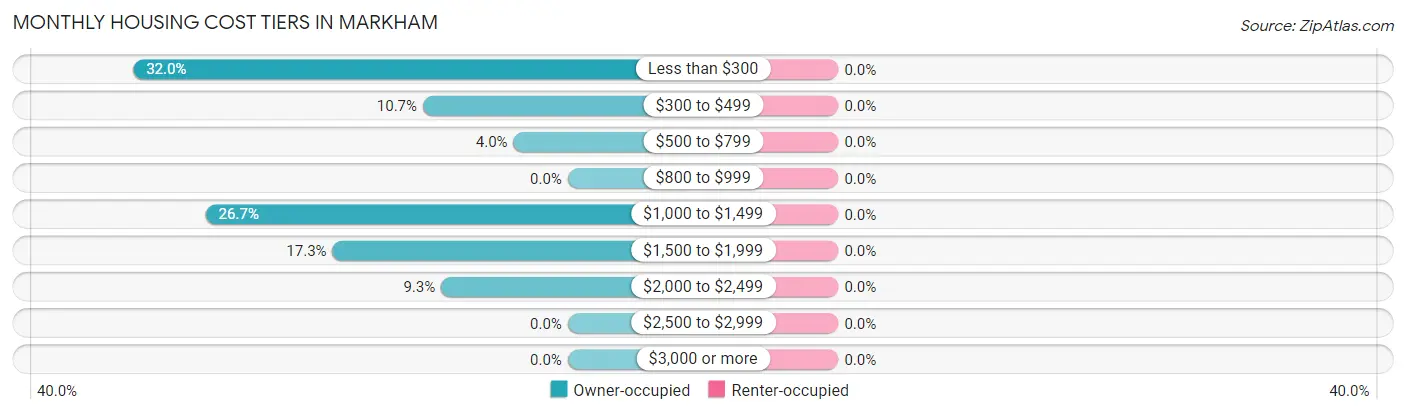
| Monthly Cost | Owner-occupied | Renter-occupied |
| Less than $300 | 24 (32.0%) | 0 (0.0%) |
| $300 to $499 | 8 (10.7%) | 0 (0.0%) |
| $500 to $799 | 3 (4.0%) | 0 (0.0%) |
| $800 to $999 | 0 (0.0%) | 0 (0.0%) |
| $1,000 to $1,499 | 20 (26.7%) | 0 (0.0%) |
| $1,500 to $1,999 | 13 (17.3%) | 0 (0.0%) |
| $2,000 to $2,499 | 7 (9.3%) | 0 (0.0%) |
| $2,500 to $2,999 | 0 (0.0%) | 0 (0.0%) |
| $3,000 or more | 0 (0.0%) | 0 (0.0%) |
| Total | 75 (100.0%) | 0 (0.0%) |
Physical Housing Characteristics in Markham
Housing Structures in Markham
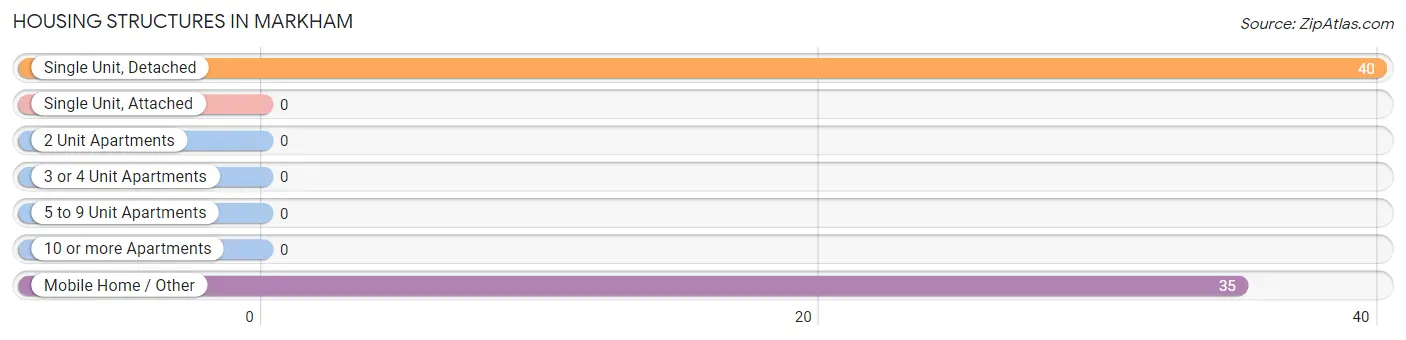
| Structure Type | # Housing Units | % Housing Units |
| Single Unit, Detached | 40 | 53.3% |
| Single Unit, Attached | 0 | 0.0% |
| 2 Unit Apartments | 0 | 0.0% |
| 3 or 4 Unit Apartments | 0 | 0.0% |
| 5 to 9 Unit Apartments | 0 | 0.0% |
| 10 or more Apartments | 0 | 0.0% |
| Mobile Home / Other | 35 | 46.7% |
| Total | 75 | 100.0% |
Housing Structures by Occupancy in Markham
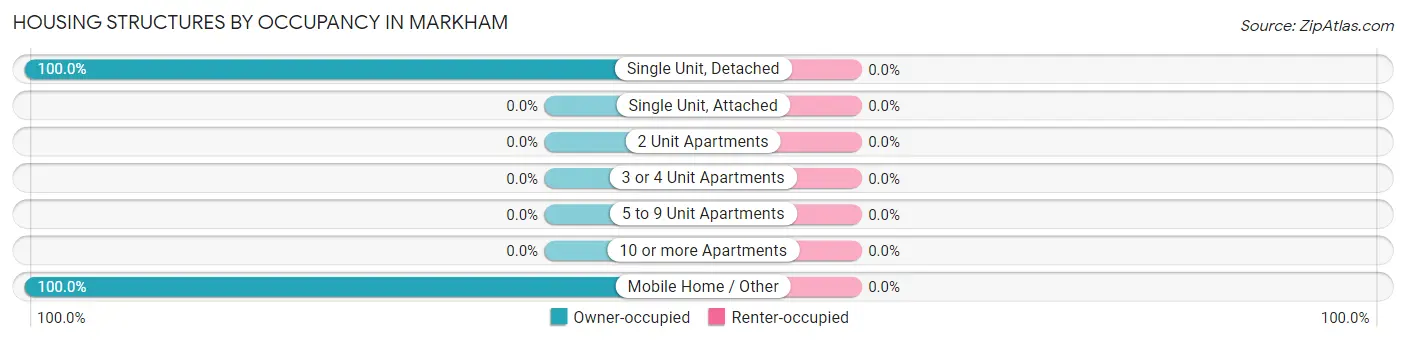
| Structure Type | Owner-occupied | Renter-occupied |
| Single Unit, Detached | 40 (100.0%) | 0 (0.0%) |
| Single Unit, Attached | 0 (0.0%) | 0 (0.0%) |
| 2 Unit Apartments | 0 (0.0%) | 0 (0.0%) |
| 3 or 4 Unit Apartments | 0 (0.0%) | 0 (0.0%) |
| 5 to 9 Unit Apartments | 0 (0.0%) | 0 (0.0%) |
| 10 or more Apartments | 0 (0.0%) | 0 (0.0%) |
| Mobile Home / Other | 35 (100.0%) | 0 (0.0%) |
| Total | 75 (100.0%) | 0 (0.0%) |
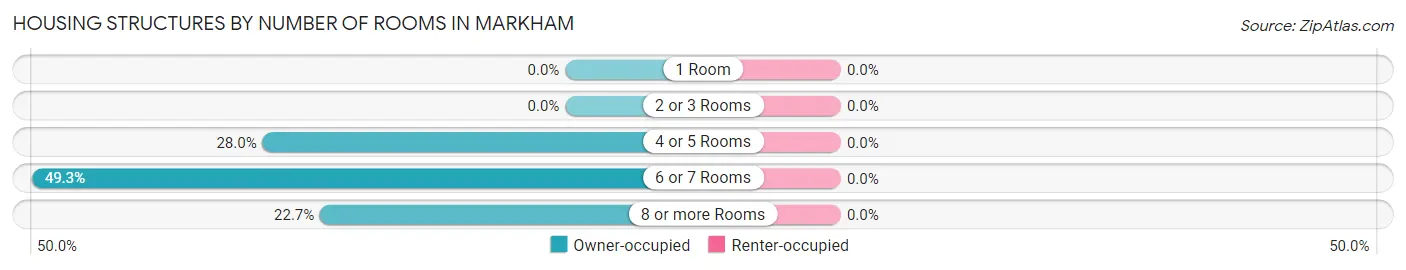
Housing Structures by Number of Rooms in Markham
| Number of Rooms | Owner-occupied | Renter-occupied |
| 1 Room | 0 (0.0%) | 0 (0.0%) |
| 2 or 3 Rooms | 0 (0.0%) | 0 (0.0%) |
| 4 or 5 Rooms | 21 (28.0%) | 0 (0.0%) |
| 6 or 7 Rooms | 37 (49.3%) | 0 (0.0%) |
| 8 or more Rooms | 17 (22.7%) | 0 (0.0%) |
| Total | 75 (100.0%) | 0 (0.0%) |
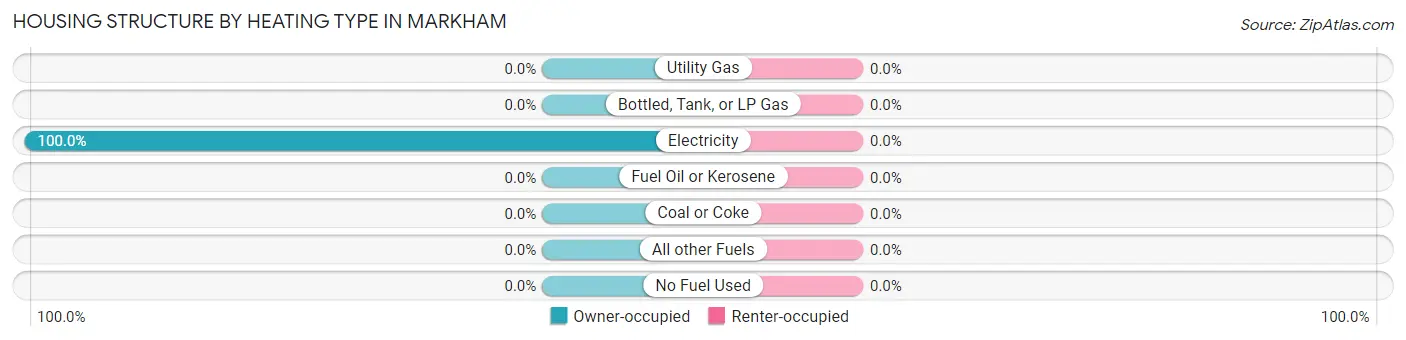
Housing Structure by Heating Type in Markham
| Heating Type | Owner-occupied | Renter-occupied |
| Utility Gas | 0 (0.0%) | 0 (0.0%) |
| Bottled, Tank, or LP Gas | 0 (0.0%) | 0 (0.0%) |
| Electricity | 75 (100.0%) | 0 (0.0%) |
| Fuel Oil or Kerosene | 0 (0.0%) | 0 (0.0%) |
| Coal or Coke | 0 (0.0%) | 0 (0.0%) |
| All other Fuels | 0 (0.0%) | 0 (0.0%) |
| No Fuel Used | 0 (0.0%) | 0 (0.0%) |
| Total | 75 (100.0%) | 0 (0.0%) |
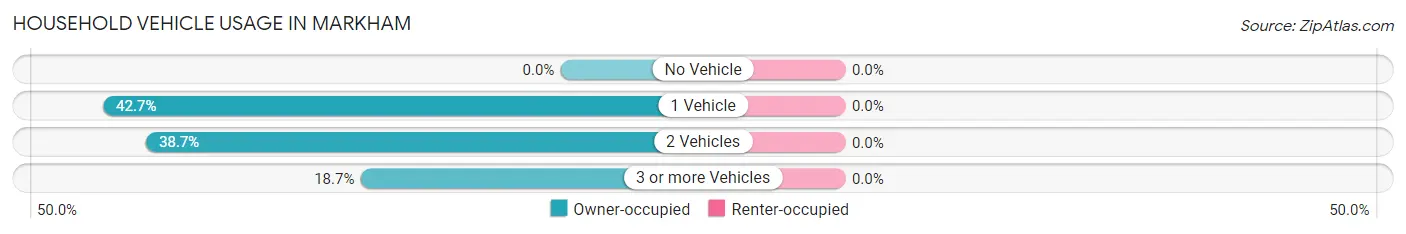
Household Vehicle Usage in Markham
| Vehicles per Household | Owner-occupied | Renter-occupied |
| No Vehicle | 0 (0.0%) | 0 (0.0%) |
| 1 Vehicle | 32 (42.7%) | 0 (0.0%) |
| 2 Vehicles | 29 (38.7%) | 0 (0.0%) |
| 3 or more Vehicles | 14 (18.7%) | 0 (0.0%) |
| Total | 75 (100.0%) | 0 (0.0%) |
Real Estate & Mortgages in Markham
Real Estate and Mortgage Overview in Markham
| Characteristic | Without Mortgage | With Mortgage |
| Housing Units | 49 | 26 |
| Median Property Value | - | - |
| Median Household Income | - | - |
| Monthly Housing Costs | - | - |
| Real Estate Taxes | - | - |
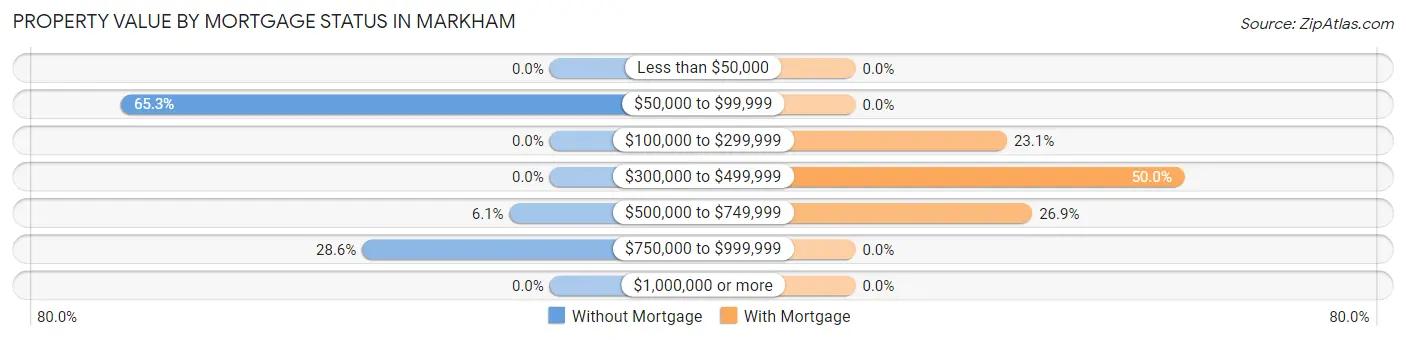
Property Value by Mortgage Status in Markham
| Property Value | Without Mortgage | With Mortgage |
| Less than $50,000 | 0 (0.0%) | 0 (0.0%) |
| $50,000 to $99,999 | 32 (65.3%) | 0 (0.0%) |
| $100,000 to $299,999 | 0 (0.0%) | 6 (23.1%) |
| $300,000 to $499,999 | 0 (0.0%) | 13 (50.0%) |
| $500,000 to $749,999 | 3 (6.1%) | 7 (26.9%) |
| $750,000 to $999,999 | 14 (28.6%) | 0 (0.0%) |
| $1,000,000 or more | 0 (0.0%) | 0 (0.0%) |
| Total | 49 (100.0%) | 26 (100.0%) |
Household Income by Mortgage Status in Markham
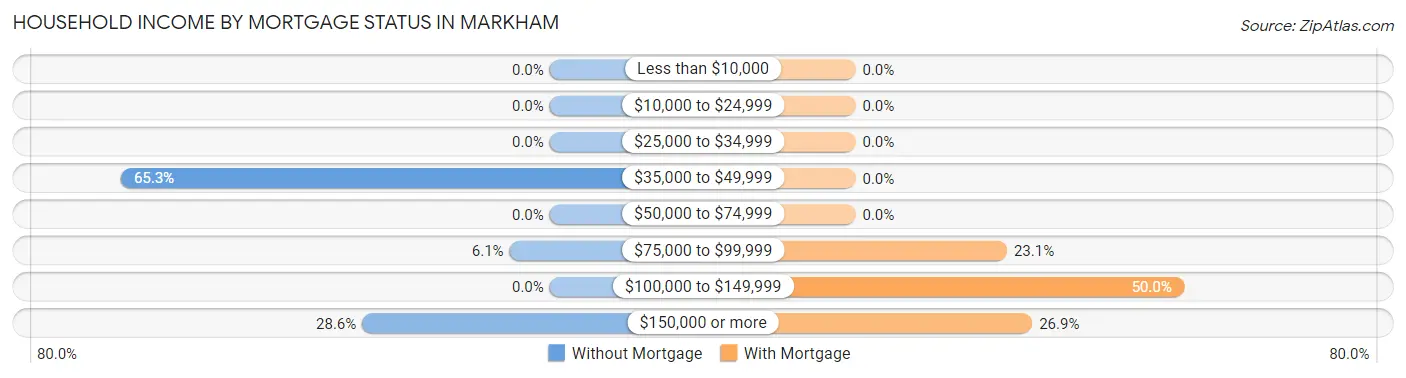
| Household Income | Without Mortgage | With Mortgage |
| Less than $10,000 | 0 (0.0%) | 0 (0.0%) |
| $10,000 to $24,999 | 0 (0.0%) | 0 (0.0%) |
| $25,000 to $34,999 | 0 (0.0%) | 0 (0.0%) |
| $35,000 to $49,999 | 32 (65.3%) | 0 (0.0%) |
| $50,000 to $74,999 | 0 (0.0%) | 0 (0.0%) |
| $75,000 to $99,999 | 3 (6.1%) | 6 (23.1%) |
| $100,000 to $149,999 | 0 (0.0%) | 13 (50.0%) |
| $150,000 or more | 14 (28.6%) | 7 (26.9%) |
| Total | 49 (100.0%) | 26 (100.0%) |
Property Value to Household Income Ratio in Markham
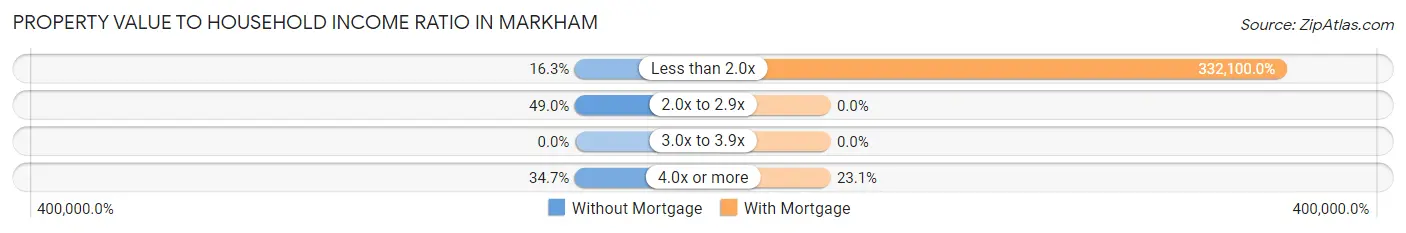
| Value-to-Income Ratio | Without Mortgage | With Mortgage |
| Less than 2.0x | 8 (16.3%) | 86,346 (332,100.0%) |
| 2.0x to 2.9x | 24 (49.0%) | 0 (0.0%) |
| 3.0x to 3.9x | 0 (0.0%) | 0 (0.0%) |
| 4.0x or more | 17 (34.7%) | 6 (23.1%) |
| Total | 49 (100.0%) | 26 (100.0%) |
Real Estate Taxes by Mortgage Status in Markham
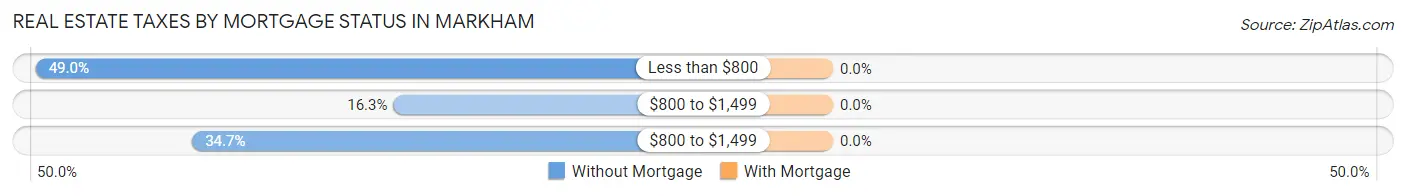
| Property Taxes | Without Mortgage | With Mortgage |
| Less than $800 | 24 (49.0%) | 0 (0.0%) |
| $800 to $1,499 | 8 (16.3%) | 0 (0.0%) |
| $800 to $1,499 | 17 (34.7%) | 0 (0.0%) |
| Total | 49 (100.0%) | 26 (100.0%) |
Health & Disability in Markham
Health Insurance Coverage by Age in Markham
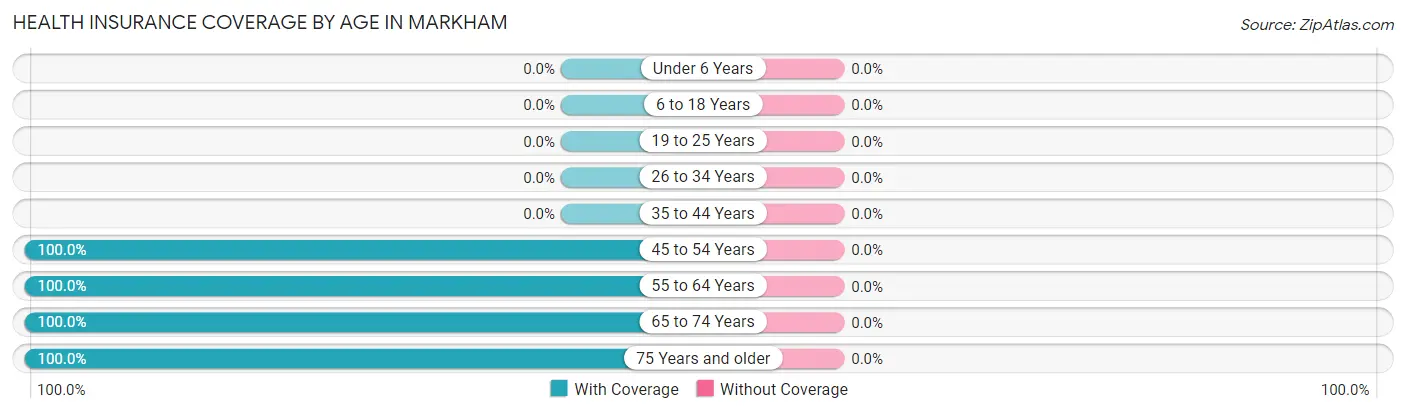
| Age Bracket | With Coverage | Without Coverage |
| Under 6 Years | 0 (0.0%) | 0 (0.0%) |
| 6 to 18 Years | 0 (0.0%) | 0 (0.0%) |
| 19 to 25 Years | 0 (0.0%) | 0 (0.0%) |
| 26 to 34 Years | 0 (0.0%) | 0 (0.0%) |
| 35 to 44 Years | 0 (0.0%) | 0 (0.0%) |
| 45 to 54 Years | 28 (100.0%) | 0 (0.0%) |
| 55 to 64 Years | 18 (100.0%) | 0 (0.0%) |
| 65 to 74 Years | 54 (100.0%) | 0 (0.0%) |
| 75 Years and older | 32 (100.0%) | 0 (0.0%) |
| Total | 132 (100.0%) | 0 (0.0%) |
Health Insurance Coverage by Citizenship Status in Markham
| Citizenship Status | With Coverage | Without Coverage |
| Native Born | 0 (0.0%) | 0 (0.0%) |
| Foreign Born, Citizen | 0 (0.0%) | 0 (0.0%) |
| Foreign Born, not a Citizen | 0 (0.0%) | 0 (0.0%) |
Health Insurance Coverage by Household Income in Markham
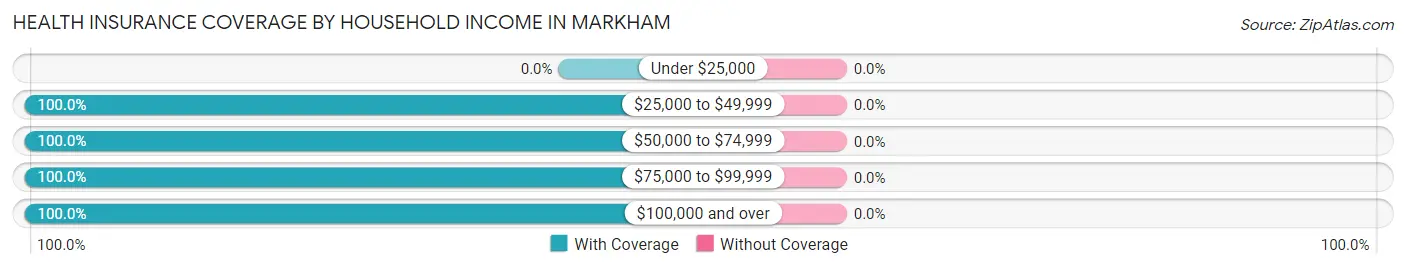
| Household Income | With Coverage | Without Coverage |
| Under $25,000 | 0 (0.0%) | 0 (0.0%) |
| $25,000 to $49,999 | 40 (100.0%) | 0 (0.0%) |
| $50,000 to $74,999 | 11 (100.0%) | 0 (0.0%) |
| $75,000 to $99,999 | 32 (100.0%) | 0 (0.0%) |
| $100,000 and over | 49 (100.0%) | 0 (0.0%) |
Public vs Private Health Insurance Coverage by Age in Markham
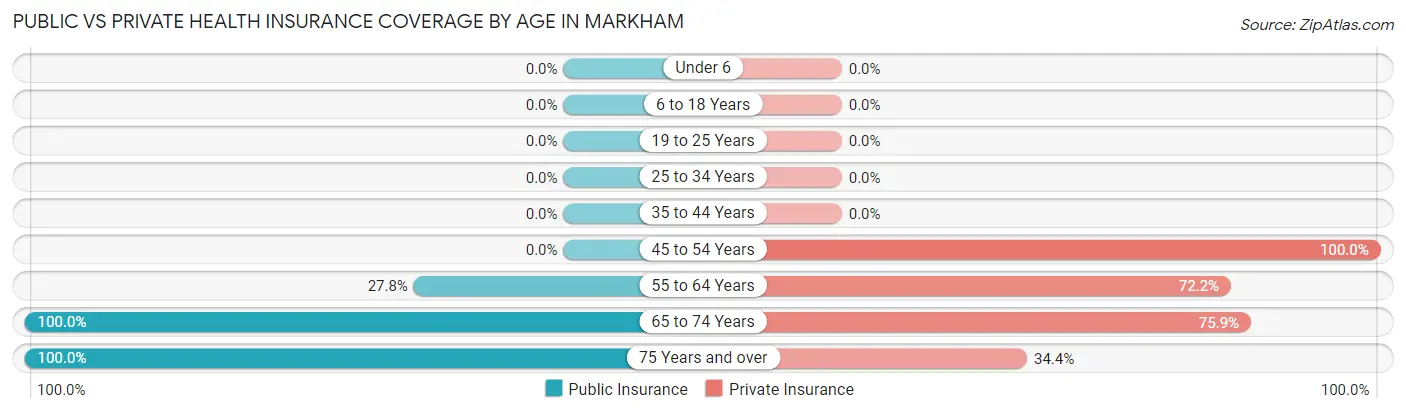
| Age Bracket | Public Insurance | Private Insurance |
| Under 6 | 0 (0.0%) | 0 (0.0%) |
| 6 to 18 Years | 0 (0.0%) | 0 (0.0%) |
| 19 to 25 Years | 0 (0.0%) | 0 (0.0%) |
| 25 to 34 Years | 0 (0.0%) | 0 (0.0%) |
| 35 to 44 Years | 0 (0.0%) | 0 (0.0%) |
| 45 to 54 Years | 0 (0.0%) | 28 (100.0%) |
| 55 to 64 Years | 5 (27.8%) | 13 (72.2%) |
| 65 to 74 Years | 54 (100.0%) | 41 (75.9%) |
| 75 Years and over | 32 (100.0%) | 11 (34.4%) |
| Total | 91 (68.9%) | 93 (70.5%) |
Disability Status by Sex by Age in Markham
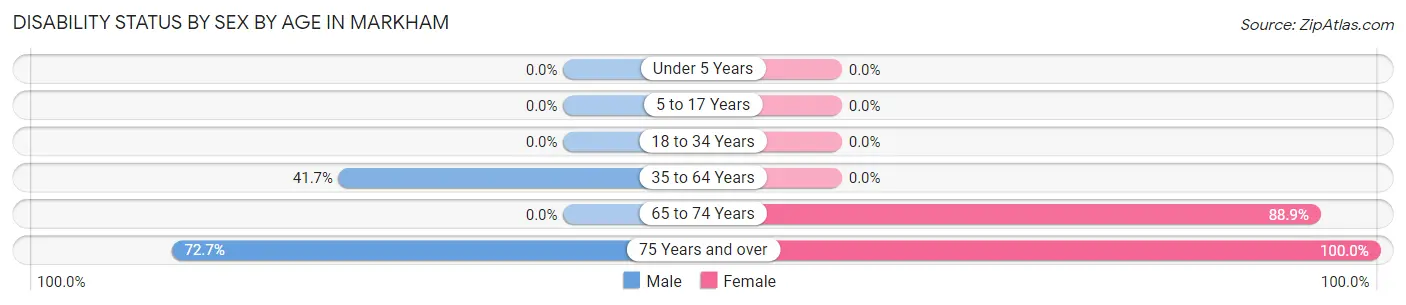
| Age Bracket | Male | Female |
| Under 5 Years | 0 (0.0%) | 0 (0.0%) |
| 5 to 17 Years | 0 (0.0%) | 0 (0.0%) |
| 18 to 34 Years | 0 (0.0%) | 0 (0.0%) |
| 35 to 64 Years | 5 (41.7%) | 0 (0.0%) |
| 65 to 74 Years | 0 (0.0%) | 24 (88.9%) |
| 75 Years and over | 8 (72.7%) | 21 (100.0%) |
Disability Class by Sex by Age in Markham
Disability Class: Hearing Difficulty
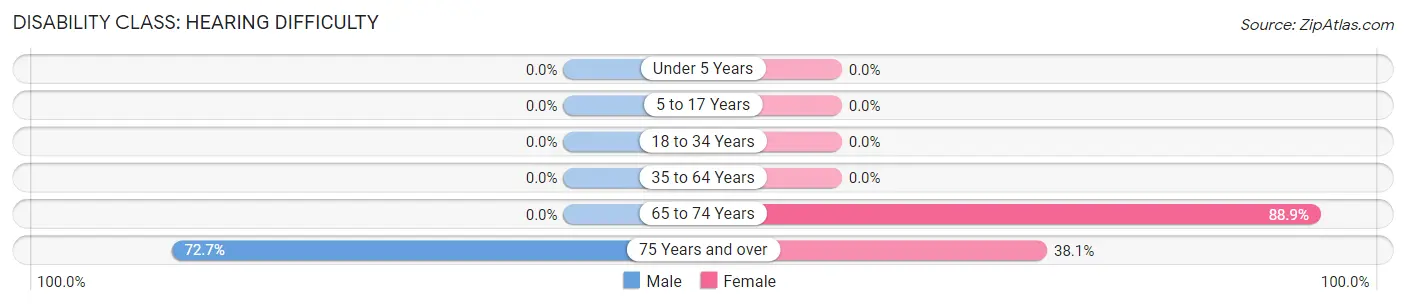
| Age Bracket | Male | Female |
| Under 5 Years | 0 (0.0%) | 0 (0.0%) |
| 5 to 17 Years | 0 (0.0%) | 0 (0.0%) |
| 18 to 34 Years | 0 (0.0%) | 0 (0.0%) |
| 35 to 64 Years | 0 (0.0%) | 0 (0.0%) |
| 65 to 74 Years | 0 (0.0%) | 24 (88.9%) |
| 75 Years and over | 8 (72.7%) | 8 (38.1%) |
Disability Class: Vision Difficulty
| Age Bracket | Male | Female |
| Under 5 Years | 0 (0.0%) | 0 (0.0%) |
| 5 to 17 Years | 0 (0.0%) | 0 (0.0%) |
| 18 to 34 Years | 0 (0.0%) | 0 (0.0%) |
| 35 to 64 Years | 0 (0.0%) | 0 (0.0%) |
| 65 to 74 Years | 0 (0.0%) | 0 (0.0%) |
| 75 Years and over | 0 (0.0%) | 0 (0.0%) |
Disability Class: Cognitive Difficulty
| Age Bracket | Male | Female |
| 5 to 17 Years | 0 (0.0%) | 0 (0.0%) |
| 18 to 34 Years | 0 (0.0%) | 0 (0.0%) |
| 35 to 64 Years | 0 (0.0%) | 0 (0.0%) |
| 65 to 74 Years | 0 (0.0%) | 0 (0.0%) |
| 75 Years and over | 0 (0.0%) | 0 (0.0%) |
Disability Class: Ambulatory Difficulty
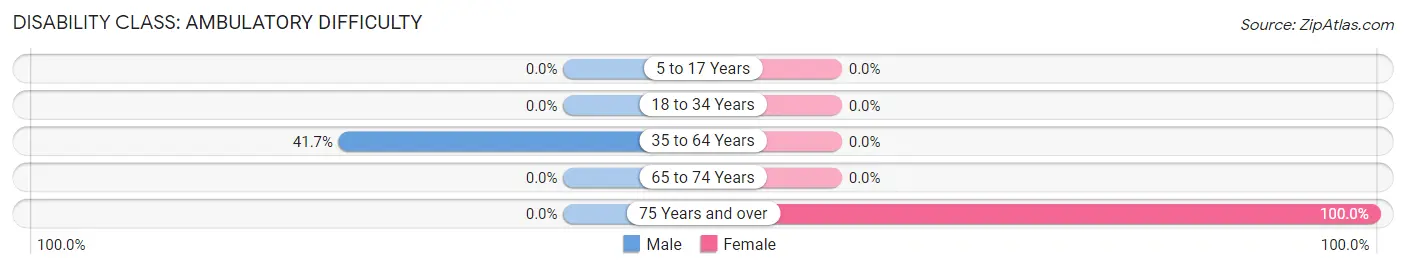
| Age Bracket | Male | Female |
| 5 to 17 Years | 0 (0.0%) | 0 (0.0%) |
| 18 to 34 Years | 0 (0.0%) | 0 (0.0%) |
| 35 to 64 Years | 5 (41.7%) | 0 (0.0%) |
| 65 to 74 Years | 0 (0.0%) | 0 (0.0%) |
| 75 Years and over | 0 (0.0%) | 21 (100.0%) |
Disability Class: Self-Care Difficulty
| Age Bracket | Male | Female |
| 5 to 17 Years | 0 (0.0%) | 0 (0.0%) |
| 18 to 34 Years | 0 (0.0%) | 0 (0.0%) |
| 35 to 64 Years | 0 (0.0%) | 0 (0.0%) |
| 65 to 74 Years | 0 (0.0%) | 0 (0.0%) |
| 75 Years and over | 0 (0.0%) | 0 (0.0%) |
Technology Access in Markham
Computing Device Access in Markham
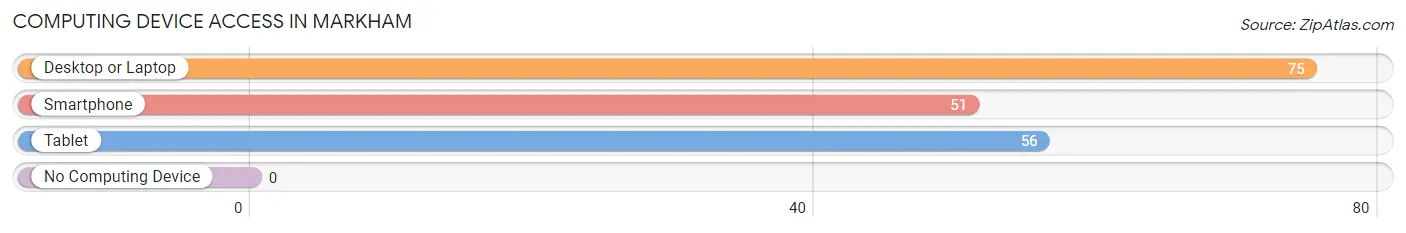
| Device Type | # Households | % Households |
| Desktop or Laptop | 75 | 100.0% |
| Smartphone | 51 | 68.0% |
| Tablet | 56 | 74.7% |
| No Computing Device | 0 | 0.0% |
| Total | 75 | 100.0% |
Internet Access in Markham
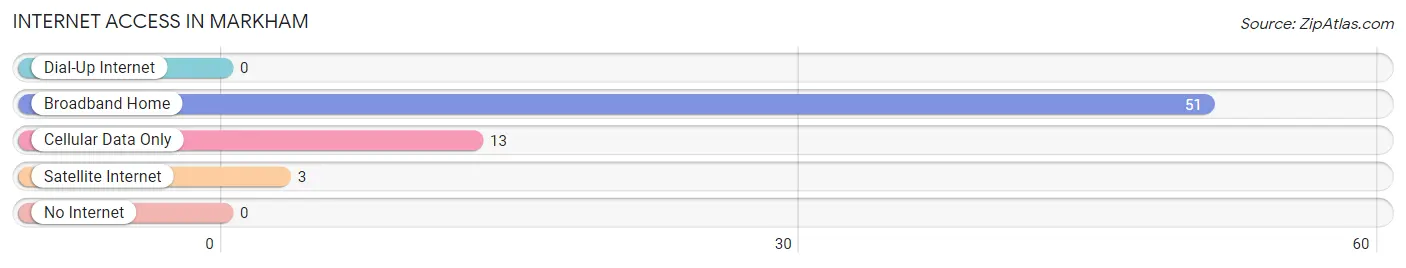
| Internet Type | # Households | % Households |
| Dial-Up Internet | 0 | 0.0% |
| Broadband Home | 51 | 68.0% |
| Cellular Data Only | 13 | 17.3% |
| Satellite Internet | 3 | 4.0% |
| No Internet | 0 | 0.0% |
| Total | 75 | 100.0% |
Markham Summary
Markham is a small town located in the state of Washington, United States. It is situated in the county of Whatcom, and is part of the Bellingham metropolitan area. The town has a population of approximately 1,500 people, and is located on the banks of the Nooksack River.
Geography
Markham is located in the northwest corner of Whatcom County, Washington, and is situated on the banks of the Nooksack River. The town is surrounded by the Cascade Mountains to the east, and the Puget Sound to the west. The town is located at an elevation of approximately 500 feet, and has a total area of 1.2 square miles. The climate in Markham is mild and temperate, with average temperatures ranging from the mid-30s in the winter to the mid-70s in the summer.
History
Markham was first settled in the late 1800s by a group of settlers from the Midwest. The town was originally named “Markham’s Landing” after the first settler, John Markham. The town was officially incorporated in 1891, and was named after the Markham family.
In the early 1900s, Markham was a thriving logging and farming community. The town was home to several sawmills, and the lumber industry was the main source of income for the town. The town also had a thriving dairy industry, and was home to several dairy farms.
In the late 1900s, Markham began to experience a decline in its economy. The sawmills and dairy farms began to close, and the town’s population began to decline. In the early 2000s, the town began to experience a resurgence in its economy, as new businesses began to move into the area.
Economy
Markham’s economy is largely based on the service industry. The town is home to several restaurants, retail stores, and other businesses. The town is also home to several small manufacturing companies, and is a popular destination for tourists.
The town is also home to several farms, and is a popular destination for farmers’ markets. The town is also home to several wineries, and is a popular destination for wine tasting.
Demographics
As of the 2010 census, Markham had a population of 1,500 people. The town is predominantly white, with approximately 90% of the population being white. The town also has a small Hispanic population, with approximately 5% of the population being Hispanic. The town also has a small Asian population, with approximately 2% of the population being Asian.
The median household income in Markham is approximately $50,000, and the median home value is approximately $200,000. The town has a high rate of homeownership, with approximately 75% of the population owning their own homes.
Conclusion
Markham is a small town located in the state of Washington, United States. It is situated in the county of Whatcom, and is part of the Bellingham metropolitan area. The town has a population of approximately 1,500 people, and is located on the banks of the Nooksack River. The town’s economy is largely based on the service industry, and the town is also home to several farms and wineries. The town is predominantly white, with approximately 90% of the population being white. The median household income in Markham is approximately $50,000, and the median home value is approximately $200,000.
Common Questions
What is Per Capita Income in Markham?
Per Capita income in Markham is $50,217.
What is the Median Family Income in Markham?
Median Family Income in Markham is $87,212.
What is the Median Household income in Markham?
Median Household Income in Markham is $64,792.
What is Inequality or Gini Index in Markham?
Inequality or Gini Index in Markham is 0.31.
What is the Total Population of Markham?
Total Population of Markham is 132.
What is the Total Male Population of Markham?
Total Male Population of Markham is 50.
What is the Total Female Population of Markham?
Total Female Population of Markham is 82.
What is the Ratio of Males per 100 Females in Markham?
There are 60.98 Males per 100 Females in Markham.
What is the Ratio of Females per 100 Males in Markham?
There are 164.00 Females per 100 Males in Markham.
What is the Median Population Age in Markham?
Median Population Age in Markham is 65.8 Years.
What is the Average Family Size in Markham
Average Family Size in Markham is 2.1 People.
What is the Average Household Size in Markham
Average Household Size in Markham is 1.8 People.
How Large is the Labor Force in Markham?
There are 41 People in the Labor Forcein in Markham.
What is the Percentage of People in the Labor Force in Markham?
31.1% of People are in the Labor Force in Markham.