Zip Codes with the Highest Percentage of Population Employed in Installation, Maintenance & Repair in Seattle, WA
RELATED REPORTS & OPTIONS
Installation, Maintenance & Repair
Seattle
Compare Zip Codes
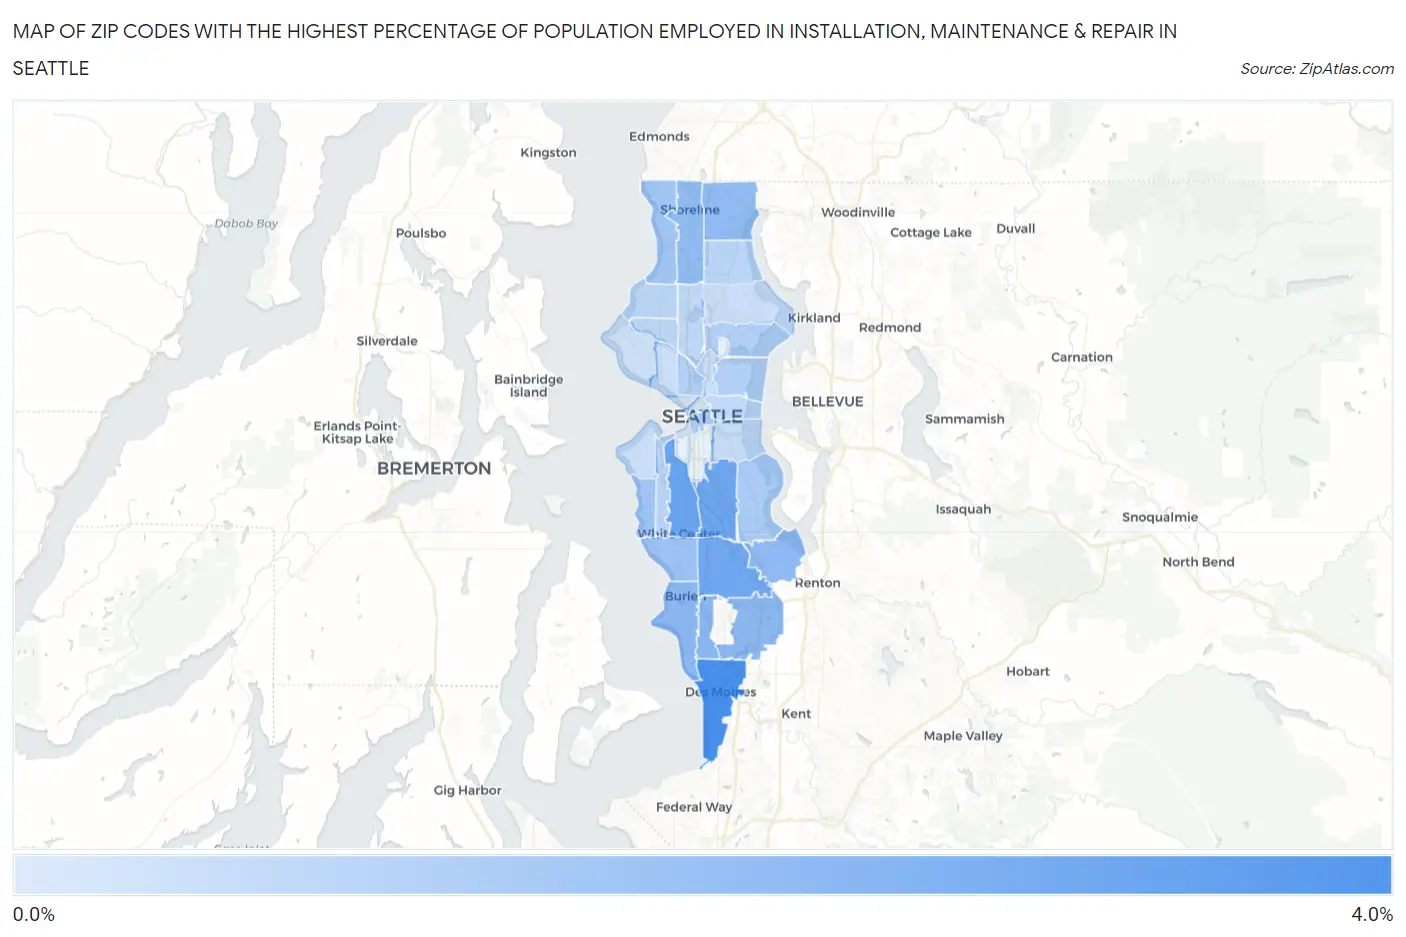
Map of Zip Codes with the Highest Percentage of Population Employed in Installation, Maintenance & Repair in Seattle
0.11%
3.8%
Zip Codes with the Highest Percentage of Population Employed in Installation, Maintenance & Repair in Seattle, WA
| Zip Code | % Employed | vs State | vs National | |
| 1. | 98198 | 3.8% | 2.9%(+0.891)#210 | 3.1%(+0.752)#13,150 |
| 2. | 98106 | 2.9% | 2.9%(+0.013)#284 | 3.1%(-0.126)#17,262 |
| 3. | 98108 | 2.8% | 2.9%(-0.103)#295 | 3.1%(-0.242)#17,867 |
| 4. | 98168 | 2.8% | 2.9%(-0.169)#303 | 3.1%(-0.308)#18,213 |
| 5. | 98148 | 2.1% | 2.9%(-0.781)#362 | 3.1%(-0.920)#21,318 |
| 6. | 98166 | 2.1% | 2.9%(-0.823)#367 | 3.1%(-0.961)#21,510 |
| 7. | 98188 | 2.1% | 2.9%(-0.854)#369 | 3.1%(-0.993)#21,670 |
| 8. | 98178 | 2.0% | 2.9%(-0.913)#372 | 3.1%(-1.05)#21,940 |
| 9. | 98133 | 2.0% | 2.9%(-0.940)#374 | 3.1%(-1.08)#22,077 |
| 10. | 98155 | 2.0% | 2.9%(-0.953)#377 | 3.1%(-1.09)#22,125 |
| 11. | 98146 | 1.8% | 2.9%(-1.18)#399 | 3.1%(-1.32)#23,113 |
| 12. | 98136 | 1.6% | 2.9%(-1.33)#407 | 3.1%(-1.47)#23,776 |
| 13. | 98177 | 1.5% | 2.9%(-1.44)#417 | 3.1%(-1.57)#24,184 |
| 14. | 98118 | 1.3% | 2.9%(-1.58)#430 | 3.1%(-1.72)#24,739 |
| 15. | 98104 | 1.2% | 2.9%(-1.76)#440 | 3.1%(-1.90)#25,389 |
| 16. | 98112 | 1.1% | 2.9%(-1.79)#442 | 3.1%(-1.93)#25,463 |
| 17. | 98105 | 1.1% | 2.9%(-1.80)#444 | 3.1%(-1.94)#25,500 |
| 18. | 98109 | 1.1% | 2.9%(-1.81)#446 | 3.1%(-1.95)#25,524 |
| 19. | 98126 | 1.0% | 2.9%(-1.89)#451 | 3.1%(-2.03)#25,823 |
| 20. | 98125 | 0.96% | 2.9%(-1.97)#456 | 3.1%(-2.11)#26,039 |
| 21. | 98117 | 0.88% | 2.9%(-2.05)#464 | 3.1%(-2.19)#26,252 |
| 22. | 98107 | 0.88% | 2.9%(-2.05)#465 | 3.1%(-2.19)#26,255 |
| 23. | 98103 | 0.82% | 2.9%(-2.11)#468 | 3.1%(-2.25)#26,419 |
| 24. | 98122 | 0.77% | 2.9%(-2.16)#472 | 3.1%(-2.30)#26,597 |
| 25. | 98144 | 0.69% | 2.9%(-2.23)#474 | 3.1%(-2.37)#26,793 |
| 26. | 98116 | 0.58% | 2.9%(-2.35)#477 | 3.1%(-2.49)#27,057 |
| 27. | 98115 | 0.57% | 2.9%(-2.36)#478 | 3.1%(-2.50)#27,079 |
| 28. | 98102 | 0.54% | 2.9%(-2.39)#479 | 3.1%(-2.53)#27,126 |
| 29. | 98119 | 0.48% | 2.9%(-2.45)#480 | 3.1%(-2.59)#27,255 |
| 30. | 98199 | 0.42% | 2.9%(-2.50)#485 | 3.1%(-2.64)#27,351 |
| 31. | 98101 | 0.33% | 2.9%(-2.59)#487 | 3.1%(-2.73)#27,508 |
| 32. | 98121 | 0.11% | 2.9%(-2.82)#491 | 3.1%(-2.96)#27,763 |
1
Common Questions
What are the Top 10 Zip Codes with the Highest Percentage of Population Employed in Installation, Maintenance & Repair in Seattle, WA?
Top 10 Zip Codes with the Highest Percentage of Population Employed in Installation, Maintenance & Repair in Seattle, WA are:
What zip code has the Highest Percentage of Population Employed in Installation, Maintenance & Repair in Seattle, WA?
98198 has the Highest Percentage of Population Employed in Installation, Maintenance & Repair in Seattle, WA with 3.8%.
What is the Percentage of Population Employed in Installation, Maintenance & Repair in Seattle, WA?
Percentage of Population Employed in Installation, Maintenance & Repair in Seattle is 1.0%.
What is the Percentage of Population Employed in Installation, Maintenance & Repair in Washington?
Percentage of Population Employed in Installation, Maintenance & Repair in Washington is 2.9%.
What is the Percentage of Population Employed in Installation, Maintenance & Repair in the United States?
Percentage of Population Employed in Installation, Maintenance & Repair in the United States is 3.1%.