Zip Codes with the Highest Percentage of Population Employed in Installation, Maintenance & Repair in Kennewick, WA
RELATED REPORTS & OPTIONS
Installation, Maintenance & Repair
Kennewick
Compare Zip Codes
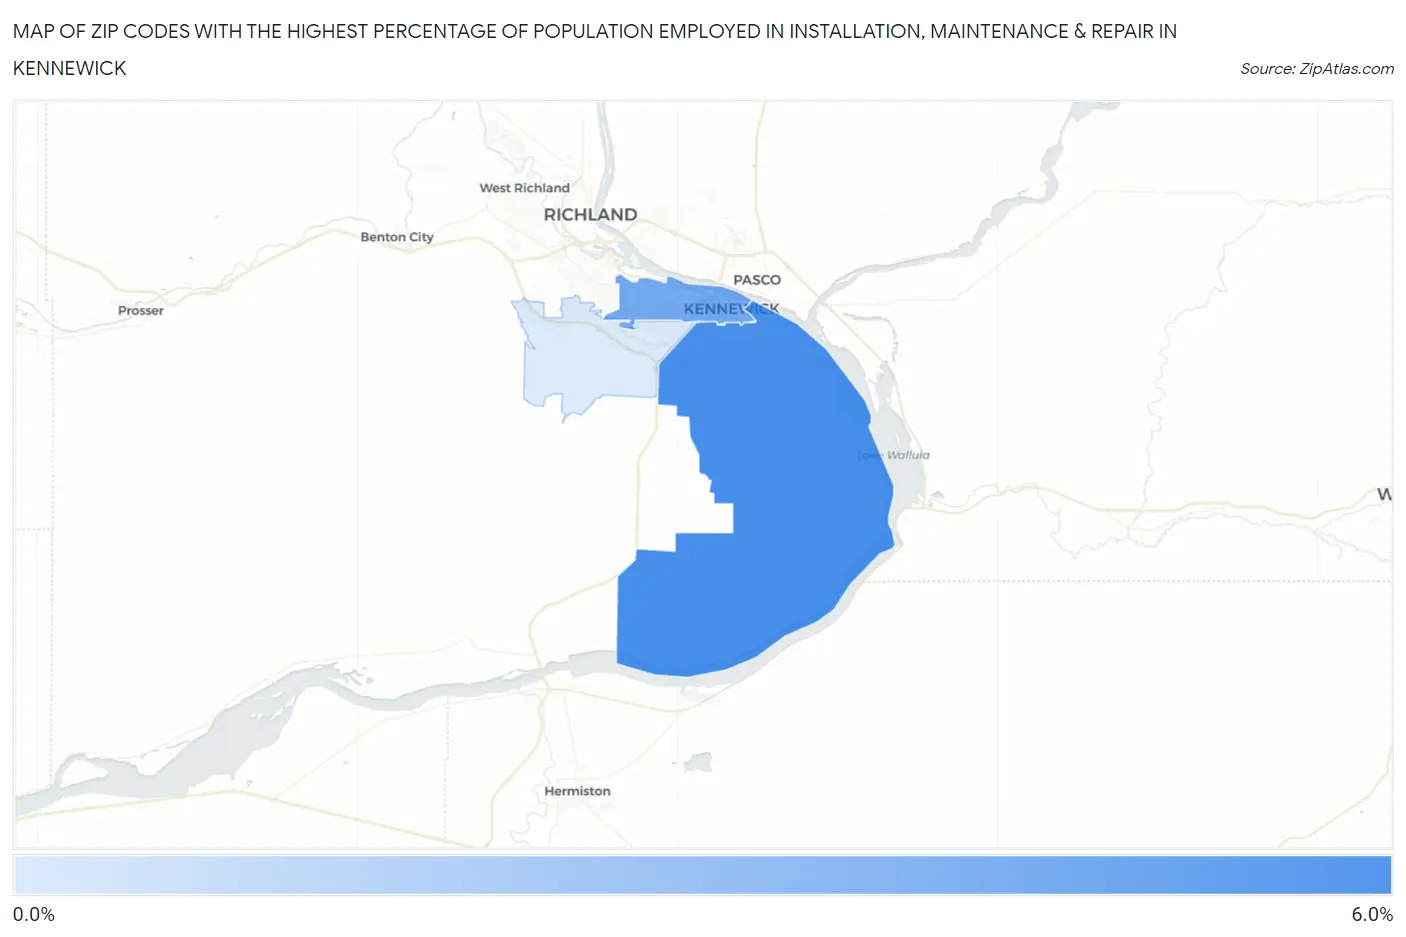
Map of Zip Codes with the Highest Percentage of Population Employed in Installation, Maintenance & Repair in Kennewick
0.74%
5.2%
Zip Codes with the Highest Percentage of Population Employed in Installation, Maintenance & Repair in Kennewick, WA
| Zip Code | % Employed | vs State | vs National | |
| 1. | 99337 | 5.2% | 2.9%(+2.30)#124 | 3.1%(+2.16)#8,007 |
| 2. | 99336 | 3.9% | 2.9%(+0.952)#202 | 3.1%(+0.813)#12,887 |
| 3. | 99338 | 0.74% | 2.9%(-2.19)#473 | 3.1%(-2.33)#26,661 |
1
Common Questions
What are the Top Zip Codes with the Highest Percentage of Population Employed in Installation, Maintenance & Repair in Kennewick, WA?
Top Zip Codes with the Highest Percentage of Population Employed in Installation, Maintenance & Repair in Kennewick, WA are:
What zip code has the Highest Percentage of Population Employed in Installation, Maintenance & Repair in Kennewick, WA?
99337 has the Highest Percentage of Population Employed in Installation, Maintenance & Repair in Kennewick, WA with 5.2%.
What is the Percentage of Population Employed in Installation, Maintenance & Repair in Kennewick, WA?
Percentage of Population Employed in Installation, Maintenance & Repair in Kennewick is 3.8%.
What is the Percentage of Population Employed in Installation, Maintenance & Repair in Washington?
Percentage of Population Employed in Installation, Maintenance & Repair in Washington is 2.9%.
What is the Percentage of Population Employed in Installation, Maintenance & Repair in the United States?
Percentage of Population Employed in Installation, Maintenance & Repair in the United States is 3.1%.