Gold Bar, WA Map & Demographics
Gold Bar Map
Gold Bar Overview
$34,540
PER CAPITA INCOME
$98,365
AVG FAMILY INCOME
$84,310
AVG HOUSEHOLD INCOME
27.5%
WAGE / INCOME GAP [ % ]
72.5¢/ $1
WAGE / INCOME GAP [ $ ]
0.33
INEQUALITY / GINI INDEX
2,338
TOTAL POPULATION
1,201
MALE POPULATION
1,137
FEMALE POPULATION
105.63
MALES / 100 FEMALES
94.67
FEMALES / 100 MALES
35.4
MEDIAN AGE
3.6
AVG FAMILY SIZE
2.8
AVG HOUSEHOLD SIZE
1,222
LABOR FORCE [ PEOPLE ]
68.8%
PERCENT IN LABOR FORCE
5.3%
UNEMPLOYMENT RATE
Gold Bar Zip Codes
Gold Bar Area Codes
Income in Gold Bar
Income Overview in Gold Bar
Per Capita Income in Gold Bar is $34,540, while median incomes of families and households are $98,365 and $84,310 respectively.
| Characteristic | Number | Measure |
| Per Capita Income | 2,338 | $34,540 |
| Median Family Income | 551 | $98,365 |
| Mean Family Income | 551 | $107,182 |
| Median Household Income | 828 | $84,310 |
| Mean Household Income | 828 | $92,178 |
| Income Deficit | 551 | $0 |
| Wage / Income Gap (%) | 2,338 | 27.51% |
| Wage / Income Gap ($) | 2,338 | 72.49¢ per $1 |
| Gini / Inequality Index | 2,338 | 0.33 |
Earnings by Sex in Gold Bar
Average Earnings in Gold Bar are $50,737, $55,395 for men and $40,156 for women, a difference of 27.5%.
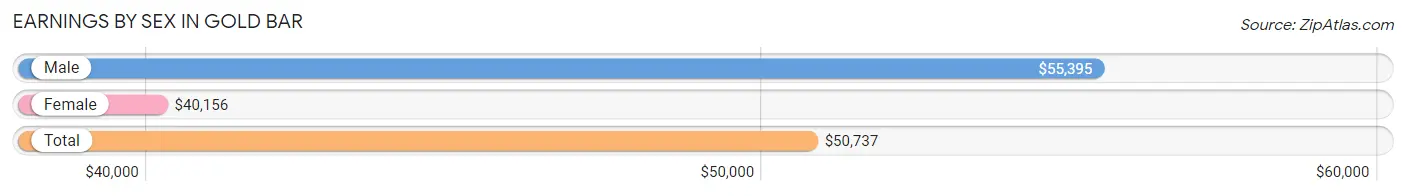
| Sex | Number | Average Earnings |
| Male | 720 (56.8%) | $55,395 |
| Female | 547 (43.2%) | $40,156 |
| Total | 1,267 (100.0%) | $50,737 |
Earnings by Sex by Income Bracket in Gold Bar
The most common earnings brackets in Gold Bar are $55,000 to $64,999 for men (130 | 18.1%) and $100,000+ for women (99 | 18.1%).
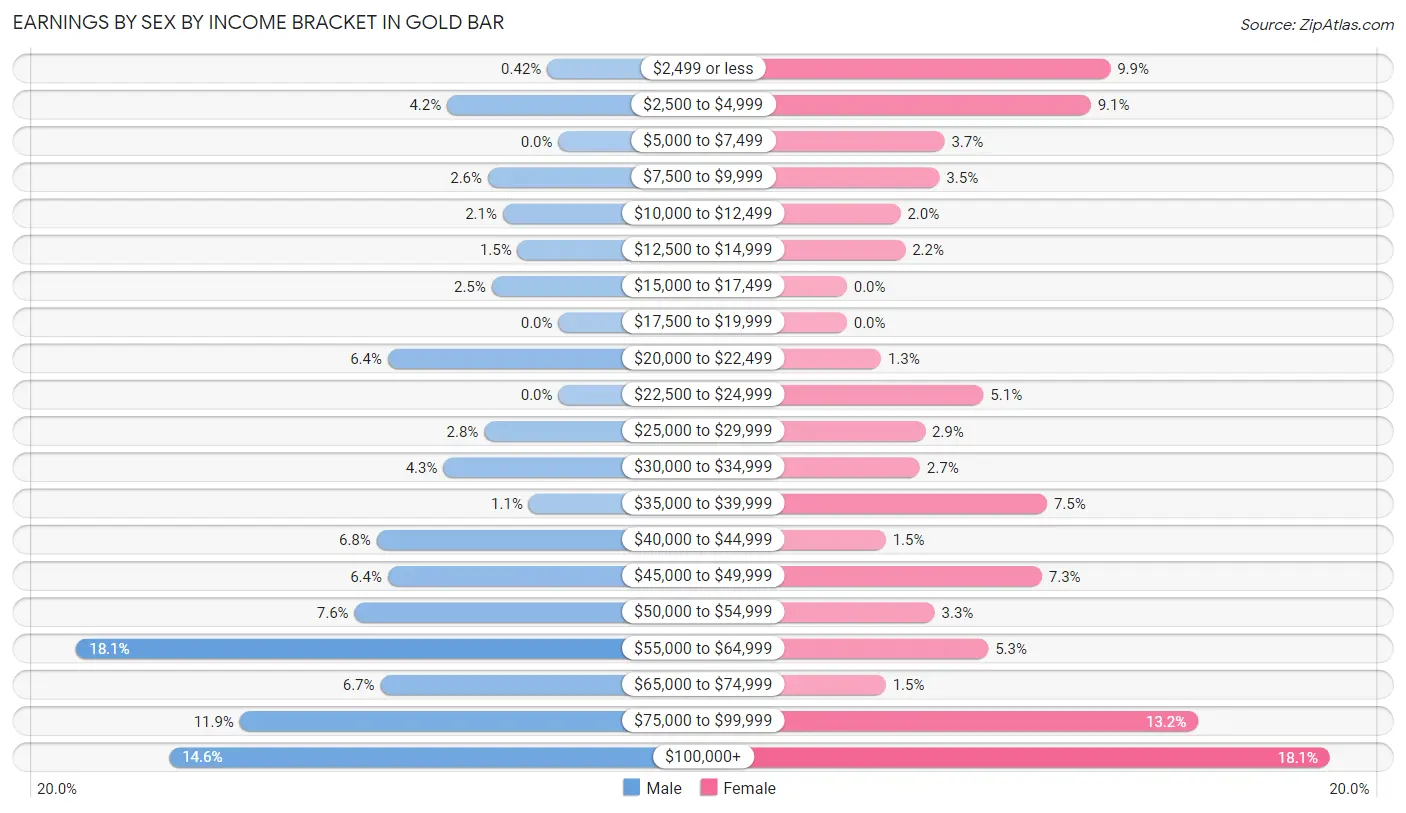
| Income | Male | Female |
| $2,499 or less | 3 (0.4%) | 54 (9.9%) |
| $2,500 to $4,999 | 30 (4.2%) | 50 (9.1%) |
| $5,000 to $7,499 | 0 (0.0%) | 20 (3.7%) |
| $7,500 to $9,999 | 19 (2.6%) | 19 (3.5%) |
| $10,000 to $12,499 | 15 (2.1%) | 11 (2.0%) |
| $12,500 to $14,999 | 11 (1.5%) | 12 (2.2%) |
| $15,000 to $17,499 | 18 (2.5%) | 0 (0.0%) |
| $17,500 to $19,999 | 0 (0.0%) | 0 (0.0%) |
| $20,000 to $22,499 | 46 (6.4%) | 7 (1.3%) |
| $22,500 to $24,999 | 0 (0.0%) | 28 (5.1%) |
| $25,000 to $29,999 | 20 (2.8%) | 16 (2.9%) |
| $30,000 to $34,999 | 31 (4.3%) | 15 (2.7%) |
| $35,000 to $39,999 | 8 (1.1%) | 41 (7.5%) |
| $40,000 to $44,999 | 49 (6.8%) | 8 (1.5%) |
| $45,000 to $49,999 | 46 (6.4%) | 40 (7.3%) |
| $50,000 to $54,999 | 55 (7.6%) | 18 (3.3%) |
| $55,000 to $64,999 | 130 (18.1%) | 29 (5.3%) |
| $65,000 to $74,999 | 48 (6.7%) | 8 (1.5%) |
| $75,000 to $99,999 | 86 (11.9%) | 72 (13.2%) |
| $100,000+ | 105 (14.6%) | 99 (18.1%) |
| Total | 720 (100.0%) | 547 (100.0%) |
Earnings by Sex by Educational Attainment in Gold Bar
Average earnings in Gold Bar are $56,776 for men and $55,313 for women, a difference of 2.6%. Men with an educational attainment of bachelor's degree enjoy the highest average annual earnings of $101,250, while those with less than high school education earn the least with $45,417. Women with an educational attainment of graduate degree earn the most with the average annual earnings of $88,636, while those with college or associate's degree education have the smallest earnings of $68,750.
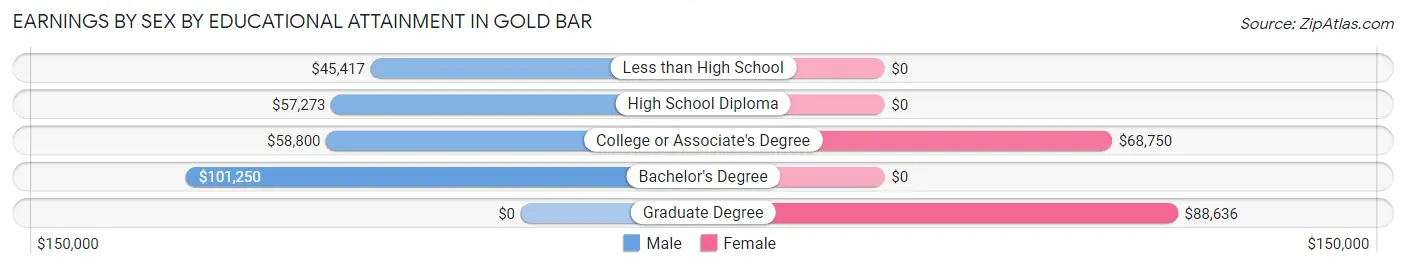
| Educational Attainment | Male Income | Female Income |
| Less than High School | $45,417 | $0 |
| High School Diploma | $57,273 | $0 |
| College or Associate's Degree | $58,800 | $68,750 |
| Bachelor's Degree | $101,250 | $0 |
| Graduate Degree | - | - |
| Total | $56,776 | $55,313 |
Family Income in Gold Bar
Family Income Brackets in Gold Bar
According to the Gold Bar family income data, there are 142 families falling into the $75,000 to $99,999 income range, which is the most common income bracket and makes up 25.8% of all families.
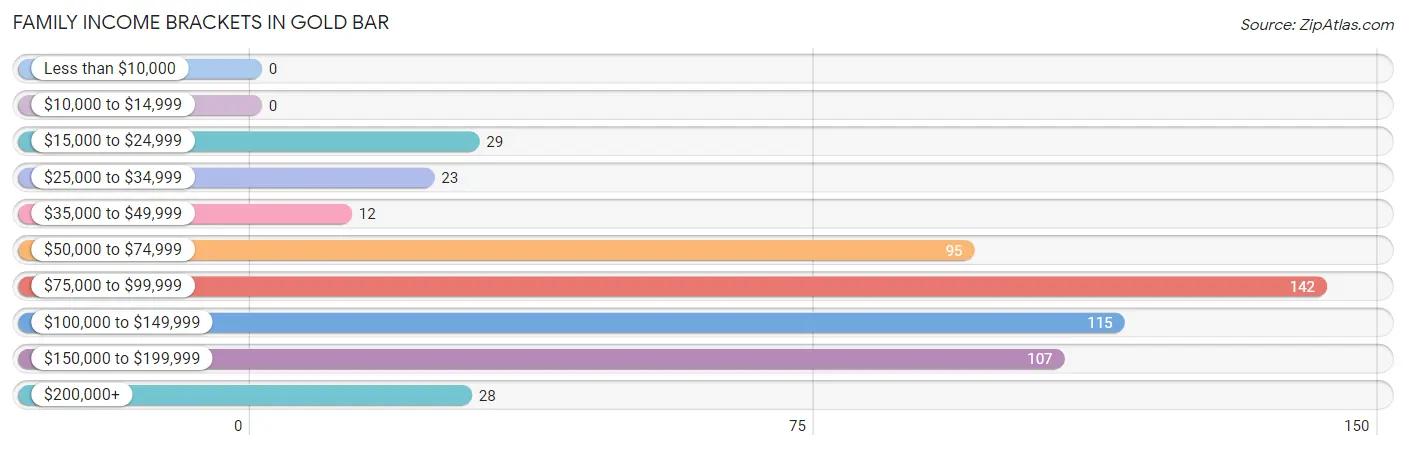
| Income Bracket | # Families | % Families |
| Less than $10,000 | 0 | 0.0% |
| $10,000 to $14,999 | 0 | 0.0% |
| $15,000 to $24,999 | 29 | 5.3% |
| $25,000 to $34,999 | 23 | 4.2% |
| $35,000 to $49,999 | 12 | 2.2% |
| $50,000 to $74,999 | 95 | 17.2% |
| $75,000 to $99,999 | 142 | 25.8% |
| $100,000 to $149,999 | 115 | 20.9% |
| $150,000 to $199,999 | 107 | 19.4% |
| $200,000+ | 28 | 5.1% |
Family Income by Famaliy Size in Gold Bar
5-person families (56 | 10.2%) account for the highest median family income in Gold Bar with $133,393 per family, while 2-person families (165 | 29.9%) have the highest median income of $49,451 per family member.
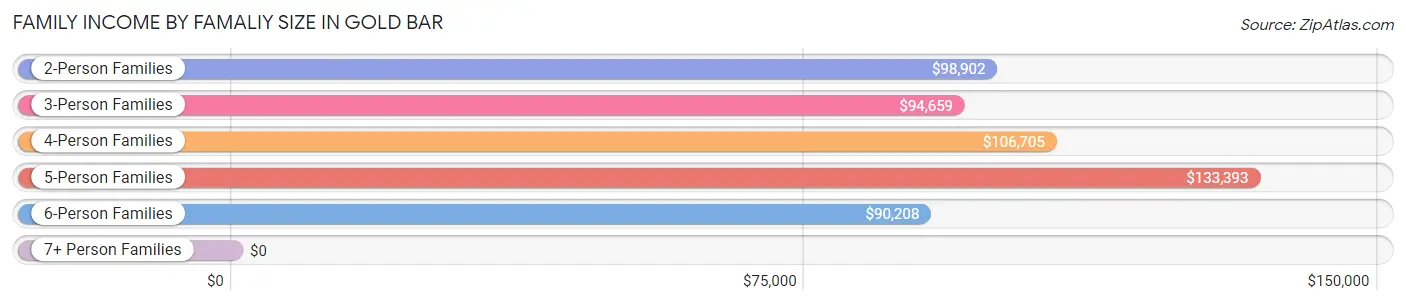
| Income Bracket | # Families | Median Income |
| 2-Person Families | 165 (29.9%) | $98,902 |
| 3-Person Families | 137 (24.9%) | $94,659 |
| 4-Person Families | 139 (25.2%) | $106,705 |
| 5-Person Families | 56 (10.2%) | $133,393 |
| 6-Person Families | 54 (9.8%) | $90,208 |
| 7+ Person Families | 0 (0.0%) | $0 |
| Total | 551 (100.0%) | $98,365 |
Family Income by Number of Earners in Gold Bar
The median family income in Gold Bar is $98,365, with families comprising 3+ earners (113) having the highest median family income of $134,375, while families with no earners (21) have the lowest median family income of $38,854, accounting for 20.5% and 3.8% of families, respectively.
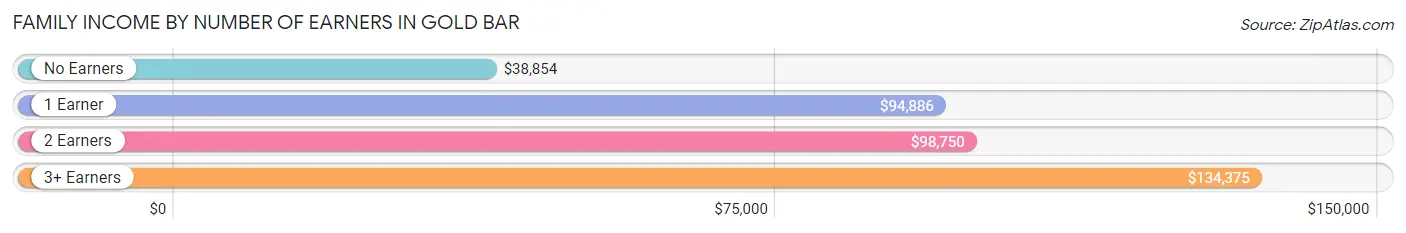
| Number of Earners | # Families | Median Income |
| No Earners | 21 (3.8%) | $38,854 |
| 1 Earner | 215 (39.0%) | $94,886 |
| 2 Earners | 202 (36.7%) | $98,750 |
| 3+ Earners | 113 (20.5%) | $134,375 |
| Total | 551 (100.0%) | $98,365 |
Household Income in Gold Bar
Household Income Brackets in Gold Bar
With 163 households falling in the category, the $75,000 to $99,999 income range is the most frequent in Gold Bar, accounting for 19.7% of all households. In contrast, only 11 households (1.3%) fall into the less than $10,000 income bracket, making it the least populous group.
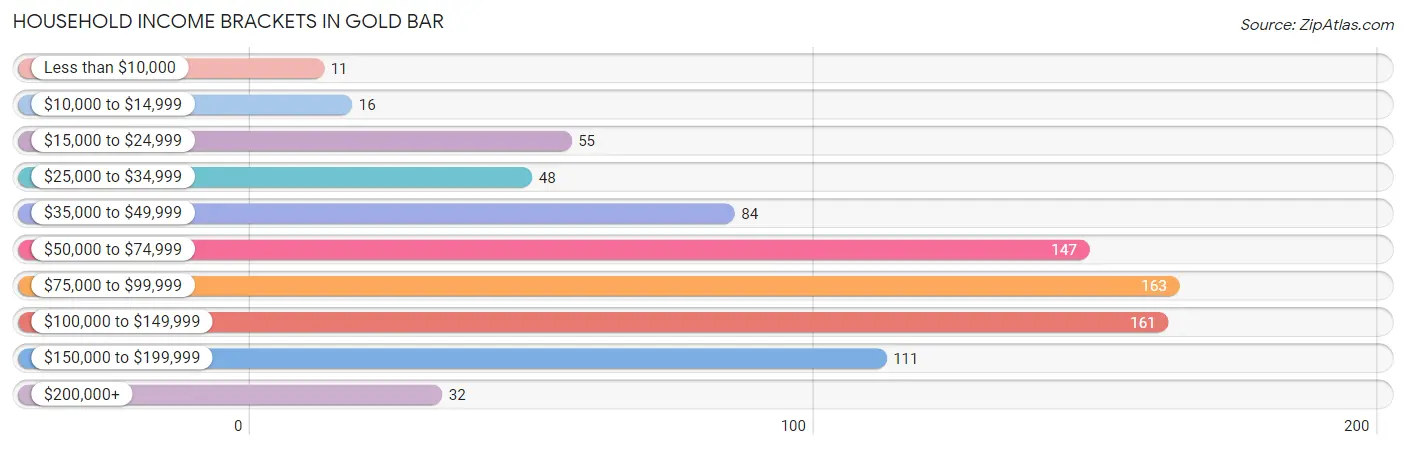
| Income Bracket | # Households | % Households |
| Less than $10,000 | 11 | 1.3% |
| $10,000 to $14,999 | 16 | 1.9% |
| $15,000 to $24,999 | 55 | 6.6% |
| $25,000 to $34,999 | 48 | 5.8% |
| $35,000 to $49,999 | 84 | 10.1% |
| $50,000 to $74,999 | 147 | 17.8% |
| $75,000 to $99,999 | 163 | 19.7% |
| $100,000 to $149,999 | 161 | 19.4% |
| $150,000 to $199,999 | 111 | 13.4% |
| $200,000+ | 32 | 3.9% |
Household Income by Householder Age in Gold Bar
The median household income in Gold Bar is $84,310, with the highest median household income of $104,750 found in the 45 to 64 years age bracket for the primary householder. A total of 357 households (43.1%) fall into this category. Meanwhile, the 15 to 24 years age bracket for the primary householder has the lowest median household income of $0, with 18 households (2.2%) in this group.
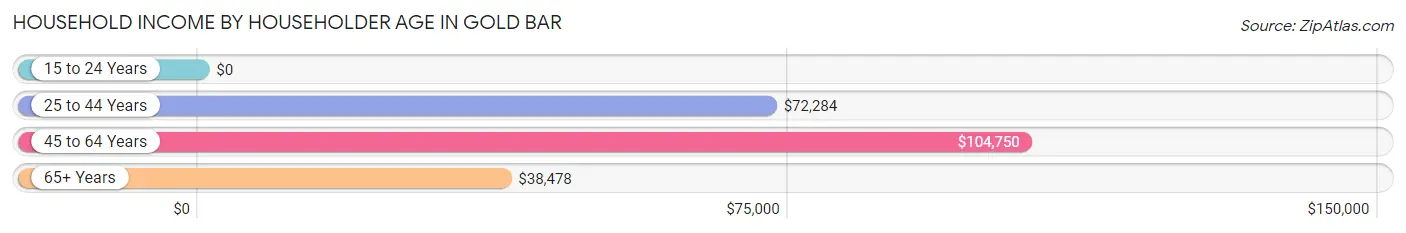
| Income Bracket | # Households | Median Income |
| 15 to 24 Years | 18 (2.2%) | $0 |
| 25 to 44 Years | 271 (32.7%) | $72,284 |
| 45 to 64 Years | 357 (43.1%) | $104,750 |
| 65+ Years | 182 (22.0%) | $38,478 |
| Total | 828 (100.0%) | $84,310 |
Poverty in Gold Bar
Income Below Poverty by Sex and Age in Gold Bar
With 7.2% poverty level for males and 11.3% for females among the residents of Gold Bar, 5 year old males and 25 to 34 year old females are the most vulnerable to poverty, with 8 males (57.1%) and 44 females (28.9%) in their respective age groups living below the poverty level.
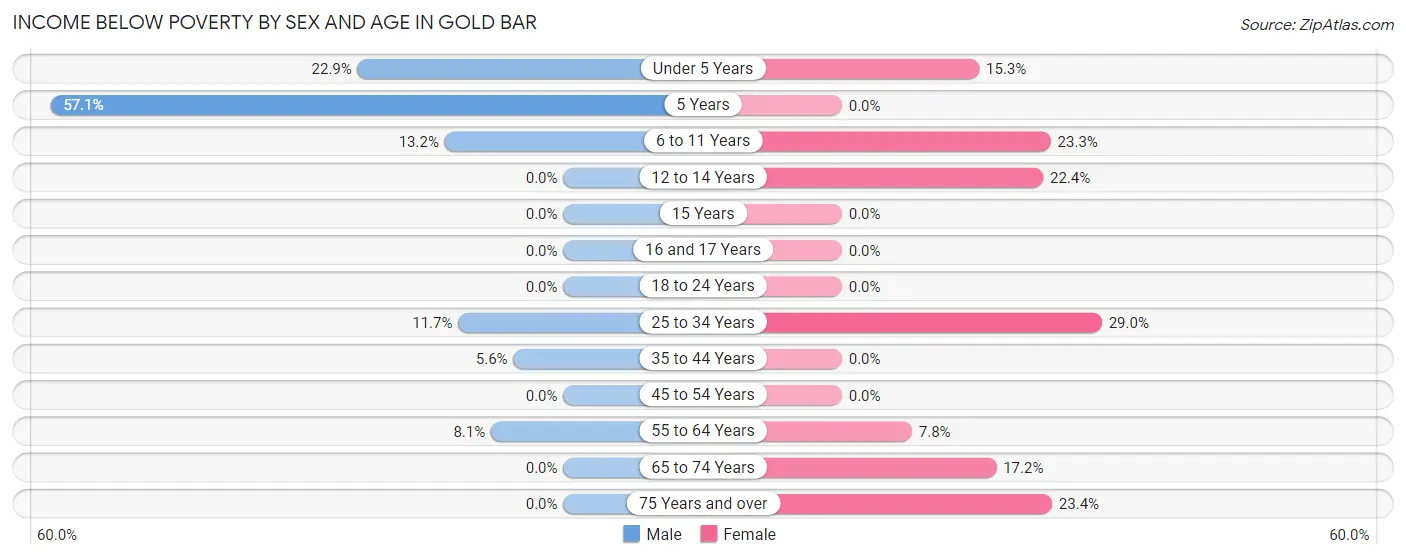
| Age Bracket | Male | Female |
| Under 5 Years | 22 (22.9%) | 13 (15.3%) |
| 5 Years | 8 (57.1%) | 0 (0.0%) |
| 6 to 11 Years | 14 (13.2%) | 20 (23.3%) |
| 12 to 14 Years | 0 (0.0%) | 13 (22.4%) |
| 15 Years | 0 (0.0%) | 0 (0.0%) |
| 16 and 17 Years | 0 (0.0%) | 0 (0.0%) |
| 18 to 24 Years | 0 (0.0%) | 0 (0.0%) |
| 25 to 34 Years | 22 (11.7%) | 44 (28.9%) |
| 35 to 44 Years | 8 (5.6%) | 0 (0.0%) |
| 45 to 54 Years | 0 (0.0%) | 0 (0.0%) |
| 55 to 64 Years | 12 (8.1%) | 11 (7.8%) |
| 65 to 74 Years | 0 (0.0%) | 16 (17.2%) |
| 75 Years and over | 0 (0.0%) | 11 (23.4%) |
| Total | 86 (7.2%) | 128 (11.3%) |
Income Above Poverty by Sex and Age in Gold Bar
According to the poverty statistics in Gold Bar, males aged 12 to 14 years and females aged 5 years are the age groups that are most secure financially, with 100.0% of males and 100.0% of females in these age groups living above the poverty line.
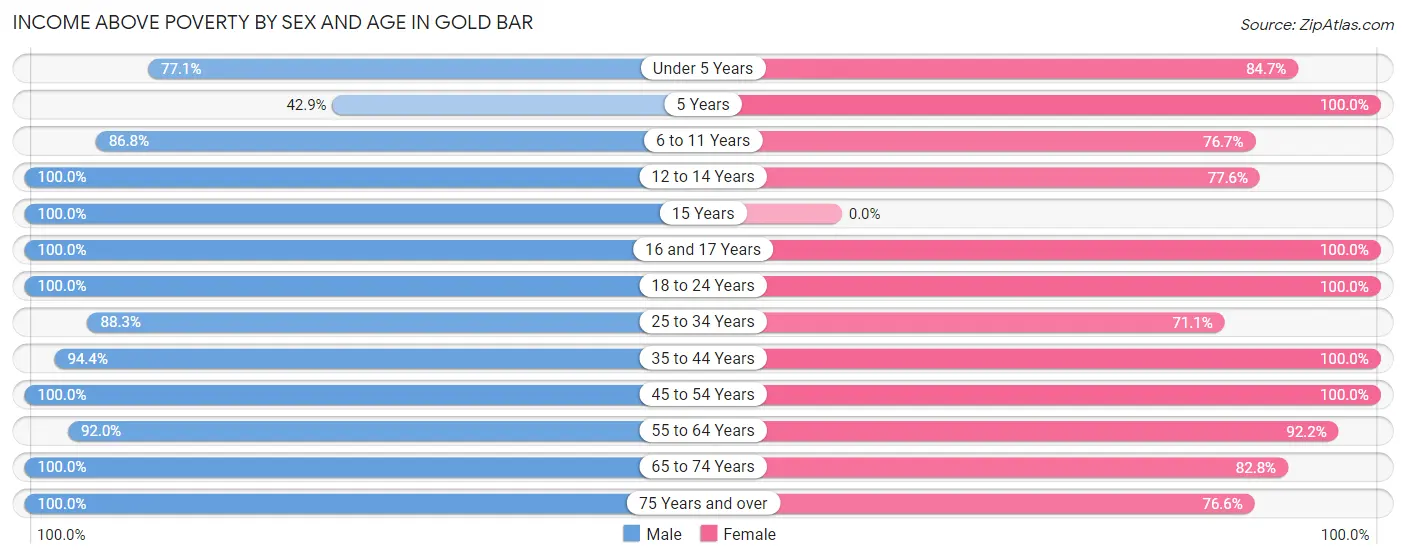
| Age Bracket | Male | Female |
| Under 5 Years | 74 (77.1%) | 72 (84.7%) |
| 5 Years | 6 (42.9%) | 7 (100.0%) |
| 6 to 11 Years | 92 (86.8%) | 66 (76.7%) |
| 12 to 14 Years | 93 (100.0%) | 45 (77.6%) |
| 15 Years | 11 (100.0%) | 0 (0.0%) |
| 16 and 17 Years | 36 (100.0%) | 32 (100.0%) |
| 18 to 24 Years | 69 (100.0%) | 119 (100.0%) |
| 25 to 34 Years | 166 (88.3%) | 108 (71.1%) |
| 35 to 44 Years | 136 (94.4%) | 141 (100.0%) |
| 45 to 54 Years | 189 (100.0%) | 176 (100.0%) |
| 55 to 64 Years | 137 (91.9%) | 130 (92.2%) |
| 65 to 74 Years | 71 (100.0%) | 77 (82.8%) |
| 75 Years and over | 29 (100.0%) | 36 (76.6%) |
| Total | 1,109 (92.8%) | 1,009 (88.7%) |
Income Below Poverty Among Married-Couple Families in Gold Bar
The poverty statistics for married-couple families in Gold Bar show that 6.8% or 30 of the total 444 families live below the poverty line. Families with 3 or 4 children have the highest poverty rate of 22.0%, comprising of 11 families. On the other hand, families with no children have the lowest poverty rate of 0.0%, which includes 0 families.
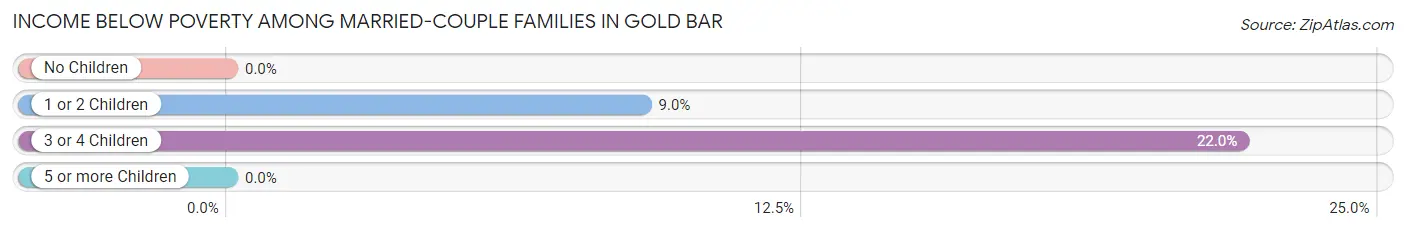
| Children | Above Poverty | Below Poverty |
| No Children | 183 (100.0%) | 0 (0.0%) |
| 1 or 2 Children | 192 (91.0%) | 19 (9.0%) |
| 3 or 4 Children | 39 (78.0%) | 11 (22.0%) |
| 5 or more Children | 0 (0.0%) | 0 (0.0%) |
| Total | 414 (93.2%) | 30 (6.8%) |
Income Below Poverty Among Single-Parent Households in Gold Bar
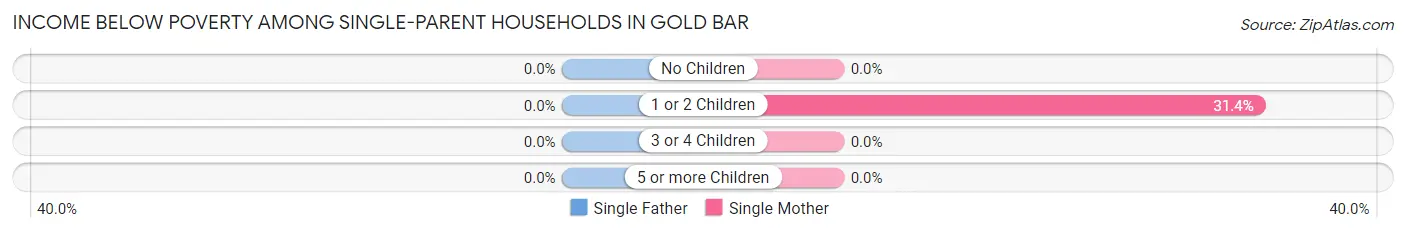
| Children | Single Father | Single Mother |
| No Children | 0 (0.0%) | 0 (0.0%) |
| 1 or 2 Children | 0 (0.0%) | 11 (31.4%) |
| 3 or 4 Children | 0 (0.0%) | 0 (0.0%) |
| 5 or more Children | 0 (0.0%) | 0 (0.0%) |
| Total | 0 (0.0%) | 11 (11.1%) |
Income Below Poverty Among Married-Couple vs Single-Parent Households in Gold Bar
The poverty data for Gold Bar shows that 30 of the married-couple family households (6.8%) and 11 of the single-parent households (10.3%) are living below the poverty level. Within the married-couple family households, those with 3 or 4 children have the highest poverty rate, with 11 households (22.0%) falling below the poverty line. Among the single-parent households, those with 1 or 2 children have the highest poverty rate, with 11 household (25.6%) living below poverty.
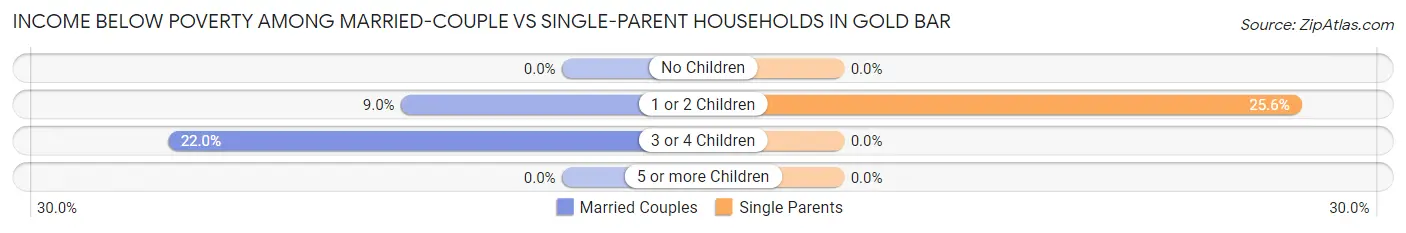
| Children | Married-Couple Families | Single-Parent Households |
| No Children | 0 (0.0%) | 0 (0.0%) |
| 1 or 2 Children | 19 (9.0%) | 11 (25.6%) |
| 3 or 4 Children | 11 (22.0%) | 0 (0.0%) |
| 5 or more Children | 0 (0.0%) | 0 (0.0%) |
| Total | 30 (6.8%) | 11 (10.3%) |
Race in Gold Bar
The most populous races in Gold Bar are White / Caucasian (1,853 | 79.3%), Hispanic or Latino (311 | 13.3%), and Two or more Races (231 | 9.9%).
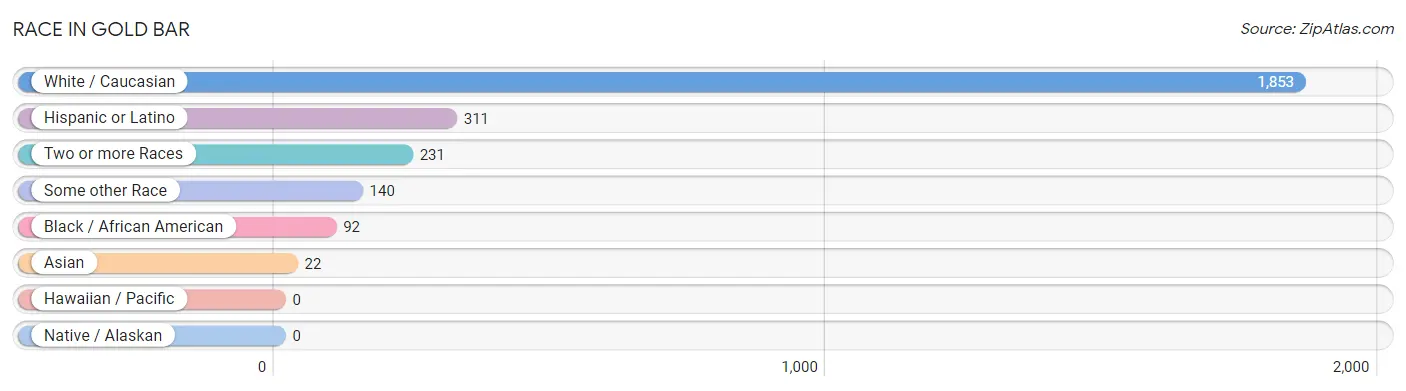
| Race | # Population | % Population |
| Asian | 22 | 0.9% |
| Black / African American | 92 | 3.9% |
| Hawaiian / Pacific | 0 | 0.0% |
| Hispanic or Latino | 311 | 13.3% |
| Native / Alaskan | 0 | 0.0% |
| White / Caucasian | 1,853 | 79.3% |
| Two or more Races | 231 | 9.9% |
| Some other Race | 140 | 6.0% |
| Total | 2,338 | 100.0% |
Ancestry in Gold Bar
The most populous ancestries reported in Gold Bar are German (368 | 15.7%), English (278 | 11.9%), Irish (276 | 11.8%), Central American (181 | 7.7%), and Norwegian (152 | 6.5%), together accounting for 53.7% of all Gold Bar residents.
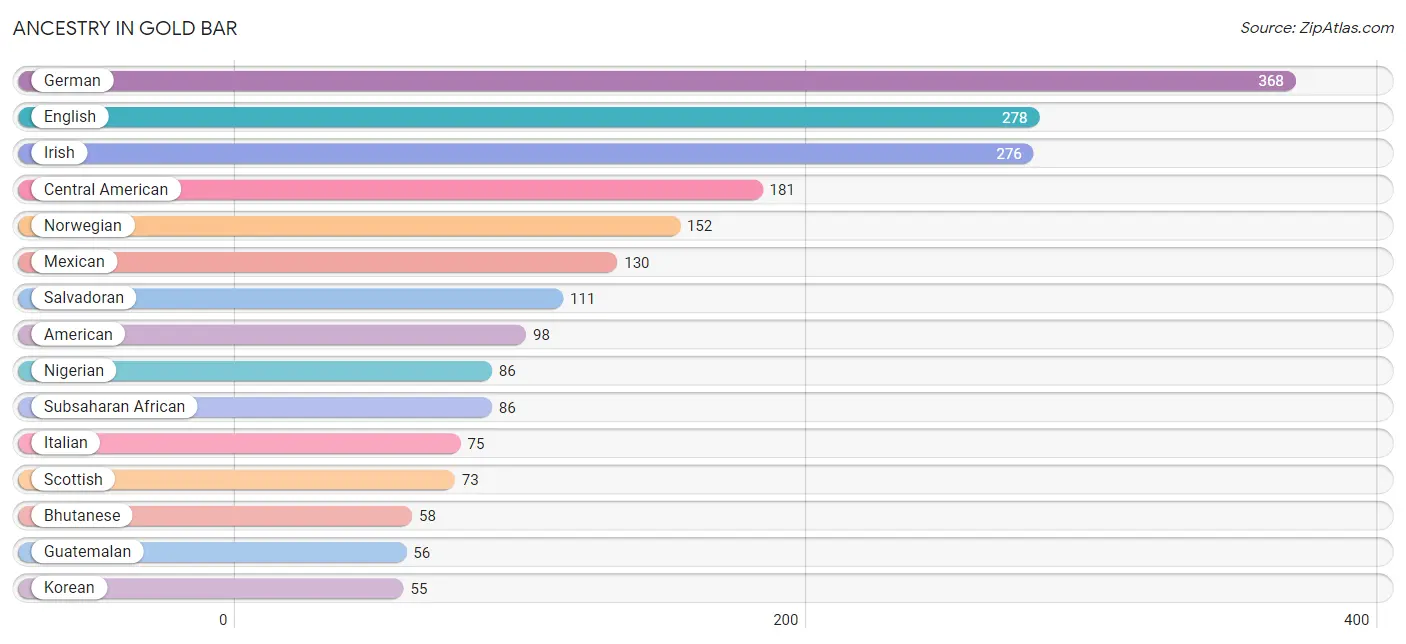
| Ancestry | # Population | % Population |
| American | 98 | 4.2% |
| Bhutanese | 58 | 2.5% |
| British | 14 | 0.6% |
| Burmese | 23 | 1.0% |
| Canadian | 16 | 0.7% |
| Celtic | 13 | 0.6% |
| Central American | 181 | 7.7% |
| Cherokee | 5 | 0.2% |
| Danish | 34 | 1.5% |
| Dutch | 9 | 0.4% |
| Eastern European | 9 | 0.4% |
| English | 278 | 11.9% |
| European | 8 | 0.3% |
| French | 43 | 1.8% |
| German | 368 | 15.7% |
| Guatemalan | 56 | 2.4% |
| Honduran | 14 | 0.6% |
| Hungarian | 30 | 1.3% |
| Indian (Asian) | 45 | 1.9% |
| Irish | 276 | 11.8% |
| Italian | 75 | 3.2% |
| Korean | 55 | 2.4% |
| Mexican | 130 | 5.6% |
| Native Hawaiian | 23 | 1.0% |
| Nigerian | 86 | 3.7% |
| Norwegian | 152 | 6.5% |
| Polish | 27 | 1.1% |
| Portuguese | 17 | 0.7% |
| Russian | 12 | 0.5% |
| Salvadoran | 111 | 4.8% |
| Scandinavian | 54 | 2.3% |
| Scotch-Irish | 25 | 1.1% |
| Scottish | 73 | 3.1% |
| Slovak | 12 | 0.5% |
| Subsaharan African | 86 | 3.7% |
| Swedish | 49 | 2.1% |
| Turkish | 3 | 0.1% |
| Welsh | 21 | 0.9% | View All 38 Rows |
Immigrants in Gold Bar
The most numerous immigrant groups reported in Gold Bar came from Central America (149 | 6.4%), Latin America (149 | 6.4%), Africa (86 | 3.7%), Nigeria (86 | 3.7%), and Western Africa (86 | 3.7%), together accounting for 23.8% of all Gold Bar residents.
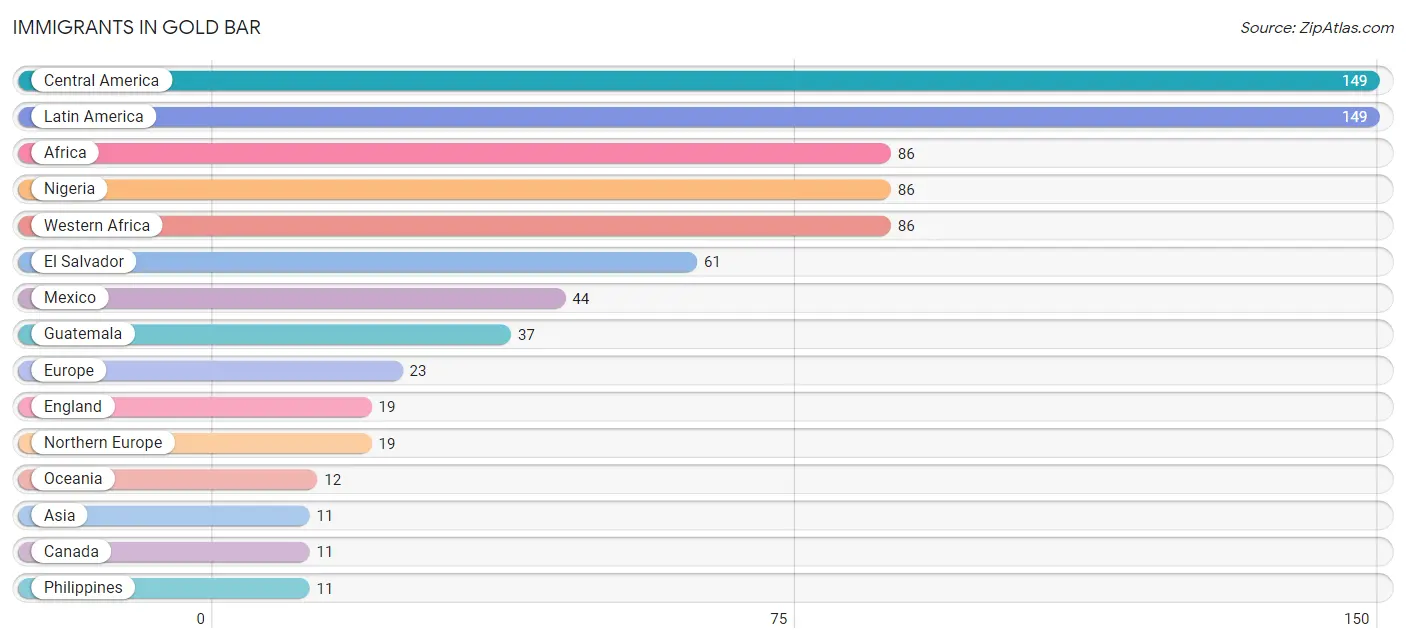
| Immigration Origin | # Population | % Population |
| Africa | 86 | 3.7% |
| Asia | 11 | 0.5% |
| Canada | 11 | 0.5% |
| Central America | 149 | 6.4% |
| El Salvador | 61 | 2.6% |
| England | 19 | 0.8% |
| Europe | 23 | 1.0% |
| Germany | 4 | 0.2% |
| Guatemala | 37 | 1.6% |
| Honduras | 7 | 0.3% |
| Latin America | 149 | 6.4% |
| Mexico | 44 | 1.9% |
| Nigeria | 86 | 3.7% |
| Northern Europe | 19 | 0.8% |
| Oceania | 12 | 0.5% |
| Philippines | 11 | 0.5% |
| South Eastern Asia | 11 | 0.5% |
| Western Africa | 86 | 3.7% |
| Western Europe | 4 | 0.2% | View All 19 Rows |
Sex and Age in Gold Bar
Sex and Age in Gold Bar
The most populous age groups in Gold Bar are 30 to 34 Years (123 | 10.2%) for men and 20 to 24 Years (108 | 9.5%) for women.
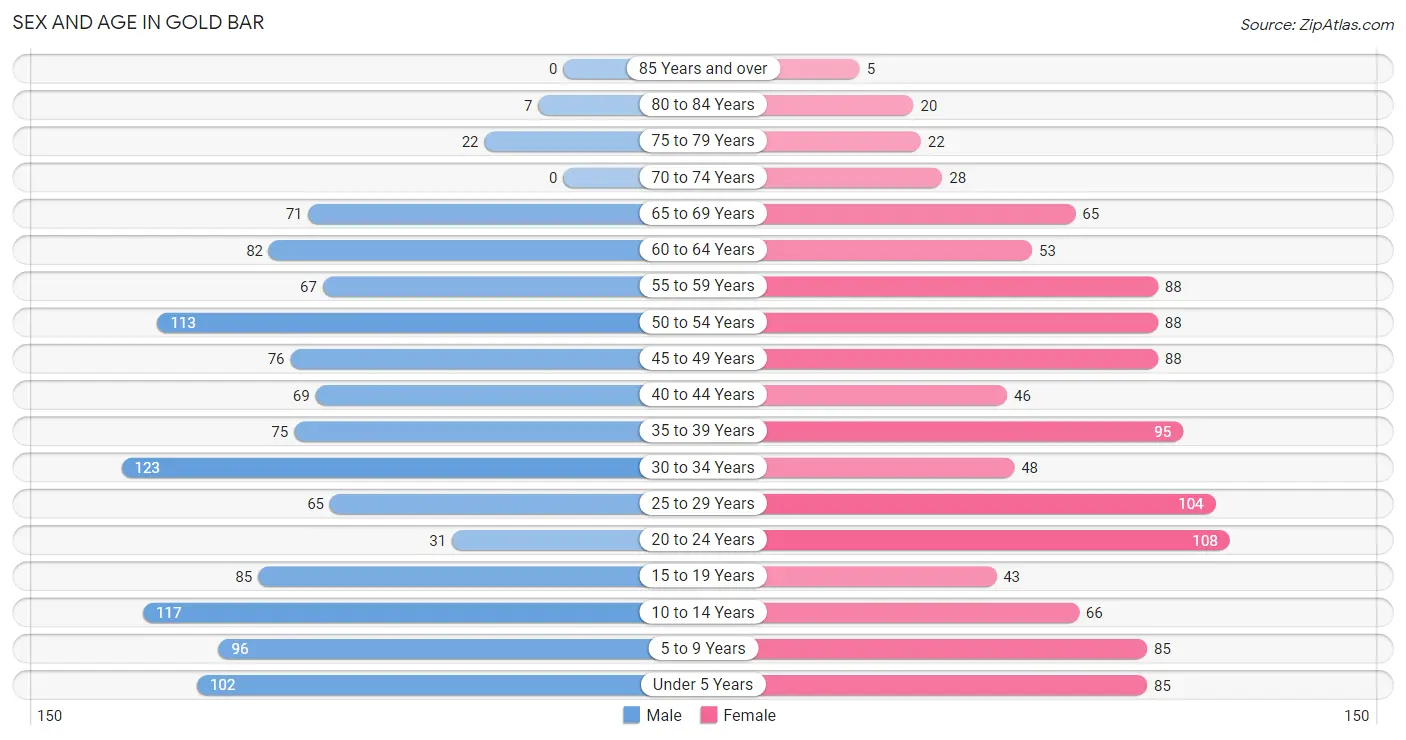
| Age Bracket | Male | Female |
| Under 5 Years | 102 (8.5%) | 85 (7.5%) |
| 5 to 9 Years | 96 (8.0%) | 85 (7.5%) |
| 10 to 14 Years | 117 (9.7%) | 66 (5.8%) |
| 15 to 19 Years | 85 (7.1%) | 43 (3.8%) |
| 20 to 24 Years | 31 (2.6%) | 108 (9.5%) |
| 25 to 29 Years | 65 (5.4%) | 104 (9.1%) |
| 30 to 34 Years | 123 (10.2%) | 48 (4.2%) |
| 35 to 39 Years | 75 (6.2%) | 95 (8.4%) |
| 40 to 44 Years | 69 (5.8%) | 46 (4.1%) |
| 45 to 49 Years | 76 (6.3%) | 88 (7.7%) |
| 50 to 54 Years | 113 (9.4%) | 88 (7.7%) |
| 55 to 59 Years | 67 (5.6%) | 88 (7.7%) |
| 60 to 64 Years | 82 (6.8%) | 53 (4.7%) |
| 65 to 69 Years | 71 (5.9%) | 65 (5.7%) |
| 70 to 74 Years | 0 (0.0%) | 28 (2.5%) |
| 75 to 79 Years | 22 (1.8%) | 22 (1.9%) |
| 80 to 84 Years | 7 (0.6%) | 20 (1.8%) |
| 85 Years and over | 0 (0.0%) | 5 (0.4%) |
| Total | 1,201 (100.0%) | 1,137 (100.0%) |
Families and Households in Gold Bar
Median Family Size in Gold Bar
The median family size in Gold Bar is 3.64 persons per family, with married-couple families (444 | 80.6%) accounting for the largest median family size of 3.86 persons per family. On the other hand, single female/mother families (99 | 18.0%) represent the smallest median family size with 2.72 persons per family.
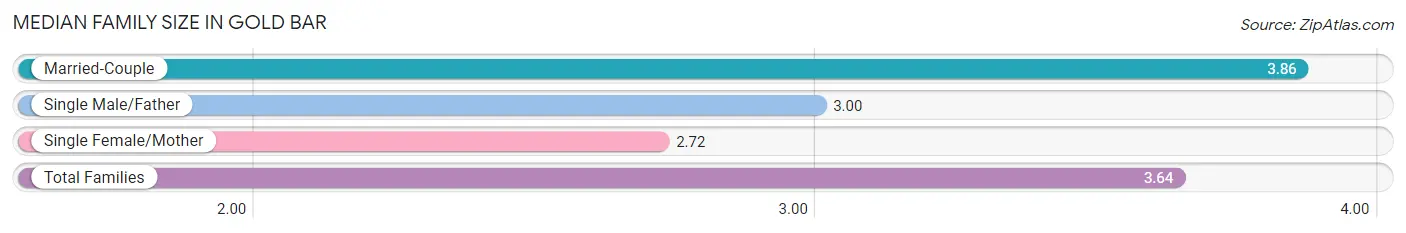
| Family Type | # Families | Family Size |
| Married-Couple | 444 (80.6%) | 3.86 |
| Single Male/Father | 8 (1.5%) | 3.00 |
| Single Female/Mother | 99 (18.0%) | 2.72 |
| Total Families | 551 (100.0%) | 3.64 |
Median Household Size in Gold Bar
The median household size in Gold Bar is 2.82 persons per household, with married-couple households (444 | 53.6%) accounting for the largest median household size of 3.87 persons per household. non-family households (277 | 33.5%) represent the smallest median household size with 1.17 persons per household.
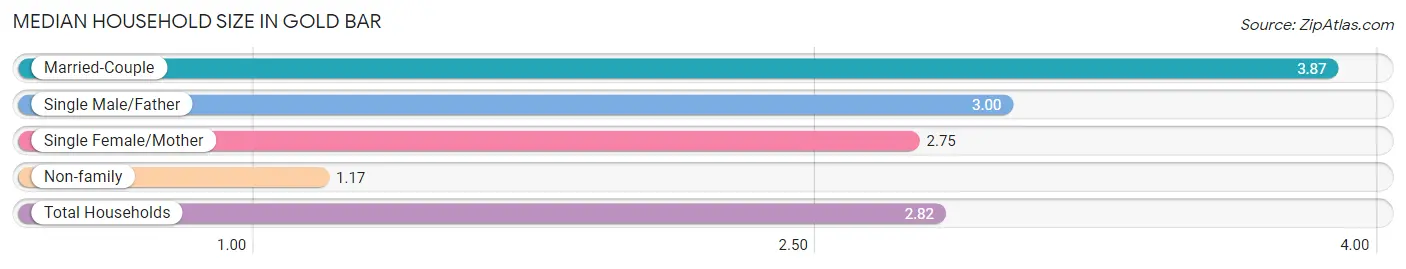
| Household Type | # Households | Household Size |
| Married-Couple | 444 (53.6%) | 3.87 |
| Single Male/Father | 8 (1.0%) | 3.00 |
| Single Female/Mother | 99 (12.0%) | 2.75 |
| Non-family | 277 (33.5%) | 1.17 |
| Total Households | 828 (100.0%) | 2.82 |
Household Size by Marriage Status in Gold Bar
Out of a total of 828 households in Gold Bar, 551 (66.5%) are family households, while 277 (33.5%) are nonfamily households. The most numerous type of family households are 2-person households, comprising 155, and the most common type of nonfamily households are 1-person households, comprising 244.
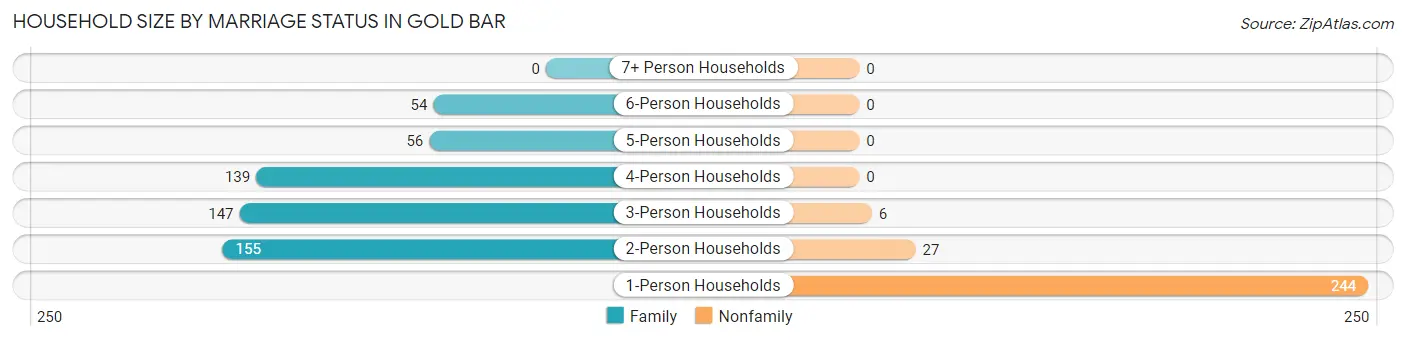
| Household Size | Family Households | Nonfamily Households |
| 1-Person Households | - | 244 (29.5%) |
| 2-Person Households | 155 (18.7%) | 27 (3.3%) |
| 3-Person Households | 147 (17.7%) | 6 (0.7%) |
| 4-Person Households | 139 (16.8%) | 0 (0.0%) |
| 5-Person Households | 56 (6.8%) | 0 (0.0%) |
| 6-Person Households | 54 (6.5%) | 0 (0.0%) |
| 7+ Person Households | 0 (0.0%) | 0 (0.0%) |
| Total | 551 (66.5%) | 277 (33.5%) |
Female Fertility in Gold Bar
Fertility by Age in Gold Bar
Average fertility rate in Gold Bar is 80.0 births per 1,000 women. Women in the age bracket of 20 to 34 years have the highest fertility rate with 169.0 births per 1,000 women. Women in the age bracket of 20 to 34 years acount for 100.0% of all women with births.
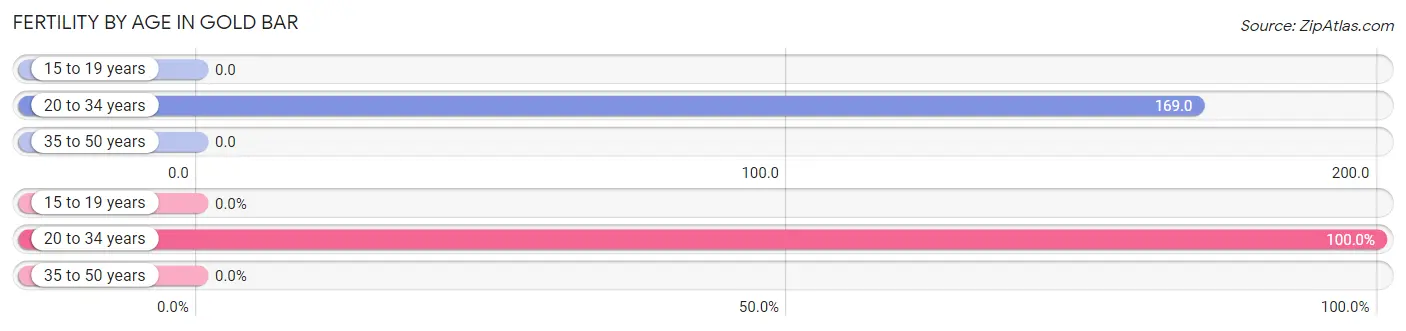
| Age Bracket | Women with Births | Births / 1,000 Women |
| 15 to 19 years | 0 (0.0%) | 0.0 |
| 20 to 34 years | 44 (100.0%) | 169.0 |
| 35 to 50 years | 0 (0.0%) | 0.0 |
| Total | 44 (100.0%) | 80.0 |
Fertility by Age by Marriage Status in Gold Bar
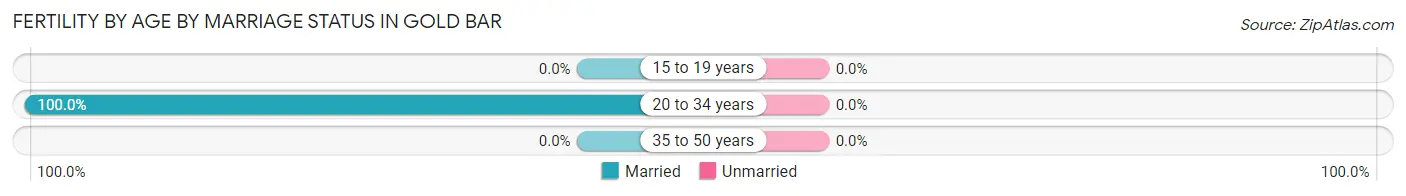
| Age Bracket | Married | Unmarried |
| 15 to 19 years | 0 (0.0%) | 0 (0.0%) |
| 20 to 34 years | 44 (100.0%) | 0 (0.0%) |
| 35 to 50 years | 0 (0.0%) | 0 (0.0%) |
| Total | 44 (100.0%) | 0 (0.0%) |
Fertility by Education in Gold Bar
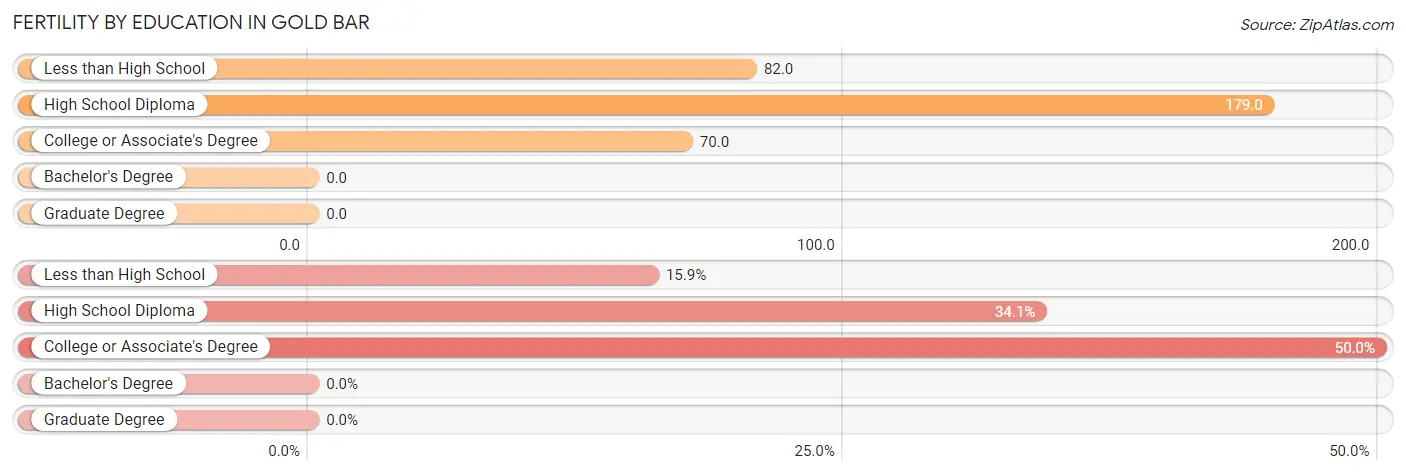
| Educational Attainment | Women with Births | Births / 1,000 Women |
| Less than High School | 7 (15.9%) | 82.0 |
| High School Diploma | 15 (34.1%) | 179.0 |
| College or Associate's Degree | 22 (50.0%) | 70.0 |
| Bachelor's Degree | 0 (0.0%) | 0.0 |
| Graduate Degree | 0 (0.0%) | 0.0 |
| Total | 44 (100.0%) | 80.0 |
Fertility by Education by Marriage Status in Gold Bar
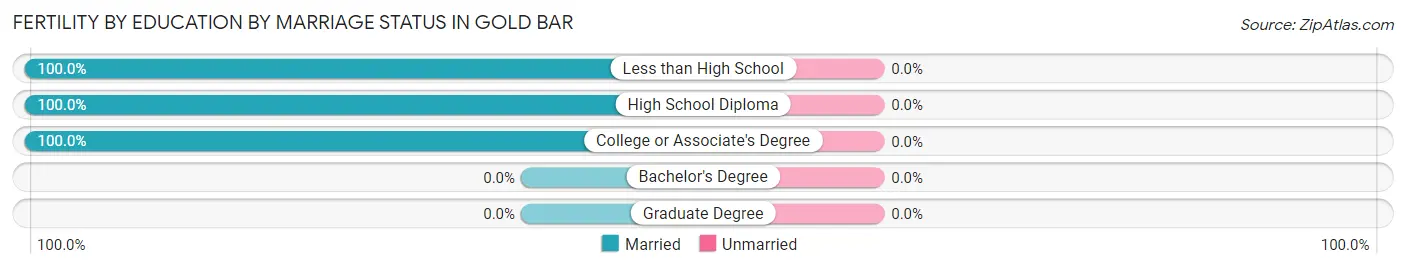
| Educational Attainment | Married | Unmarried |
| Less than High School | 7 (100.0%) | 0 (0.0%) |
| High School Diploma | 15 (100.0%) | 0 (0.0%) |
| College or Associate's Degree | 22 (100.0%) | 0 (0.0%) |
| Bachelor's Degree | 0 (0.0%) | 0 (0.0%) |
| Graduate Degree | 0 (0.0%) | 0 (0.0%) |
| Total | 44 (100.0%) | 0 (0.0%) |
Employment Characteristics in Gold Bar
Employment by Class of Employer in Gold Bar
Among the 1,049 employed individuals in Gold Bar, private company employees (775 | 73.9%), local government employees (122 | 11.6%), and not-for-profit organizations (63 | 6.0%) make up the most common classes of employment.
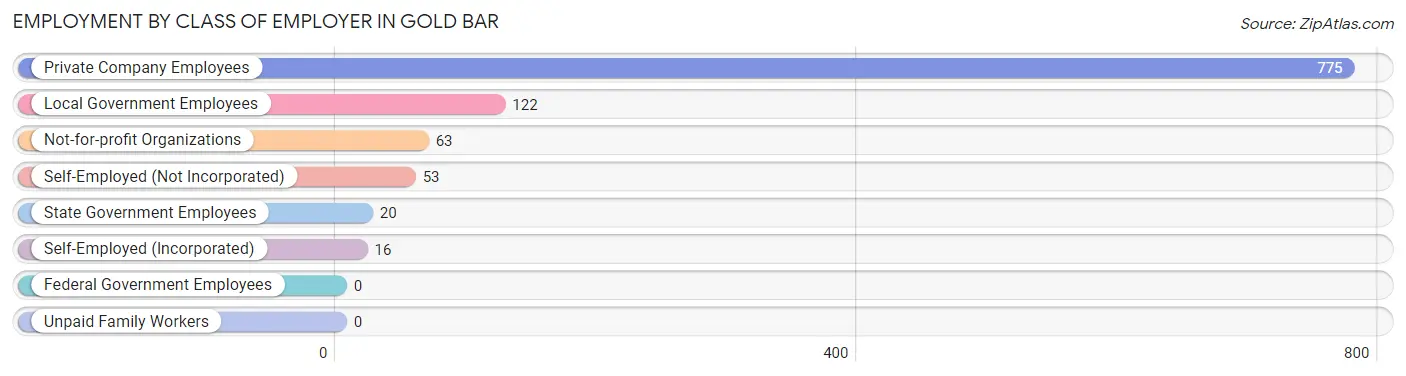
| Employer Class | # Employees | % Employees |
| Private Company Employees | 775 | 73.9% |
| Self-Employed (Incorporated) | 16 | 1.5% |
| Self-Employed (Not Incorporated) | 53 | 5.1% |
| Not-for-profit Organizations | 63 | 6.0% |
| Local Government Employees | 122 | 11.6% |
| State Government Employees | 20 | 1.9% |
| Federal Government Employees | 0 | 0.0% |
| Unpaid Family Workers | 0 | 0.0% |
| Total | 1,049 | 100.0% |
Employment Status by Age in Gold Bar
According to the labor force statistics for Gold Bar, out of the total population over 16 years of age (1,776), 68.8% or 1,222 individuals are in the labor force, with 5.3% or 65 of them unemployed. The age group with the highest labor force participation rate is 35 to 44 years, with 89.8% or 256 individuals in the labor force. Within the labor force, the 55 to 59 years age range has the highest percentage of unemployed individuals, with 29.7% or 33 of them being unemployed.
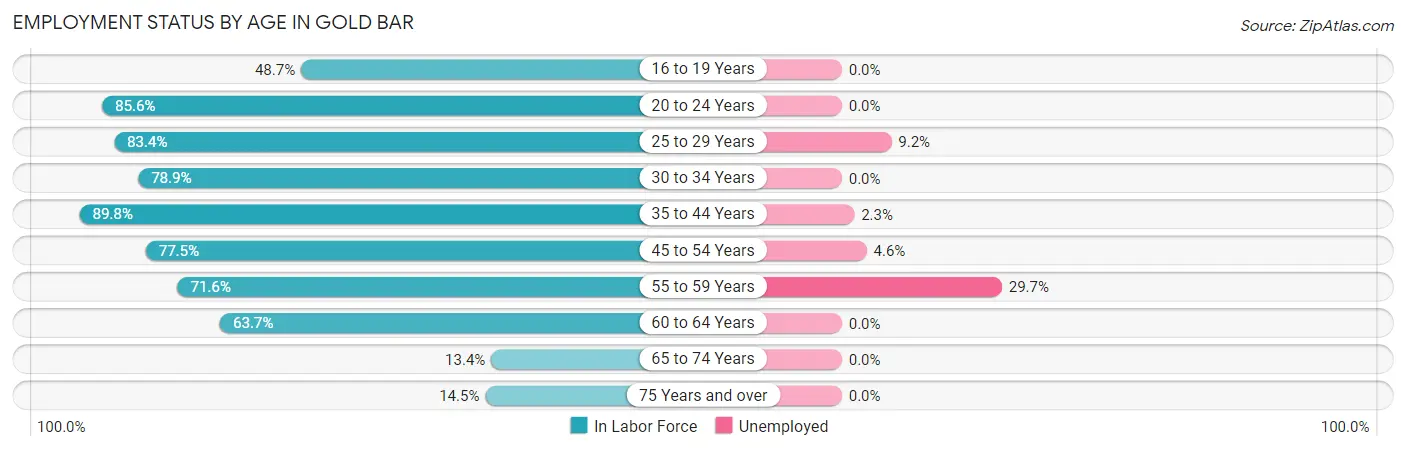
| Age Bracket | In Labor Force | Unemployed |
| 16 to 19 Years | 57 (48.7%) | 0 (0.0%) |
| 20 to 24 Years | 119 (85.6%) | 0 (0.0%) |
| 25 to 29 Years | 141 (83.4%) | 13 (9.2%) |
| 30 to 34 Years | 135 (78.9%) | 0 (0.0%) |
| 35 to 44 Years | 256 (89.8%) | 6 (2.3%) |
| 45 to 54 Years | 283 (77.5%) | 13 (4.6%) |
| 55 to 59 Years | 111 (71.6%) | 33 (29.7%) |
| 60 to 64 Years | 86 (63.7%) | 0 (0.0%) |
| 65 to 74 Years | 22 (13.4%) | 0 (0.0%) |
| 75 Years and over | 11 (14.5%) | 0 (0.0%) |
| Total | 1,222 (68.8%) | 65 (5.3%) |
Employment Status by Educational Attainment in Gold Bar
According to labor force statistics for Gold Bar, 79.1% of individuals (1,012) out of the total population between 25 and 64 years of age (1,280) are in the labor force, with 6.4% or 65 of them being unemployed. The group with the highest labor force participation rate are those with the educational attainment of college / associate degree, with 85.2% or 586 individuals in the labor force. Within the labor force, individuals with college / associate degree education have the highest percentage of unemployment, with 8.9% or 52 of them being unemployed.
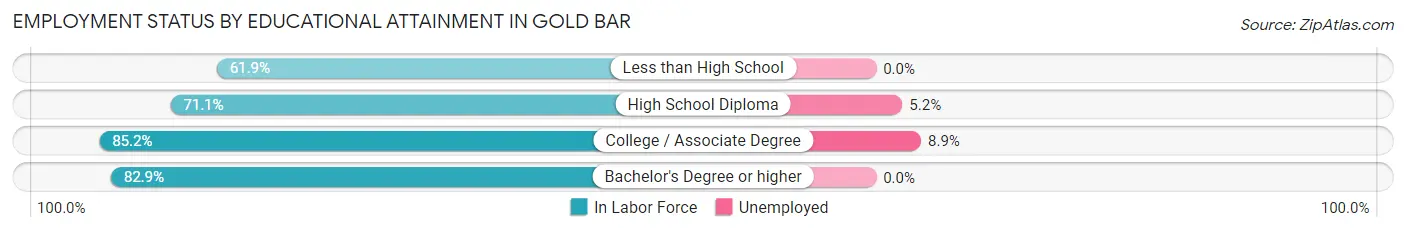
| Educational Attainment | In Labor Force | Unemployed |
| Less than High School | 70 (61.9%) | 0 (0.0%) |
| High School Diploma | 249 (71.1%) | 18 (5.2%) |
| College / Associate Degree | 586 (85.2%) | 61 (8.9%) |
| Bachelor's Degree or higher | 107 (82.9%) | 0 (0.0%) |
| Total | 1,012 (79.1%) | 82 (6.4%) |
Employment Occupations by Sex in Gold Bar
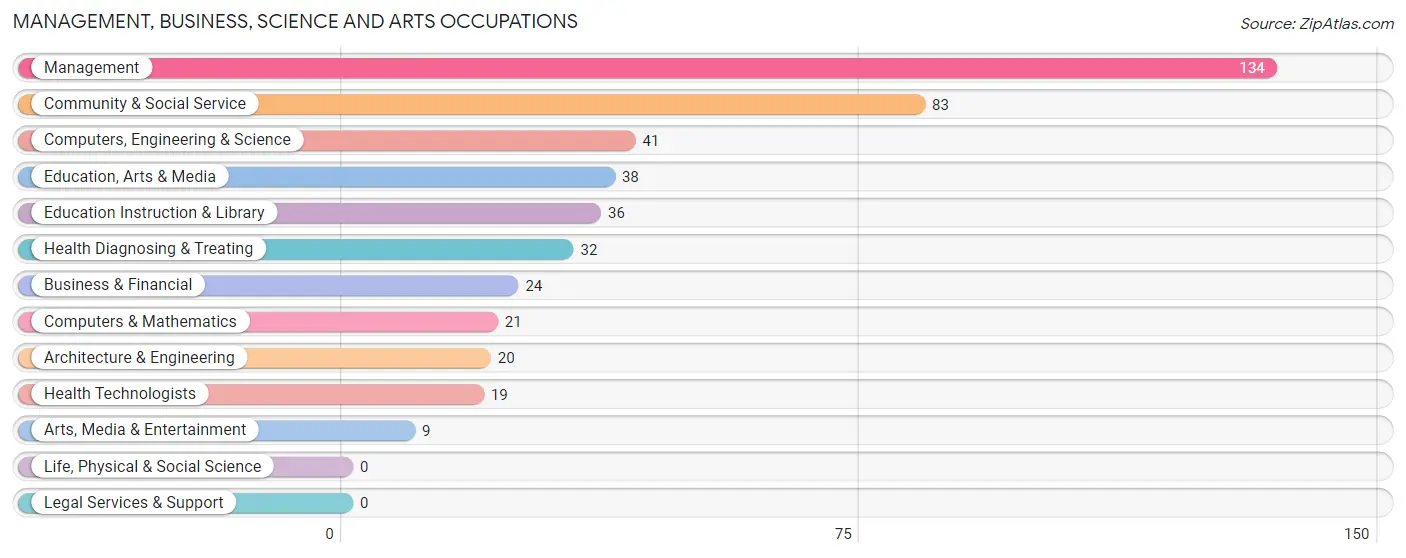
Management, Business, Science and Arts Occupations
The most common Management, Business, Science and Arts occupations in Gold Bar are Management (134 | 11.6%), Community & Social Service (83 | 7.2%), Computers, Engineering & Science (41 | 3.5%), Education, Arts & Media (38 | 3.3%), and Education Instruction & Library (36 | 3.1%).
Management, Business, Science and Arts Occupations by Sex
Within the Management, Business, Science and Arts occupations in Gold Bar, the most male-oriented occupations are Business & Financial (100.0%), Computers, Engineering & Science (100.0%), and Computers & Mathematics (100.0%), while the most female-oriented occupations are Education, Arts & Media (100.0%), Health Diagnosing & Treating (100.0%), and Health Technologists (100.0%).
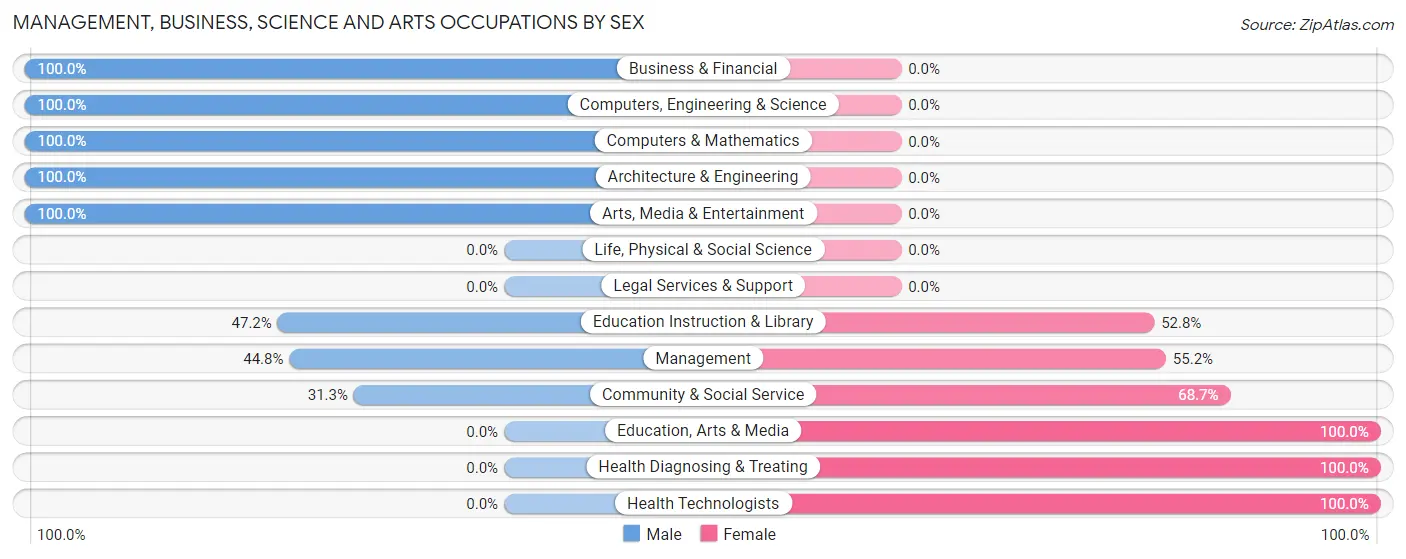
| Occupation | Male | Female |
| Management | 60 (44.8%) | 74 (55.2%) |
| Business & Financial | 24 (100.0%) | 0 (0.0%) |
| Computers, Engineering & Science | 41 (100.0%) | 0 (0.0%) |
| Computers & Mathematics | 21 (100.0%) | 0 (0.0%) |
| Architecture & Engineering | 20 (100.0%) | 0 (0.0%) |
| Life, Physical & Social Science | 0 (0.0%) | 0 (0.0%) |
| Community & Social Service | 26 (31.3%) | 57 (68.7%) |
| Education, Arts & Media | 0 (0.0%) | 38 (100.0%) |
| Legal Services & Support | 0 (0.0%) | 0 (0.0%) |
| Education Instruction & Library | 17 (47.2%) | 19 (52.8%) |
| Arts, Media & Entertainment | 9 (100.0%) | 0 (0.0%) |
| Health Diagnosing & Treating | 0 (0.0%) | 32 (100.0%) |
| Health Technologists | 0 (0.0%) | 19 (100.0%) |
| Total (Category) | 151 (48.1%) | 163 (51.9%) |
| Total (Overall) | 666 (57.6%) | 490 (42.4%) |
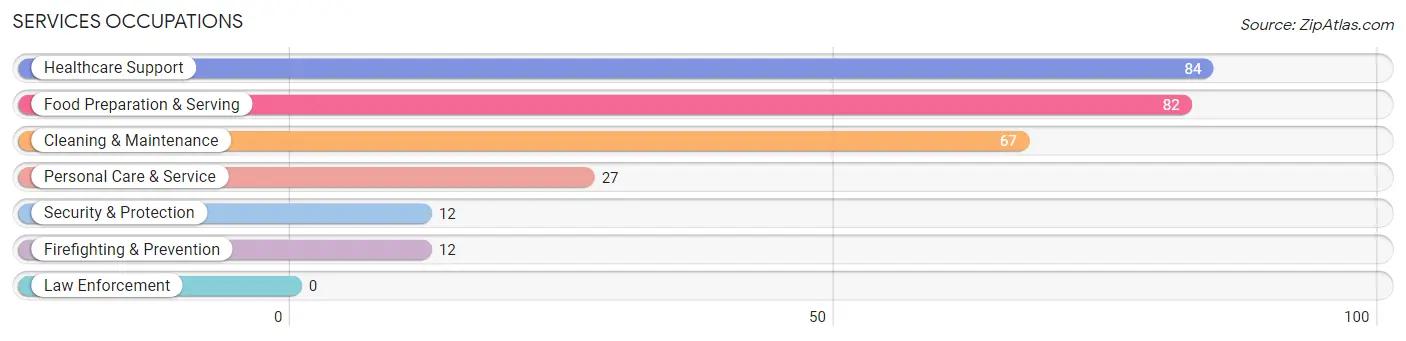
Services Occupations
The most common Services occupations in Gold Bar are Healthcare Support (84 | 7.3%), Food Preparation & Serving (82 | 7.1%), Cleaning & Maintenance (67 | 5.8%), Personal Care & Service (27 | 2.3%), and Security & Protection (12 | 1.0%).
Services Occupations by Sex
Within the Services occupations in Gold Bar, the most male-oriented occupations are Security & Protection (100.0%), Firefighting & Prevention (100.0%), and Cleaning & Maintenance (53.7%), while the most female-oriented occupations are Personal Care & Service (100.0%), Healthcare Support (86.9%), and Food Preparation & Serving (64.6%).
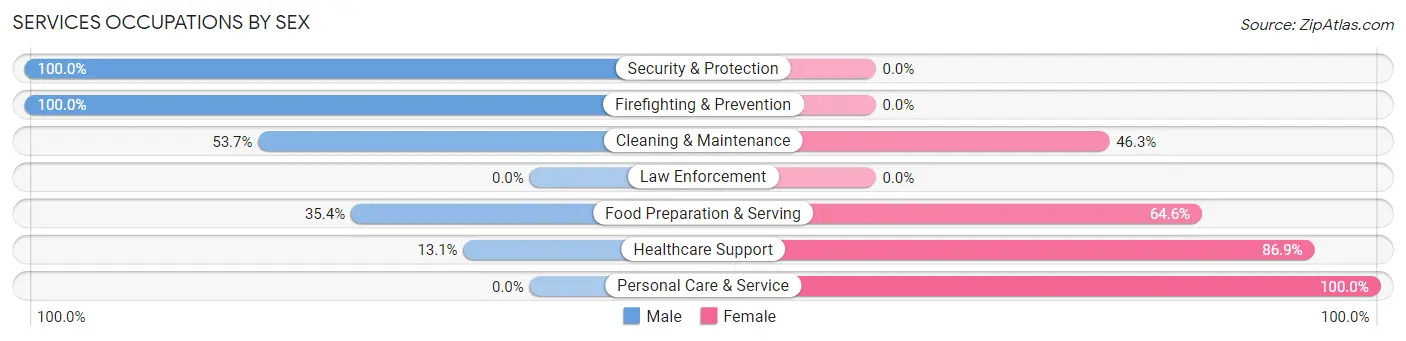
| Occupation | Male | Female |
| Healthcare Support | 11 (13.1%) | 73 (86.9%) |
| Security & Protection | 12 (100.0%) | 0 (0.0%) |
| Firefighting & Prevention | 12 (100.0%) | 0 (0.0%) |
| Law Enforcement | 0 (0.0%) | 0 (0.0%) |
| Food Preparation & Serving | 29 (35.4%) | 53 (64.6%) |
| Cleaning & Maintenance | 36 (53.7%) | 31 (46.3%) |
| Personal Care & Service | 0 (0.0%) | 27 (100.0%) |
| Total (Category) | 88 (32.4%) | 184 (67.6%) |
| Total (Overall) | 666 (57.6%) | 490 (42.4%) |
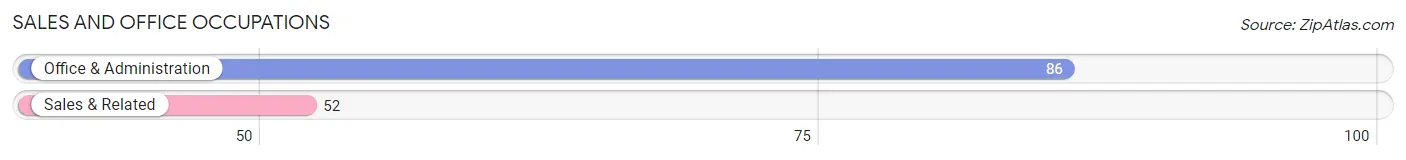
Sales and Office Occupations
The most common Sales and Office occupations in Gold Bar are Office & Administration (86 | 7.4%), and Sales & Related (52 | 4.5%).
Sales and Office Occupations by Sex
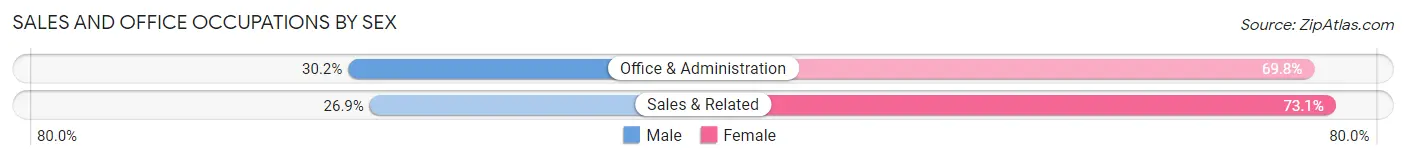
| Occupation | Male | Female |
| Sales & Related | 14 (26.9%) | 38 (73.1%) |
| Office & Administration | 26 (30.2%) | 60 (69.8%) |
| Total (Category) | 40 (29.0%) | 98 (71.0%) |
| Total (Overall) | 666 (57.6%) | 490 (42.4%) |
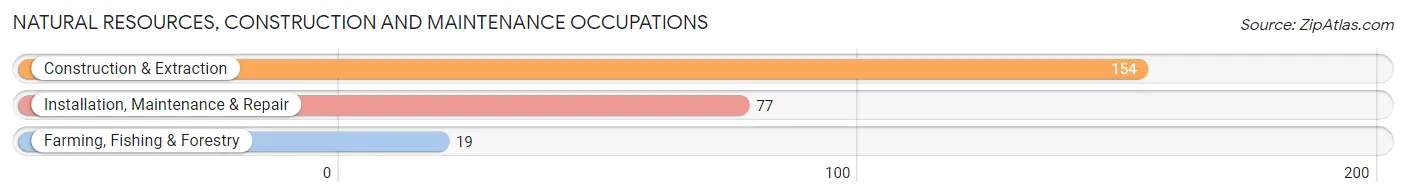
Natural Resources, Construction and Maintenance Occupations
The most common Natural Resources, Construction and Maintenance occupations in Gold Bar are Construction & Extraction (154 | 13.3%), Installation, Maintenance & Repair (77 | 6.7%), and Farming, Fishing & Forestry (19 | 1.6%).
Natural Resources, Construction and Maintenance Occupations by Sex
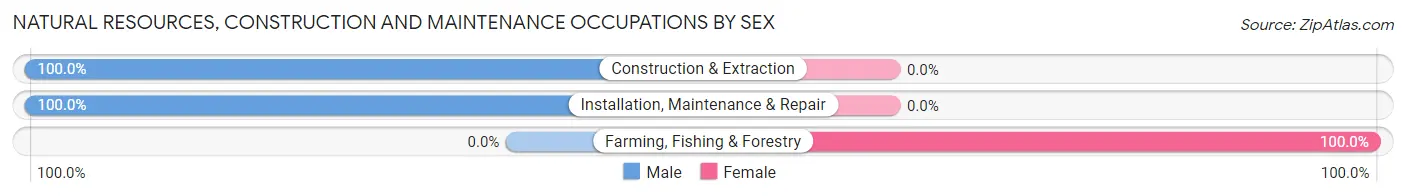
| Occupation | Male | Female |
| Farming, Fishing & Forestry | 0 (0.0%) | 19 (100.0%) |
| Construction & Extraction | 154 (100.0%) | 0 (0.0%) |
| Installation, Maintenance & Repair | 77 (100.0%) | 0 (0.0%) |
| Total (Category) | 231 (92.4%) | 19 (7.6%) |
| Total (Overall) | 666 (57.6%) | 490 (42.4%) |
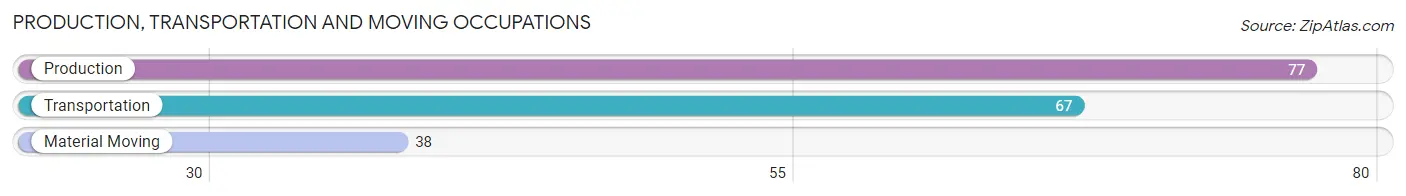
Production, Transportation and Moving Occupations
The most common Production, Transportation and Moving occupations in Gold Bar are Production (77 | 6.7%), Transportation (67 | 5.8%), and Material Moving (38 | 3.3%).
Production, Transportation and Moving Occupations by Sex
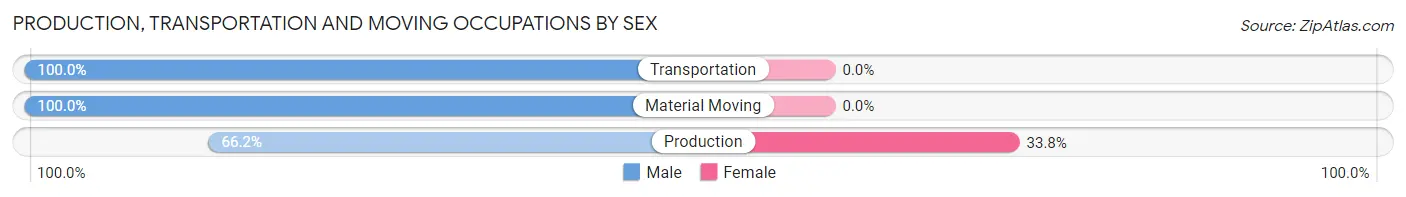
| Occupation | Male | Female |
| Production | 51 (66.2%) | 26 (33.8%) |
| Transportation | 67 (100.0%) | 0 (0.0%) |
| Material Moving | 38 (100.0%) | 0 (0.0%) |
| Total (Category) | 156 (85.7%) | 26 (14.3%) |
| Total (Overall) | 666 (57.6%) | 490 (42.4%) |
Employment Industries by Sex in Gold Bar
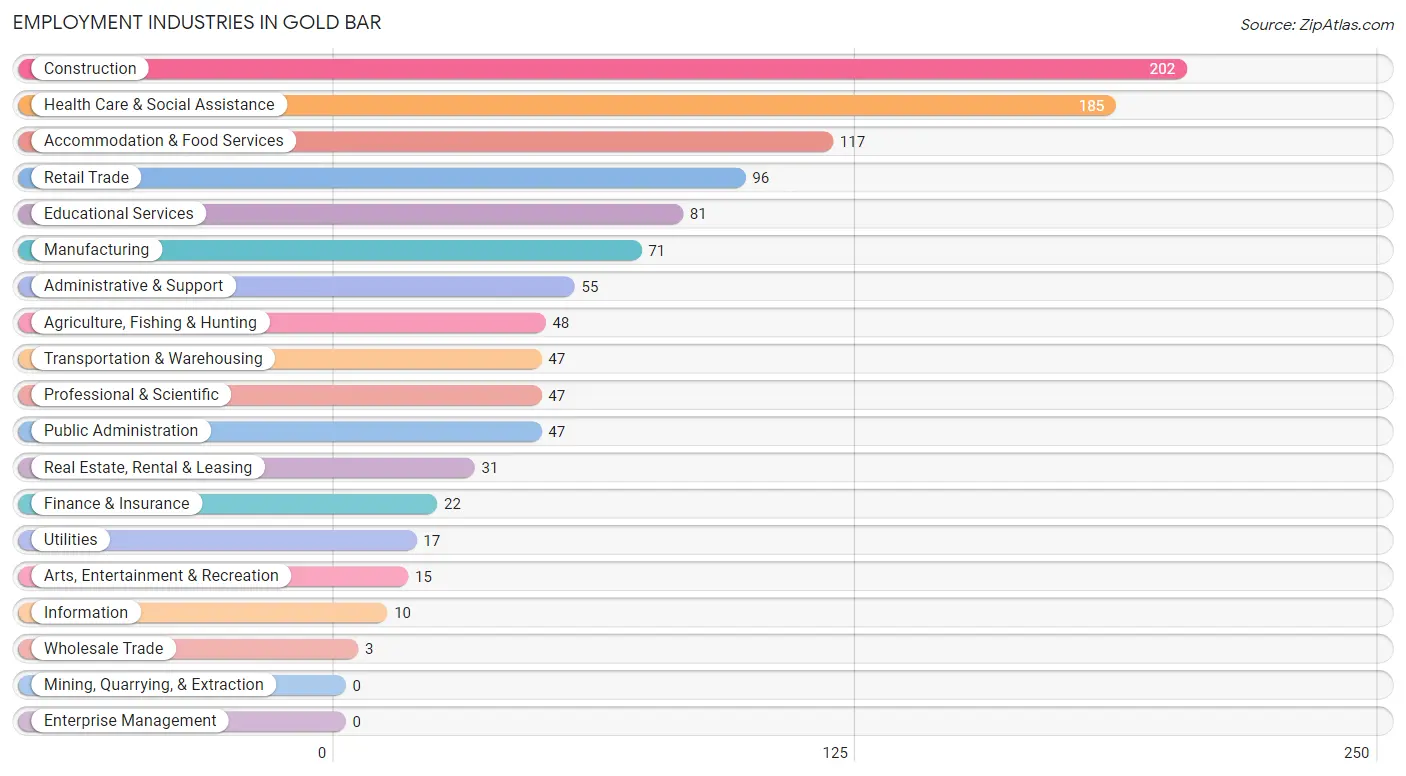
Employment Industries in Gold Bar
The major employment industries in Gold Bar include Construction (202 | 17.5%), Health Care & Social Assistance (185 | 16.0%), Accommodation & Food Services (117 | 10.1%), Retail Trade (96 | 8.3%), and Educational Services (81 | 7.0%).
Employment Industries by Sex in Gold Bar
The Gold Bar industries that see more men than women are Wholesale Trade (100.0%), Transportation & Warehousing (100.0%), and Information (100.0%), whereas the industries that tend to have a higher number of women are Health Care & Social Assistance (98.4%), Administrative & Support (65.4%), and Agriculture, Fishing & Hunting (64.6%).
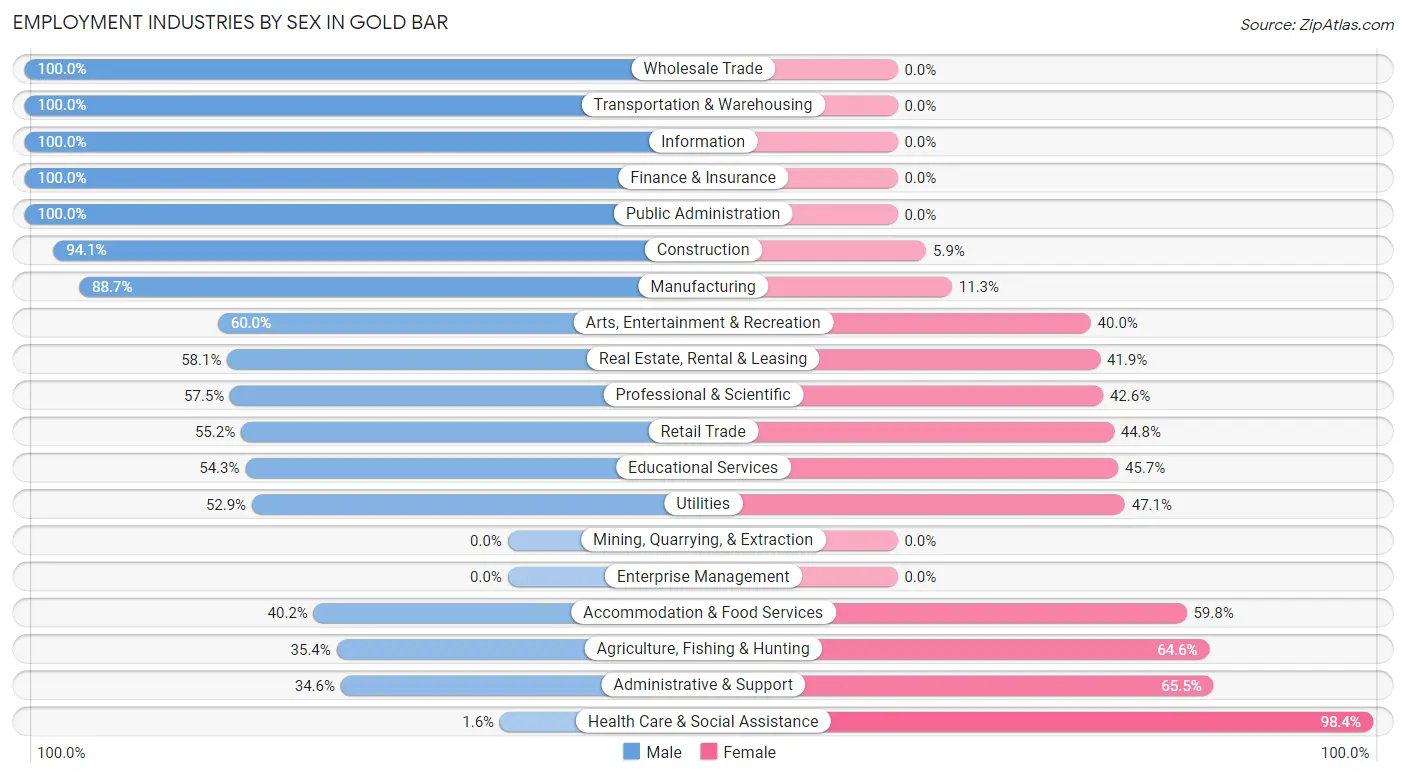
| Industry | Male | Female |
| Agriculture, Fishing & Hunting | 17 (35.4%) | 31 (64.6%) |
| Mining, Quarrying, & Extraction | 0 (0.0%) | 0 (0.0%) |
| Construction | 190 (94.1%) | 12 (5.9%) |
| Manufacturing | 63 (88.7%) | 8 (11.3%) |
| Wholesale Trade | 3 (100.0%) | 0 (0.0%) |
| Retail Trade | 53 (55.2%) | 43 (44.8%) |
| Transportation & Warehousing | 47 (100.0%) | 0 (0.0%) |
| Utilities | 9 (52.9%) | 8 (47.1%) |
| Information | 10 (100.0%) | 0 (0.0%) |
| Finance & Insurance | 22 (100.0%) | 0 (0.0%) |
| Real Estate, Rental & Leasing | 18 (58.1%) | 13 (41.9%) |
| Professional & Scientific | 27 (57.5%) | 20 (42.5%) |
| Enterprise Management | 0 (0.0%) | 0 (0.0%) |
| Administrative & Support | 19 (34.5%) | 36 (65.4%) |
| Educational Services | 44 (54.3%) | 37 (45.7%) |
| Health Care & Social Assistance | 3 (1.6%) | 182 (98.4%) |
| Arts, Entertainment & Recreation | 9 (60.0%) | 6 (40.0%) |
| Accommodation & Food Services | 47 (40.2%) | 70 (59.8%) |
| Public Administration | 47 (100.0%) | 0 (0.0%) |
| Total | 666 (57.6%) | 490 (42.4%) |
Education in Gold Bar
School Enrollment in Gold Bar
The most common levels of schooling among the 607 students in Gold Bar are college / undergraduate (146 | 24.0%), middle school (139 | 22.9%), and elementary school (138 | 22.7%).
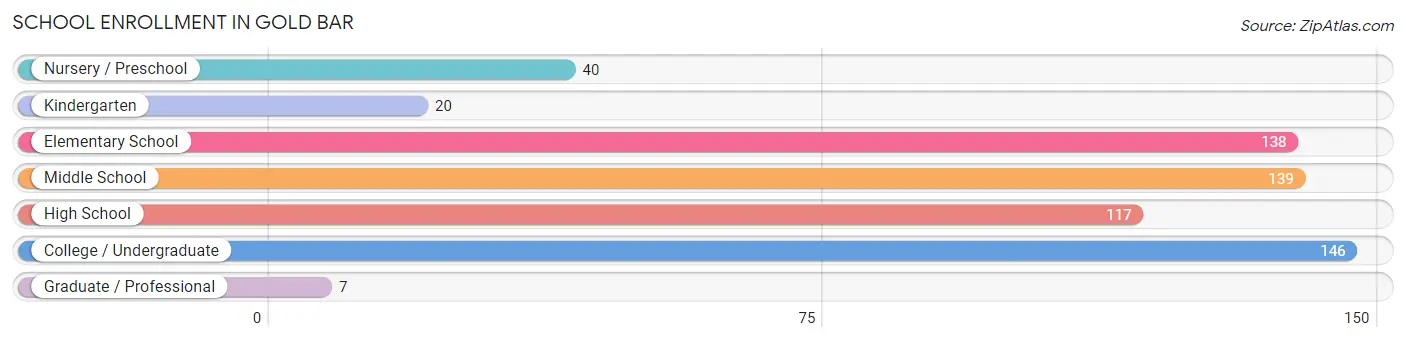
| School Level | # Students | % Students |
| Nursery / Preschool | 40 | 6.6% |
| Kindergarten | 20 | 3.3% |
| Elementary School | 138 | 22.7% |
| Middle School | 139 | 22.9% |
| High School | 117 | 19.3% |
| College / Undergraduate | 146 | 24.0% |
| Graduate / Professional | 7 | 1.1% |
| Total | 607 | 100.0% |
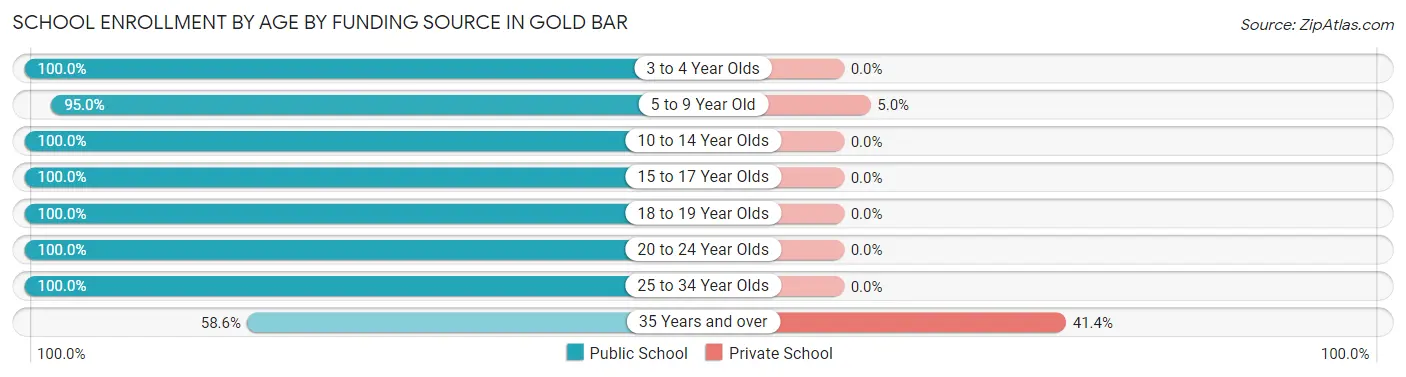
School Enrollment by Age by Funding Source in Gold Bar
Out of a total of 607 students who are enrolled in schools in Gold Bar, 32 (5.3%) attend a private institution, while the remaining 575 (94.7%) are enrolled in public schools. The age group of 35 years and over has the highest likelihood of being enrolled in private schools, with 24 (41.4% in the age bracket) enrolled. Conversely, the age group of 3 to 4 year olds has the lowest likelihood of being enrolled in a private school, with 26 (100.0% in the age bracket) attending a public institution.
| Age Bracket | Public School | Private School |
| 3 to 4 Year Olds | 26 (100.0%) | 0 (0.0%) |
| 5 to 9 Year Old | 153 (95.0%) | 8 (5.0%) |
| 10 to 14 Year Olds | 170 (100.0%) | 0 (0.0%) |
| 15 to 17 Year Olds | 79 (100.0%) | 0 (0.0%) |
| 18 to 19 Year Olds | 33 (100.0%) | 0 (0.0%) |
| 20 to 24 Year Olds | 50 (100.0%) | 0 (0.0%) |
| 25 to 34 Year Olds | 30 (100.0%) | 0 (0.0%) |
| 35 Years and over | 34 (58.6%) | 24 (41.4%) |
| Total | 575 (94.7%) | 32 (5.3%) |
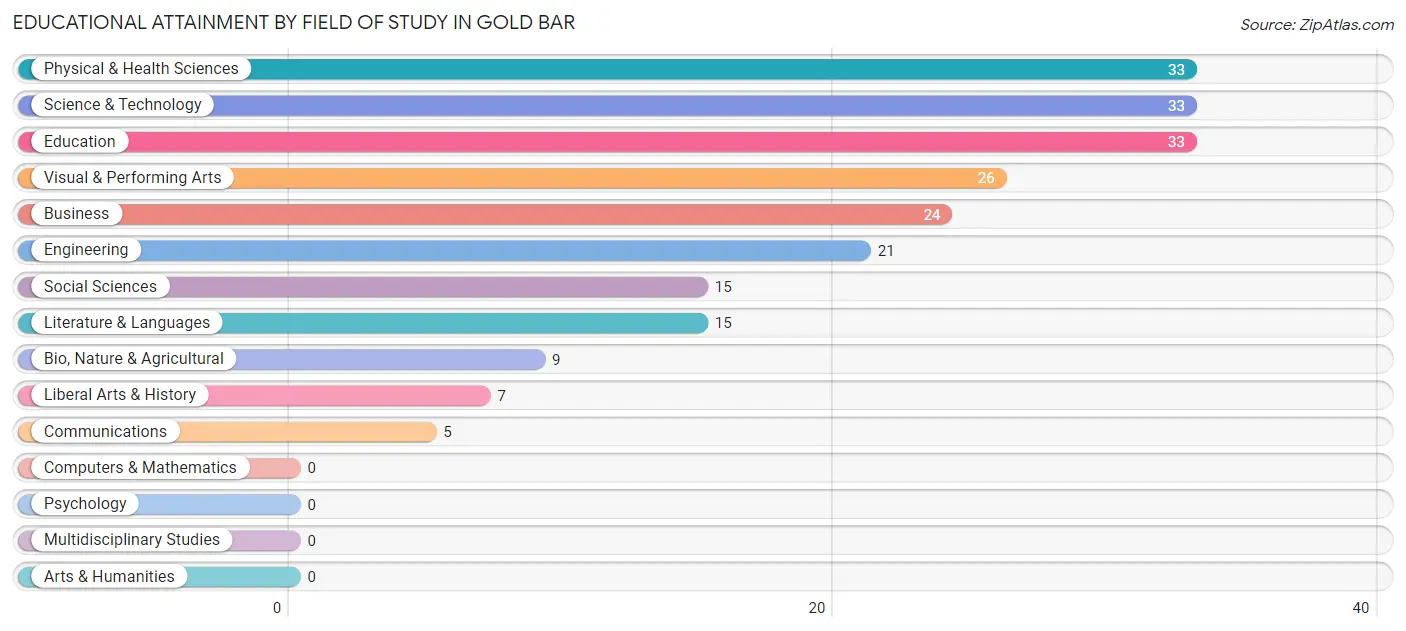
Educational Attainment by Field of Study in Gold Bar
Physical & health sciences (33 | 14.9%), science & technology (33 | 14.9%), education (33 | 14.9%), visual & performing arts (26 | 11.8%), and business (24 | 10.9%) are the most common fields of study among 221 individuals in Gold Bar who have obtained a bachelor's degree or higher.
| Field of Study | # Graduates | % Graduates |
| Computers & Mathematics | 0 | 0.0% |
| Bio, Nature & Agricultural | 9 | 4.1% |
| Physical & Health Sciences | 33 | 14.9% |
| Psychology | 0 | 0.0% |
| Social Sciences | 15 | 6.8% |
| Engineering | 21 | 9.5% |
| Multidisciplinary Studies | 0 | 0.0% |
| Science & Technology | 33 | 14.9% |
| Business | 24 | 10.9% |
| Education | 33 | 14.9% |
| Literature & Languages | 15 | 6.8% |
| Liberal Arts & History | 7 | 3.2% |
| Visual & Performing Arts | 26 | 11.8% |
| Communications | 5 | 2.3% |
| Arts & Humanities | 0 | 0.0% |
| Total | 221 | 100.0% |
Transportation & Commute in Gold Bar
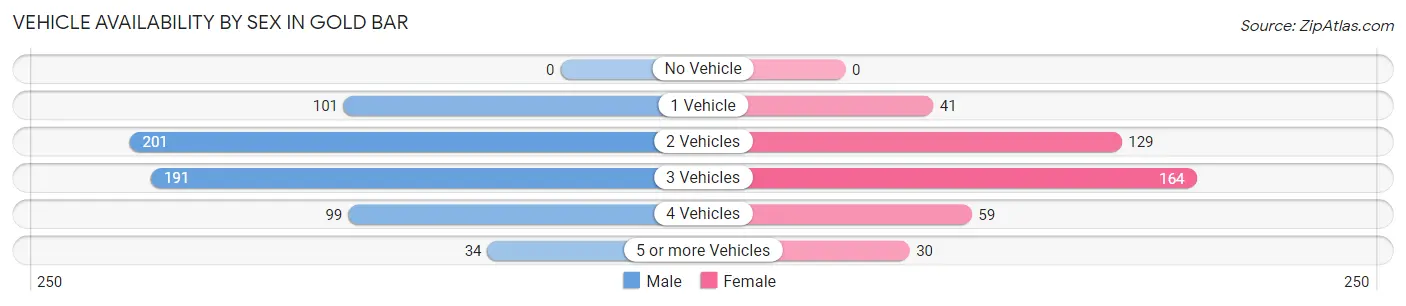
Vehicle Availability by Sex in Gold Bar
The most prevalent vehicle ownership categories in Gold Bar are males with 2 vehicles (201, accounting for 32.1%) and females with 2 vehicles (129, making up 47.5%).
| Vehicles Available | Male | Female |
| No Vehicle | 0 (0.0%) | 0 (0.0%) |
| 1 Vehicle | 101 (16.1%) | 41 (9.7%) |
| 2 Vehicles | 201 (32.1%) | 129 (30.5%) |
| 3 Vehicles | 191 (30.5%) | 164 (38.8%) |
| 4 Vehicles | 99 (15.8%) | 59 (14.0%) |
| 5 or more Vehicles | 34 (5.4%) | 30 (7.1%) |
| Total | 626 (100.0%) | 423 (100.0%) |
Commute Time in Gold Bar
The most frequently occuring commute durations in Gold Bar are 60 to 89 minutes (204 commuters, 22.1%), 45 to 59 minutes (197 commuters, 21.3%), and 30 to 34 minutes (75 commuters, 8.1%).
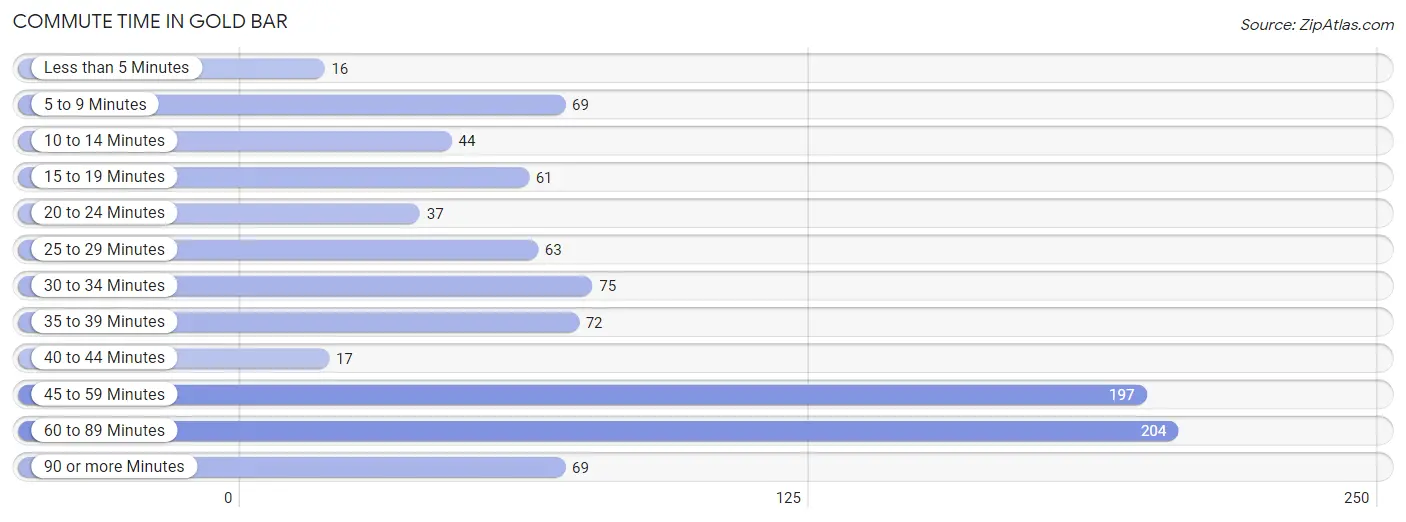
| Commute Time | # Commuters | % Commuters |
| Less than 5 Minutes | 16 | 1.7% |
| 5 to 9 Minutes | 69 | 7.5% |
| 10 to 14 Minutes | 44 | 4.8% |
| 15 to 19 Minutes | 61 | 6.6% |
| 20 to 24 Minutes | 37 | 4.0% |
| 25 to 29 Minutes | 63 | 6.8% |
| 30 to 34 Minutes | 75 | 8.1% |
| 35 to 39 Minutes | 72 | 7.8% |
| 40 to 44 Minutes | 17 | 1.8% |
| 45 to 59 Minutes | 197 | 21.3% |
| 60 to 89 Minutes | 204 | 22.1% |
| 90 or more Minutes | 69 | 7.5% |
Commute Time by Sex in Gold Bar
The most common commute times in Gold Bar are 60 to 89 minutes (164 commuters, 28.6%) for males and 30 to 34 minutes (67 commuters, 19.1%) for females.
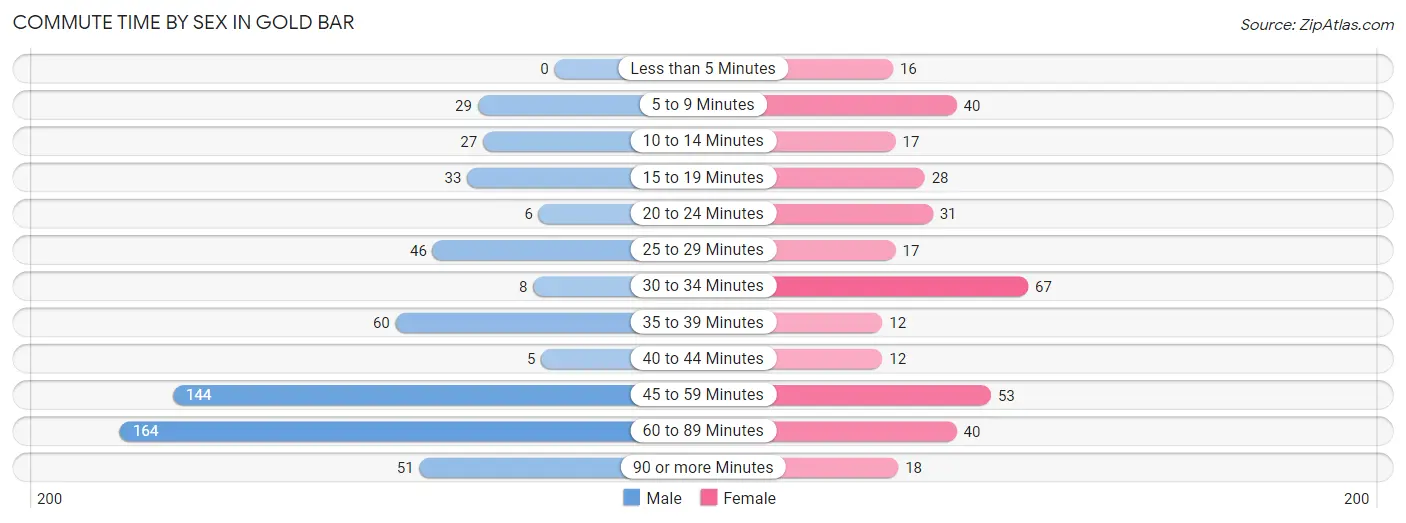
| Commute Time | Male | Female |
| Less than 5 Minutes | 0 (0.0%) | 16 (4.6%) |
| 5 to 9 Minutes | 29 (5.1%) | 40 (11.4%) |
| 10 to 14 Minutes | 27 (4.7%) | 17 (4.8%) |
| 15 to 19 Minutes | 33 (5.8%) | 28 (8.0%) |
| 20 to 24 Minutes | 6 (1.1%) | 31 (8.8%) |
| 25 to 29 Minutes | 46 (8.0%) | 17 (4.8%) |
| 30 to 34 Minutes | 8 (1.4%) | 67 (19.1%) |
| 35 to 39 Minutes | 60 (10.5%) | 12 (3.4%) |
| 40 to 44 Minutes | 5 (0.9%) | 12 (3.4%) |
| 45 to 59 Minutes | 144 (25.1%) | 53 (15.1%) |
| 60 to 89 Minutes | 164 (28.6%) | 40 (11.4%) |
| 90 or more Minutes | 51 (8.9%) | 18 (5.1%) |
Time of Departure to Work by Sex in Gold Bar
The most frequent times of departure to work in Gold Bar are 12:00 AM to 4:59 AM (142, 24.8%) for males and 7:30 AM to 7:59 AM (62, 17.7%) for females.
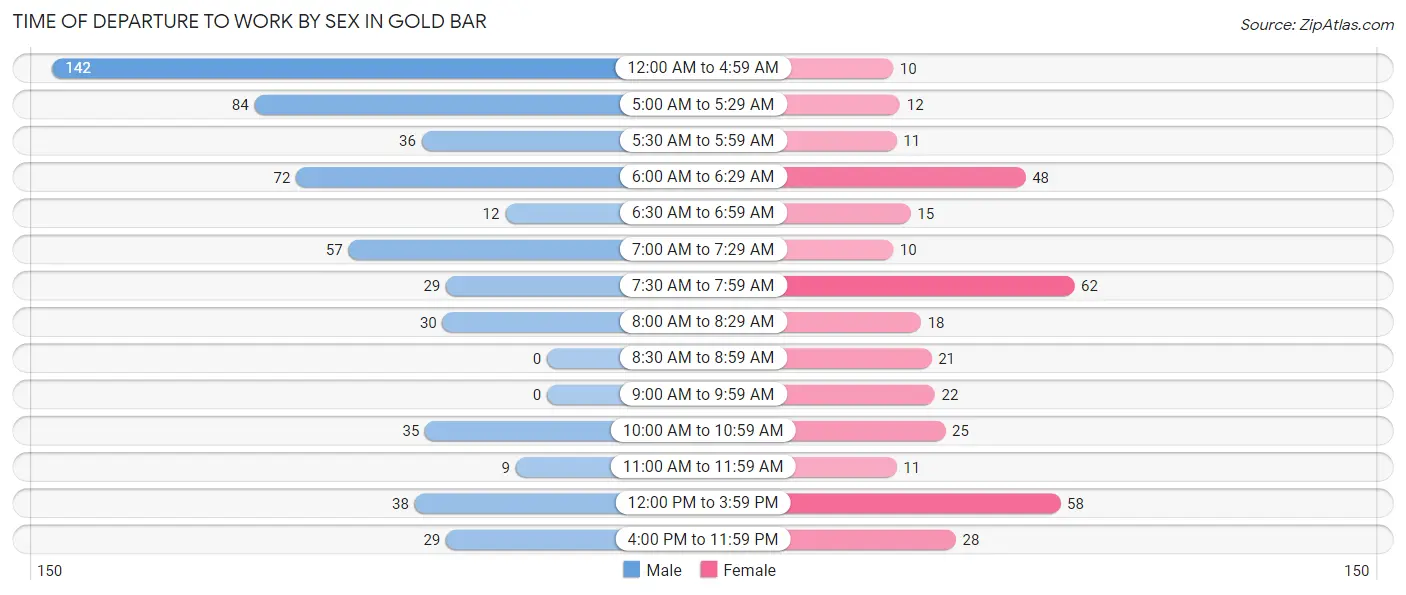
| Time of Departure | Male | Female |
| 12:00 AM to 4:59 AM | 142 (24.8%) | 10 (2.9%) |
| 5:00 AM to 5:29 AM | 84 (14.7%) | 12 (3.4%) |
| 5:30 AM to 5:59 AM | 36 (6.3%) | 11 (3.1%) |
| 6:00 AM to 6:29 AM | 72 (12.6%) | 48 (13.7%) |
| 6:30 AM to 6:59 AM | 12 (2.1%) | 15 (4.3%) |
| 7:00 AM to 7:29 AM | 57 (10.0%) | 10 (2.9%) |
| 7:30 AM to 7:59 AM | 29 (5.1%) | 62 (17.7%) |
| 8:00 AM to 8:29 AM | 30 (5.2%) | 18 (5.1%) |
| 8:30 AM to 8:59 AM | 0 (0.0%) | 21 (6.0%) |
| 9:00 AM to 9:59 AM | 0 (0.0%) | 22 (6.3%) |
| 10:00 AM to 10:59 AM | 35 (6.1%) | 25 (7.1%) |
| 11:00 AM to 11:59 AM | 9 (1.6%) | 11 (3.1%) |
| 12:00 PM to 3:59 PM | 38 (6.6%) | 58 (16.5%) |
| 4:00 PM to 11:59 PM | 29 (5.1%) | 28 (8.0%) |
| Total | 573 (100.0%) | 351 (100.0%) |
Housing Occupancy in Gold Bar
Occupancy by Ownership in Gold Bar
Of the total 828 dwellings in Gold Bar, owner-occupied units account for 672 (81.2%), while renter-occupied units make up 156 (18.8%).
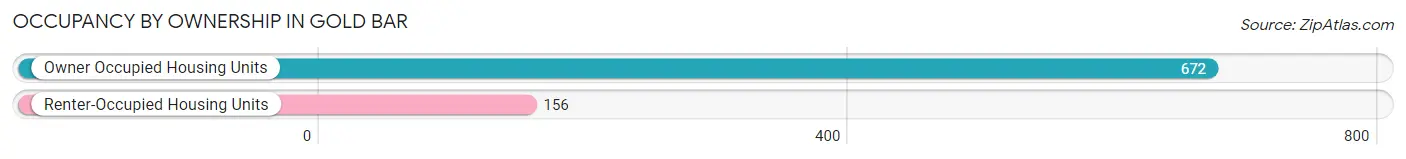
| Occupancy | # Housing Units | % Housing Units |
| Owner Occupied Housing Units | 672 | 81.2% |
| Renter-Occupied Housing Units | 156 | 18.8% |
| Total Occupied Housing Units | 828 | 100.0% |
Occupancy by Household Size in Gold Bar
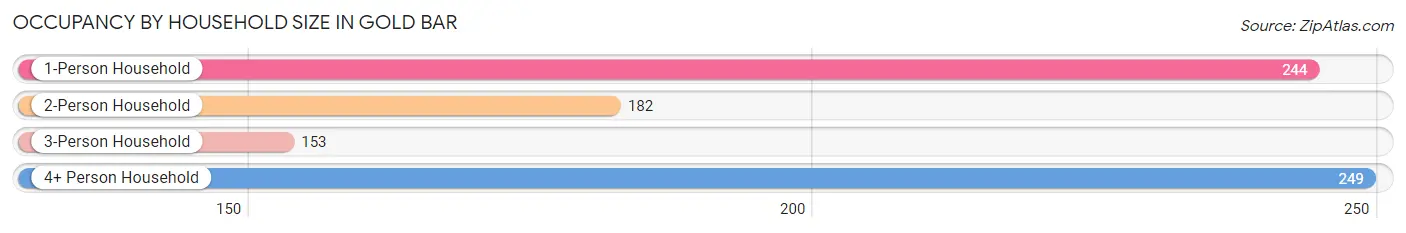
| Household Size | # Housing Units | % Housing Units |
| 1-Person Household | 244 | 29.5% |
| 2-Person Household | 182 | 22.0% |
| 3-Person Household | 153 | 18.5% |
| 4+ Person Household | 249 | 30.1% |
| Total Housing Units | 828 | 100.0% |
Occupancy by Ownership by Household Size in Gold Bar
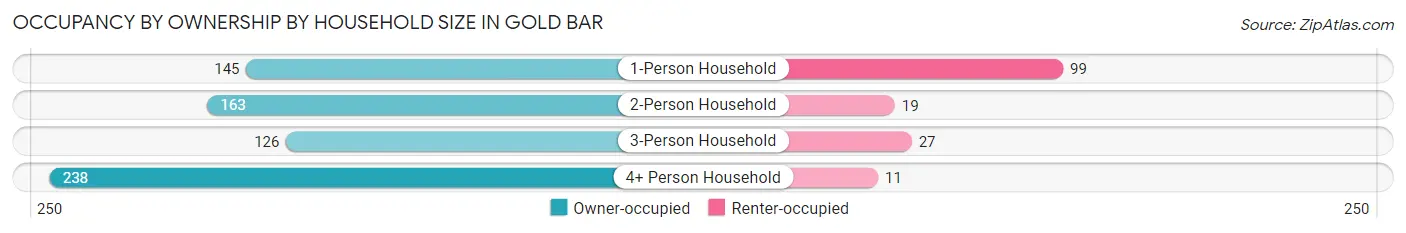
| Household Size | Owner-occupied | Renter-occupied |
| 1-Person Household | 145 (59.4%) | 99 (40.6%) |
| 2-Person Household | 163 (89.6%) | 19 (10.4%) |
| 3-Person Household | 126 (82.4%) | 27 (17.6%) |
| 4+ Person Household | 238 (95.6%) | 11 (4.4%) |
| Total Housing Units | 672 (81.2%) | 156 (18.8%) |
Occupancy by Educational Attainment in Gold Bar
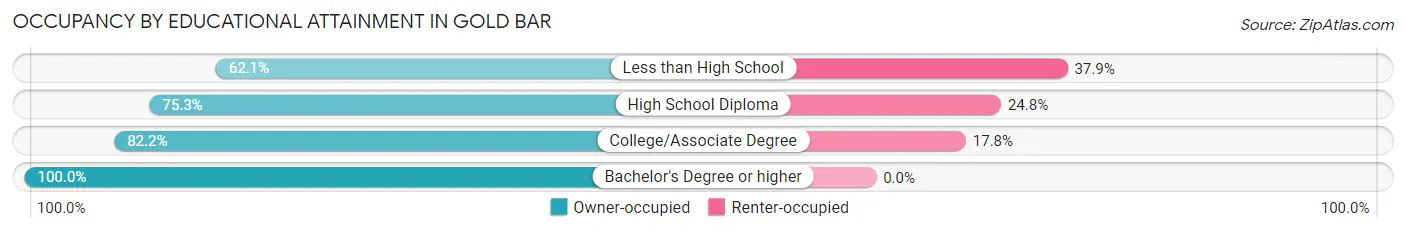
| Household Size | Owner-occupied | Renter-occupied |
| Less than High School | 18 (62.1%) | 11 (37.9%) |
| High School Diploma | 222 (75.2%) | 73 (24.7%) |
| College/Associate Degree | 333 (82.2%) | 72 (17.8%) |
| Bachelor's Degree or higher | 99 (100.0%) | 0 (0.0%) |
Occupancy by Age of Householder in Gold Bar
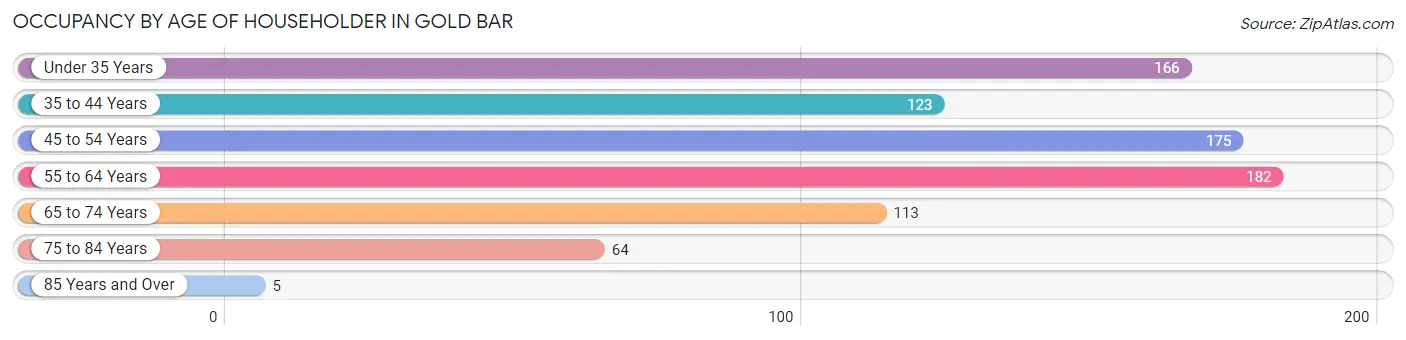
| Age Bracket | # Households | % Households |
| Under 35 Years | 166 | 20.1% |
| 35 to 44 Years | 123 | 14.9% |
| 45 to 54 Years | 175 | 21.1% |
| 55 to 64 Years | 182 | 22.0% |
| 65 to 74 Years | 113 | 13.7% |
| 75 to 84 Years | 64 | 7.7% |
| 85 Years and Over | 5 | 0.6% |
| Total | 828 | 100.0% |
Housing Finances in Gold Bar
Median Income by Occupancy in Gold Bar
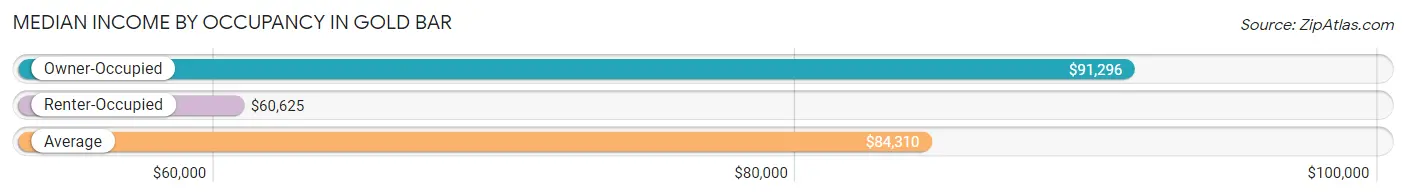
| Occupancy Type | # Households | Median Income |
| Owner-Occupied | 672 (81.2%) | $91,296 |
| Renter-Occupied | 156 (18.8%) | $60,625 |
| Average | 828 (100.0%) | $84,310 |
Occupancy by Householder Income Bracket in Gold Bar
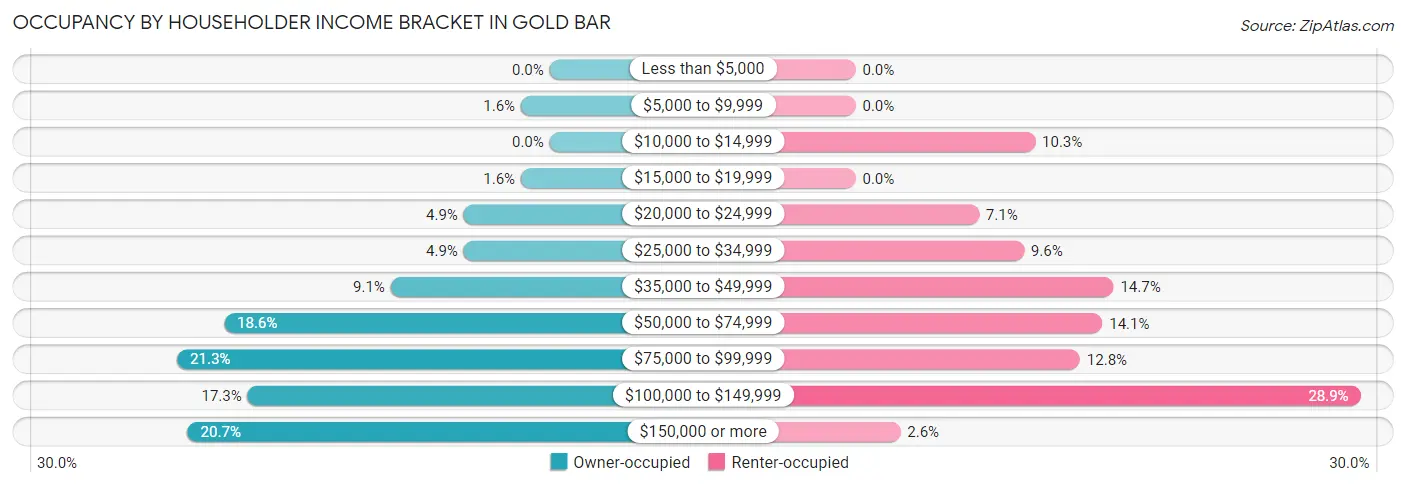
| Income Bracket | Owner-occupied | Renter-occupied |
| Less than $5,000 | 0 (0.0%) | 0 (0.0%) |
| $5,000 to $9,999 | 11 (1.6%) | 0 (0.0%) |
| $10,000 to $14,999 | 0 (0.0%) | 16 (10.3%) |
| $15,000 to $19,999 | 11 (1.6%) | 0 (0.0%) |
| $20,000 to $24,999 | 33 (4.9%) | 11 (7.0%) |
| $25,000 to $34,999 | 33 (4.9%) | 15 (9.6%) |
| $35,000 to $49,999 | 61 (9.1%) | 23 (14.7%) |
| $50,000 to $74,999 | 125 (18.6%) | 22 (14.1%) |
| $75,000 to $99,999 | 143 (21.3%) | 20 (12.8%) |
| $100,000 to $149,999 | 116 (17.3%) | 45 (28.8%) |
| $150,000 or more | 139 (20.7%) | 4 (2.6%) |
| Total | 672 (100.0%) | 156 (100.0%) |
Monthly Housing Cost Tiers in Gold Bar
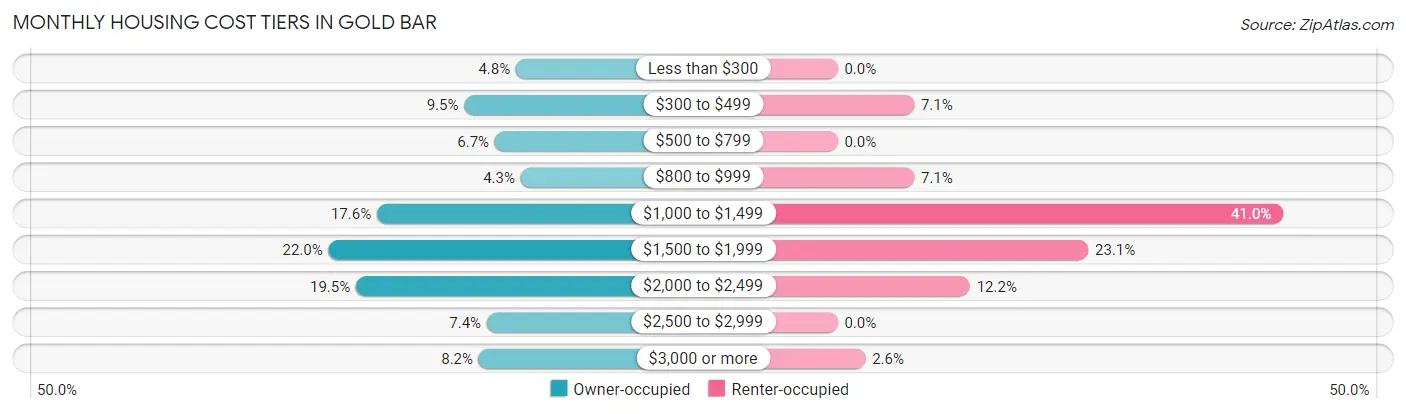
| Monthly Cost | Owner-occupied | Renter-occupied |
| Less than $300 | 32 (4.8%) | 0 (0.0%) |
| $300 to $499 | 64 (9.5%) | 11 (7.0%) |
| $500 to $799 | 45 (6.7%) | 0 (0.0%) |
| $800 to $999 | 29 (4.3%) | 11 (7.0%) |
| $1,000 to $1,499 | 118 (17.6%) | 64 (41.0%) |
| $1,500 to $1,999 | 148 (22.0%) | 36 (23.1%) |
| $2,000 to $2,499 | 131 (19.5%) | 19 (12.2%) |
| $2,500 to $2,999 | 50 (7.4%) | 0 (0.0%) |
| $3,000 or more | 55 (8.2%) | 4 (2.6%) |
| Total | 672 (100.0%) | 156 (100.0%) |
Physical Housing Characteristics in Gold Bar
Housing Structures in Gold Bar
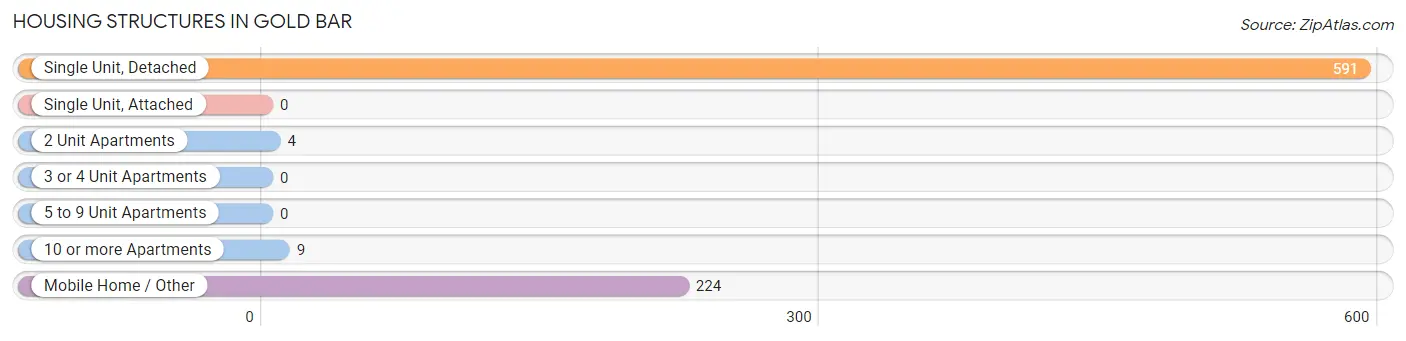
| Structure Type | # Housing Units | % Housing Units |
| Single Unit, Detached | 591 | 71.4% |
| Single Unit, Attached | 0 | 0.0% |
| 2 Unit Apartments | 4 | 0.5% |
| 3 or 4 Unit Apartments | 0 | 0.0% |
| 5 to 9 Unit Apartments | 0 | 0.0% |
| 10 or more Apartments | 9 | 1.1% |
| Mobile Home / Other | 224 | 27.1% |
| Total | 828 | 100.0% |
Housing Structures by Occupancy in Gold Bar
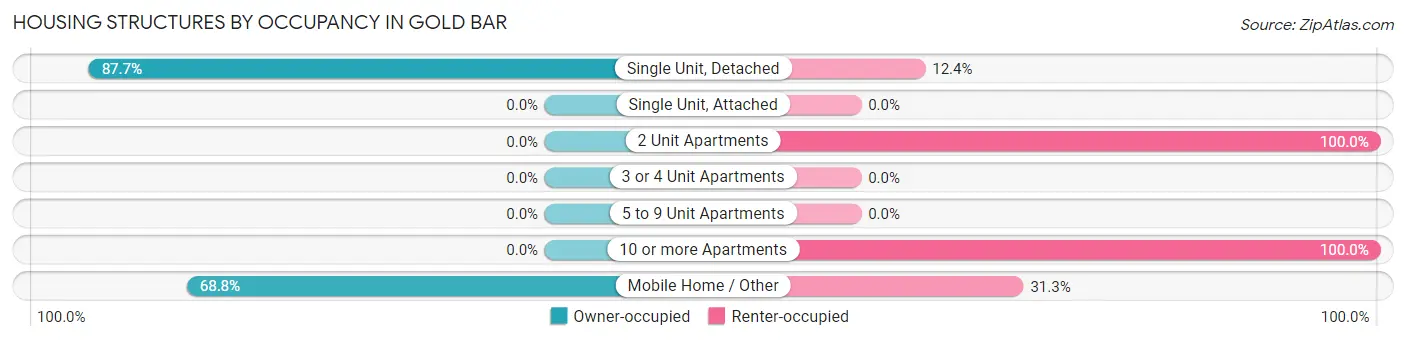
| Structure Type | Owner-occupied | Renter-occupied |
| Single Unit, Detached | 518 (87.6%) | 73 (12.3%) |
| Single Unit, Attached | 0 (0.0%) | 0 (0.0%) |
| 2 Unit Apartments | 0 (0.0%) | 4 (100.0%) |
| 3 or 4 Unit Apartments | 0 (0.0%) | 0 (0.0%) |
| 5 to 9 Unit Apartments | 0 (0.0%) | 0 (0.0%) |
| 10 or more Apartments | 0 (0.0%) | 9 (100.0%) |
| Mobile Home / Other | 154 (68.8%) | 70 (31.2%) |
| Total | 672 (81.2%) | 156 (18.8%) |
Housing Structures by Number of Rooms in Gold Bar
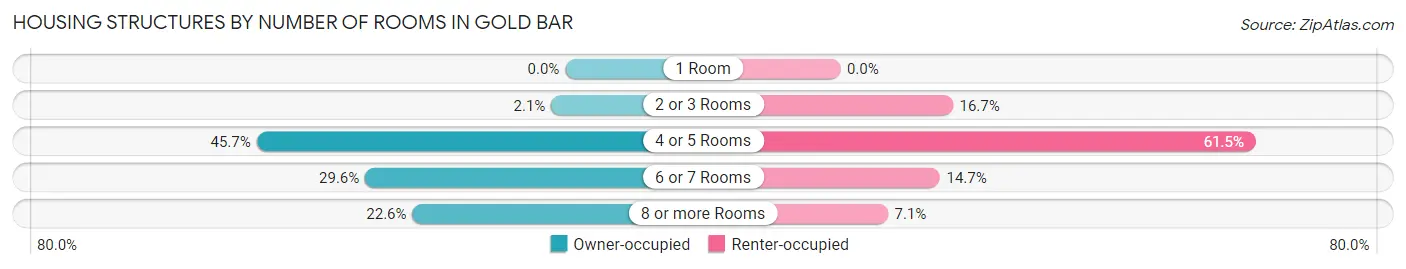
| Number of Rooms | Owner-occupied | Renter-occupied |
| 1 Room | 0 (0.0%) | 0 (0.0%) |
| 2 or 3 Rooms | 14 (2.1%) | 26 (16.7%) |
| 4 or 5 Rooms | 307 (45.7%) | 96 (61.5%) |
| 6 or 7 Rooms | 199 (29.6%) | 23 (14.7%) |
| 8 or more Rooms | 152 (22.6%) | 11 (7.0%) |
| Total | 672 (100.0%) | 156 (100.0%) |
Housing Structure by Heating Type in Gold Bar
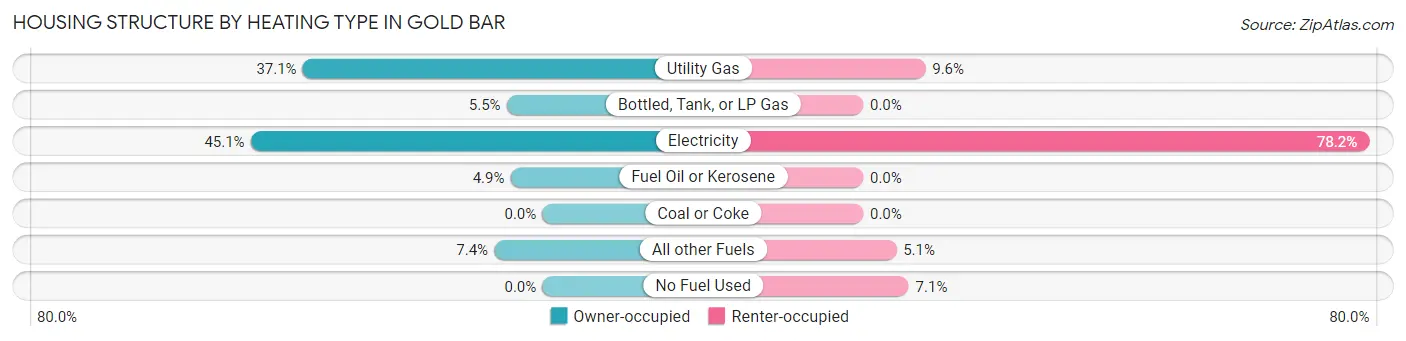
| Heating Type | Owner-occupied | Renter-occupied |
| Utility Gas | 249 (37.0%) | 15 (9.6%) |
| Bottled, Tank, or LP Gas | 37 (5.5%) | 0 (0.0%) |
| Electricity | 303 (45.1%) | 122 (78.2%) |
| Fuel Oil or Kerosene | 33 (4.9%) | 0 (0.0%) |
| Coal or Coke | 0 (0.0%) | 0 (0.0%) |
| All other Fuels | 50 (7.4%) | 8 (5.1%) |
| No Fuel Used | 0 (0.0%) | 11 (7.0%) |
| Total | 672 (100.0%) | 156 (100.0%) |
Household Vehicle Usage in Gold Bar
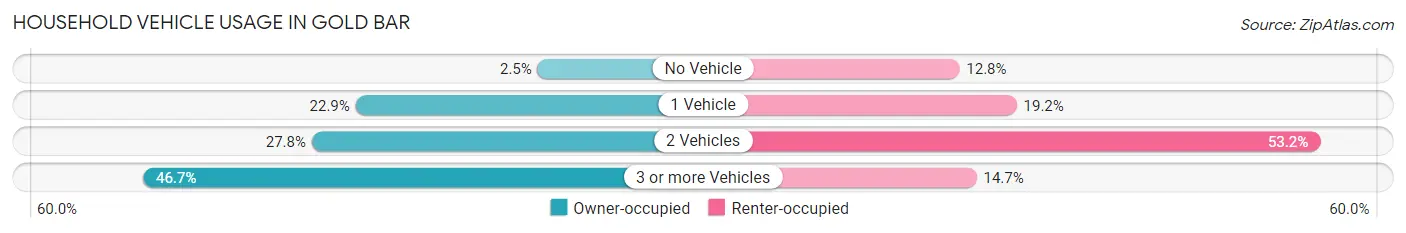
| Vehicles per Household | Owner-occupied | Renter-occupied |
| No Vehicle | 17 (2.5%) | 20 (12.8%) |
| 1 Vehicle | 154 (22.9%) | 30 (19.2%) |
| 2 Vehicles | 187 (27.8%) | 83 (53.2%) |
| 3 or more Vehicles | 314 (46.7%) | 23 (14.7%) |
| Total | 672 (100.0%) | 156 (100.0%) |
Real Estate & Mortgages in Gold Bar
Real Estate and Mortgage Overview in Gold Bar
| Characteristic | Without Mortgage | With Mortgage |
| Housing Units | 189 | 483 |
| Median Property Value | $246,100 | $434,500 |
| Median Household Income | $43,086 | $101 |
| Monthly Housing Costs | $488 | $55 |
| Real Estate Taxes | $1,475 | $7 |
Property Value by Mortgage Status in Gold Bar
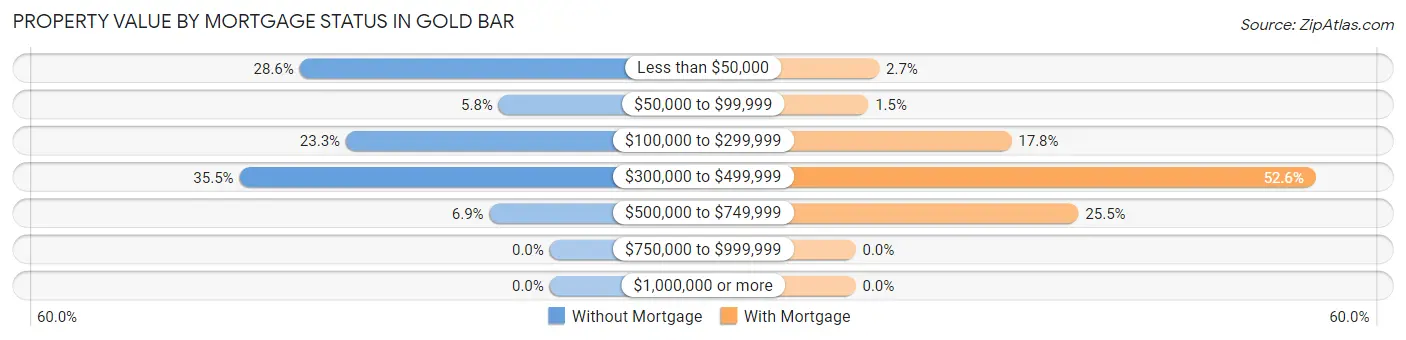
| Property Value | Without Mortgage | With Mortgage |
| Less than $50,000 | 54 (28.6%) | 13 (2.7%) |
| $50,000 to $99,999 | 11 (5.8%) | 7 (1.5%) |
| $100,000 to $299,999 | 44 (23.3%) | 86 (17.8%) |
| $300,000 to $499,999 | 67 (35.4%) | 254 (52.6%) |
| $500,000 to $749,999 | 13 (6.9%) | 123 (25.5%) |
| $750,000 to $999,999 | 0 (0.0%) | 0 (0.0%) |
| $1,000,000 or more | 0 (0.0%) | 0 (0.0%) |
| Total | 189 (100.0%) | 483 (100.0%) |
Household Income by Mortgage Status in Gold Bar
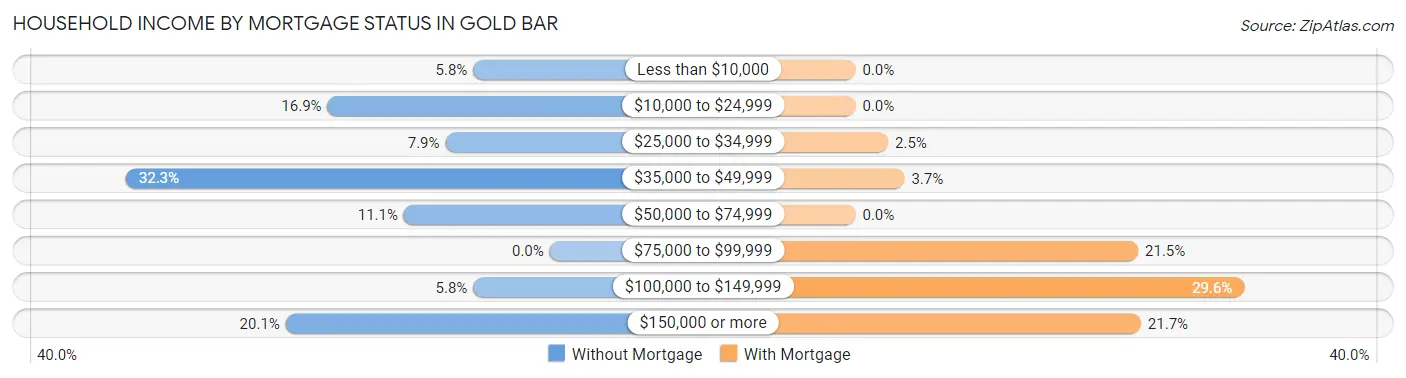
| Household Income | Without Mortgage | With Mortgage |
| Less than $10,000 | 11 (5.8%) | 0 (0.0%) |
| $10,000 to $24,999 | 32 (16.9%) | 0 (0.0%) |
| $25,000 to $34,999 | 15 (7.9%) | 12 (2.5%) |
| $35,000 to $49,999 | 61 (32.3%) | 18 (3.7%) |
| $50,000 to $74,999 | 21 (11.1%) | 0 (0.0%) |
| $75,000 to $99,999 | 0 (0.0%) | 104 (21.5%) |
| $100,000 to $149,999 | 11 (5.8%) | 143 (29.6%) |
| $150,000 or more | 38 (20.1%) | 105 (21.7%) |
| Total | 189 (100.0%) | 483 (100.0%) |
Property Value to Household Income Ratio in Gold Bar
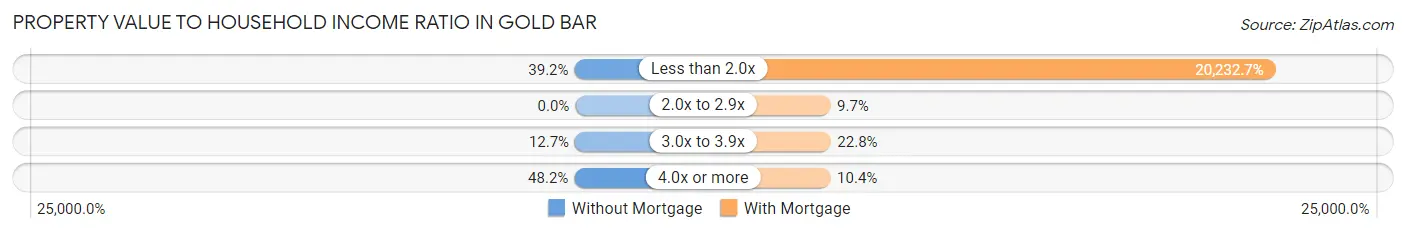
| Value-to-Income Ratio | Without Mortgage | With Mortgage |
| Less than 2.0x | 74 (39.2%) | 97,724 (20,232.7%) |
| 2.0x to 2.9x | 0 (0.0%) | 47 (9.7%) |
| 3.0x to 3.9x | 24 (12.7%) | 110 (22.8%) |
| 4.0x or more | 91 (48.1%) | 50 (10.3%) |
| Total | 189 (100.0%) | 483 (100.0%) |
Real Estate Taxes by Mortgage Status in Gold Bar
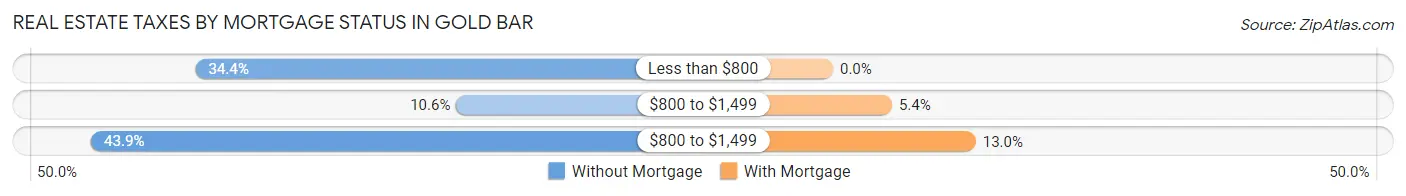
| Property Taxes | Without Mortgage | With Mortgage |
| Less than $800 | 65 (34.4%) | 0 (0.0%) |
| $800 to $1,499 | 20 (10.6%) | 26 (5.4%) |
| $800 to $1,499 | 83 (43.9%) | 63 (13.0%) |
| Total | 189 (100.0%) | 483 (100.0%) |
Health & Disability in Gold Bar
Health Insurance Coverage by Age in Gold Bar
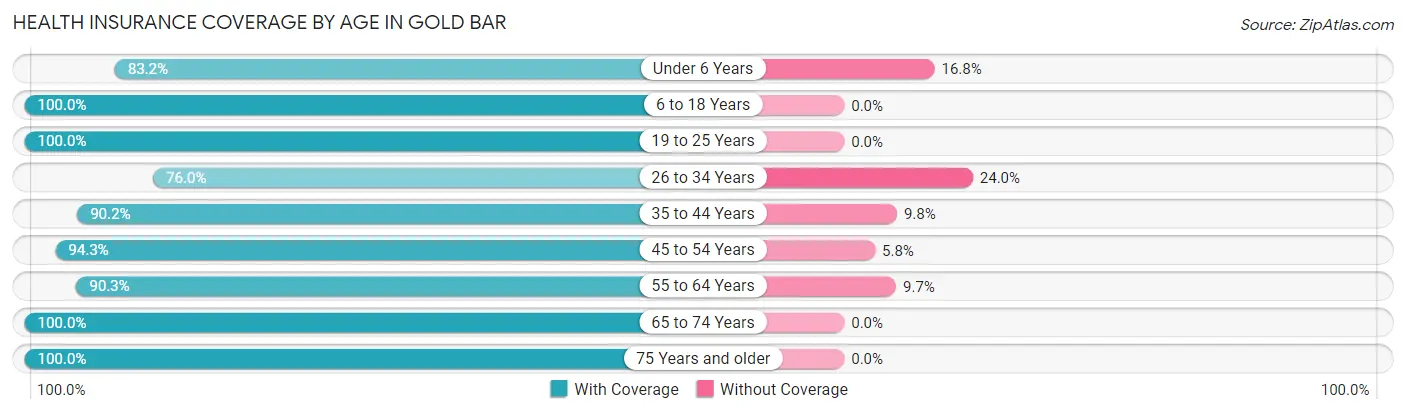
| Age Bracket | With Coverage | Without Coverage |
| Under 6 Years | 173 (83.2%) | 35 (16.8%) |
| 6 to 18 Years | 422 (100.0%) | 0 (0.0%) |
| 19 to 25 Years | 211 (100.0%) | 0 (0.0%) |
| 26 to 34 Years | 241 (76.0%) | 76 (24.0%) |
| 35 to 44 Years | 257 (90.2%) | 28 (9.8%) |
| 45 to 54 Years | 344 (94.3%) | 21 (5.8%) |
| 55 to 64 Years | 262 (90.3%) | 28 (9.7%) |
| 65 to 74 Years | 164 (100.0%) | 0 (0.0%) |
| 75 Years and older | 76 (100.0%) | 0 (0.0%) |
| Total | 2,150 (92.0%) | 188 (8.0%) |
Health Insurance Coverage by Citizenship Status in Gold Bar
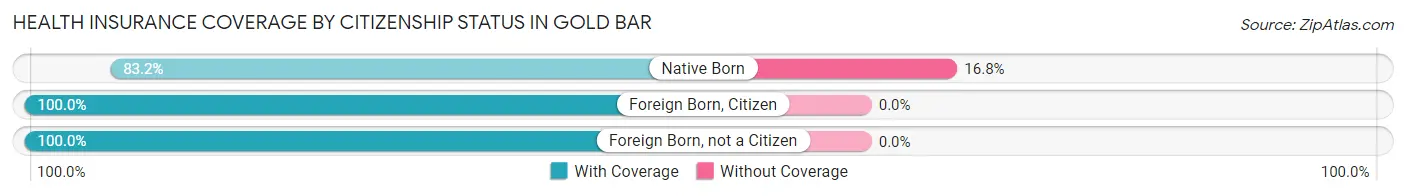
| Citizenship Status | With Coverage | Without Coverage |
| Native Born | 173 (83.2%) | 35 (16.8%) |
| Foreign Born, Citizen | 422 (100.0%) | 0 (0.0%) |
| Foreign Born, not a Citizen | 211 (100.0%) | 0 (0.0%) |
Health Insurance Coverage by Household Income in Gold Bar
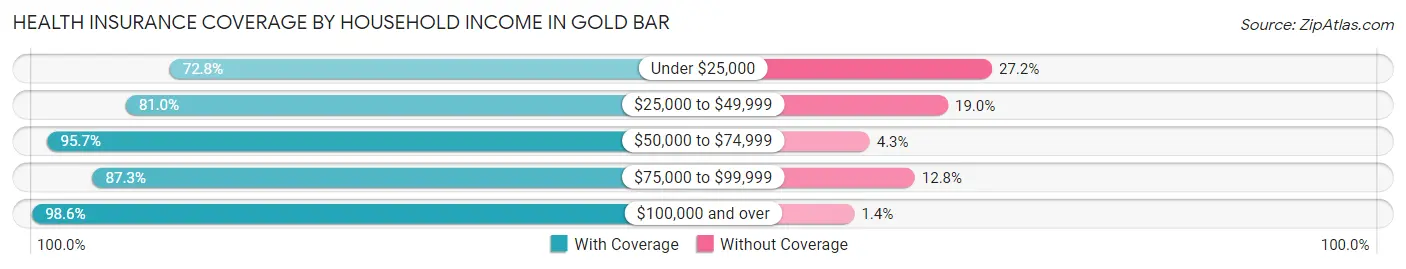
| Household Income | With Coverage | Without Coverage |
| Under $25,000 | 99 (72.8%) | 37 (27.2%) |
| $25,000 to $49,999 | 205 (81.0%) | 48 (19.0%) |
| $50,000 to $74,999 | 400 (95.7%) | 18 (4.3%) |
| $75,000 to $99,999 | 486 (87.3%) | 71 (12.8%) |
| $100,000 and over | 960 (98.6%) | 14 (1.4%) |
Public vs Private Health Insurance Coverage by Age in Gold Bar
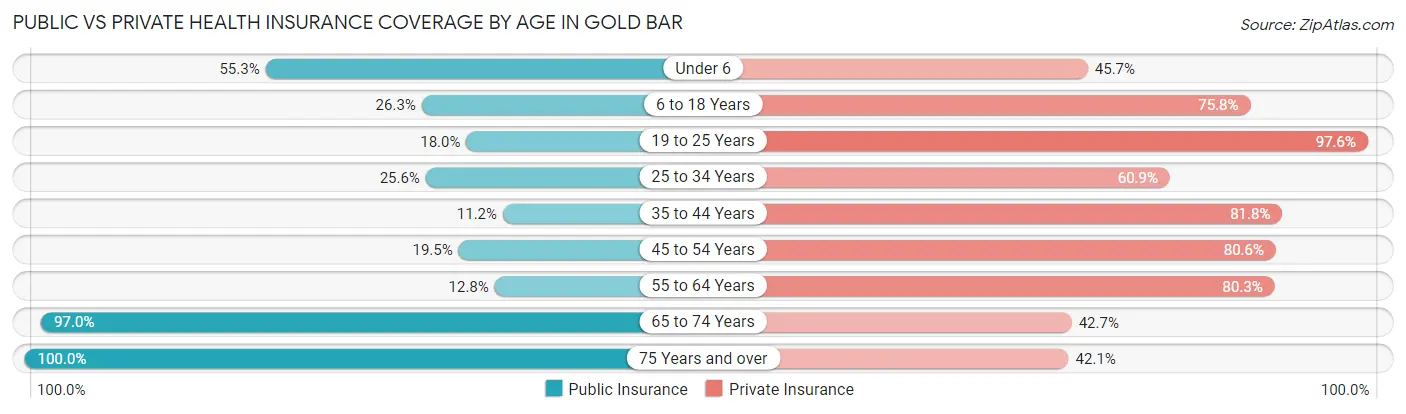
| Age Bracket | Public Insurance | Private Insurance |
| Under 6 | 115 (55.3%) | 95 (45.7%) |
| 6 to 18 Years | 111 (26.3%) | 320 (75.8%) |
| 19 to 25 Years | 38 (18.0%) | 206 (97.6%) |
| 25 to 34 Years | 81 (25.6%) | 193 (60.9%) |
| 35 to 44 Years | 32 (11.2%) | 233 (81.8%) |
| 45 to 54 Years | 71 (19.5%) | 294 (80.5%) |
| 55 to 64 Years | 37 (12.8%) | 233 (80.3%) |
| 65 to 74 Years | 159 (97.0%) | 70 (42.7%) |
| 75 Years and over | 76 (100.0%) | 32 (42.1%) |
| Total | 720 (30.8%) | 1,676 (71.7%) |
Disability Status by Sex by Age in Gold Bar
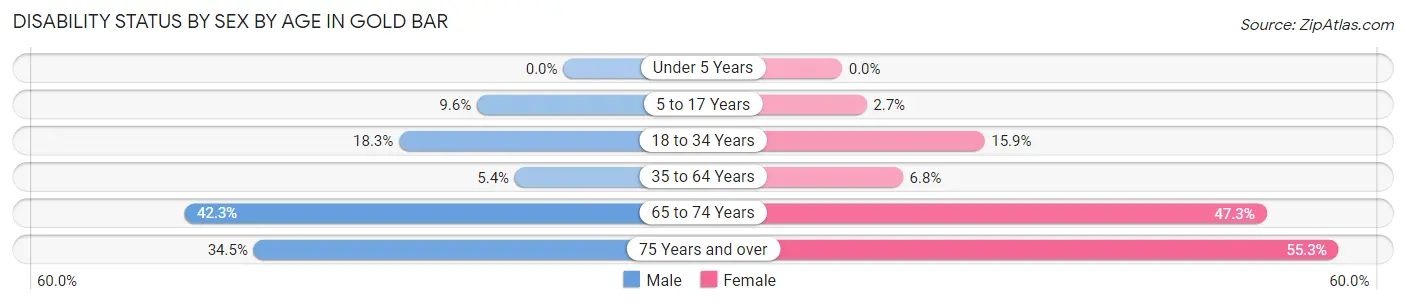
| Age Bracket | Male | Female |
| Under 5 Years | 0 (0.0%) | 0 (0.0%) |
| 5 to 17 Years | 25 (9.6%) | 5 (2.7%) |
| 18 to 34 Years | 47 (18.3%) | 43 (15.9%) |
| 35 to 64 Years | 26 (5.4%) | 31 (6.8%) |
| 65 to 74 Years | 30 (42.2%) | 44 (47.3%) |
| 75 Years and over | 10 (34.5%) | 26 (55.3%) |
Disability Class by Sex by Age in Gold Bar
Disability Class: Hearing Difficulty
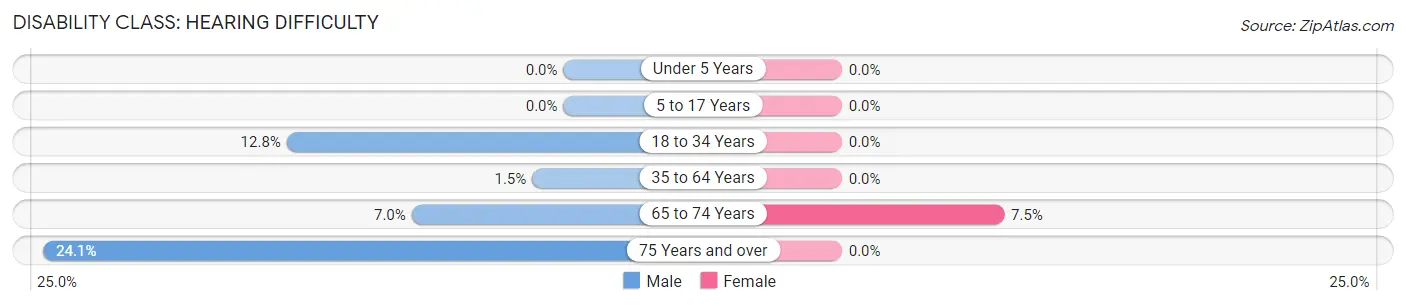
| Age Bracket | Male | Female |
| Under 5 Years | 0 (0.0%) | 0 (0.0%) |
| 5 to 17 Years | 0 (0.0%) | 0 (0.0%) |
| 18 to 34 Years | 33 (12.8%) | 0 (0.0%) |
| 35 to 64 Years | 7 (1.5%) | 0 (0.0%) |
| 65 to 74 Years | 5 (7.0%) | 7 (7.5%) |
| 75 Years and over | 7 (24.1%) | 0 (0.0%) |
Disability Class: Vision Difficulty
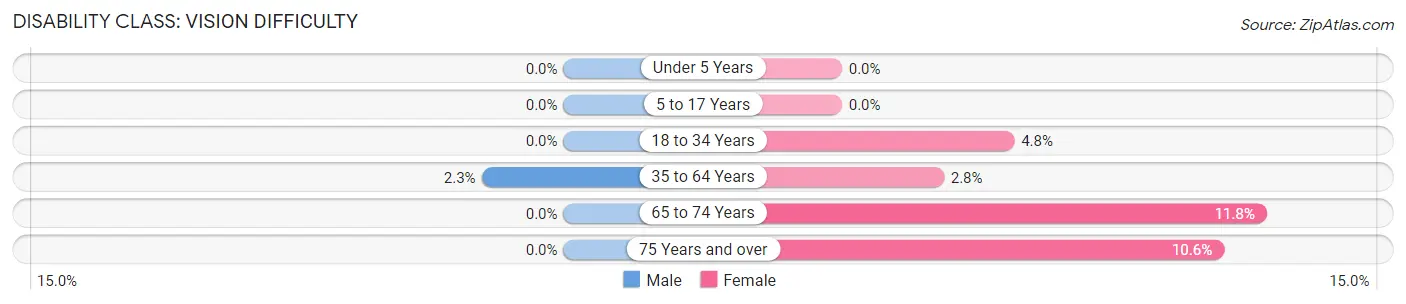
| Age Bracket | Male | Female |
| Under 5 Years | 0 (0.0%) | 0 (0.0%) |
| 5 to 17 Years | 0 (0.0%) | 0 (0.0%) |
| 18 to 34 Years | 0 (0.0%) | 13 (4.8%) |
| 35 to 64 Years | 11 (2.3%) | 13 (2.8%) |
| 65 to 74 Years | 0 (0.0%) | 11 (11.8%) |
| 75 Years and over | 0 (0.0%) | 5 (10.6%) |
Disability Class: Cognitive Difficulty
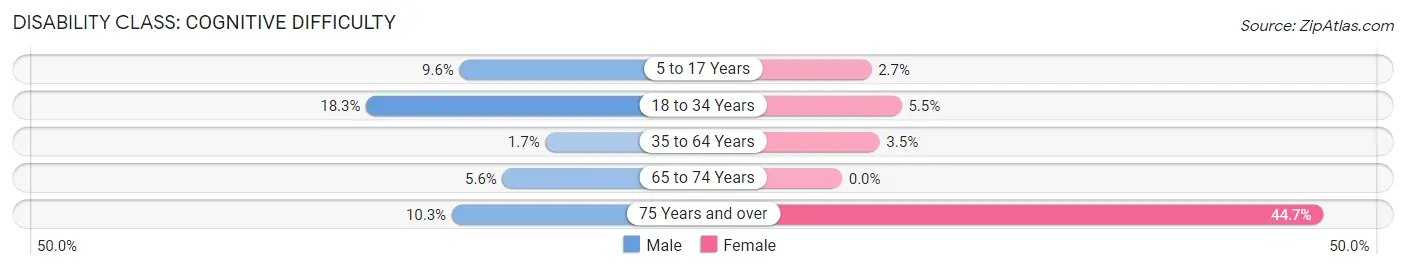
| Age Bracket | Male | Female |
| 5 to 17 Years | 25 (9.6%) | 5 (2.7%) |
| 18 to 34 Years | 47 (18.3%) | 15 (5.5%) |
| 35 to 64 Years | 8 (1.7%) | 16 (3.5%) |
| 65 to 74 Years | 4 (5.6%) | 0 (0.0%) |
| 75 Years and over | 3 (10.3%) | 21 (44.7%) |
Disability Class: Ambulatory Difficulty
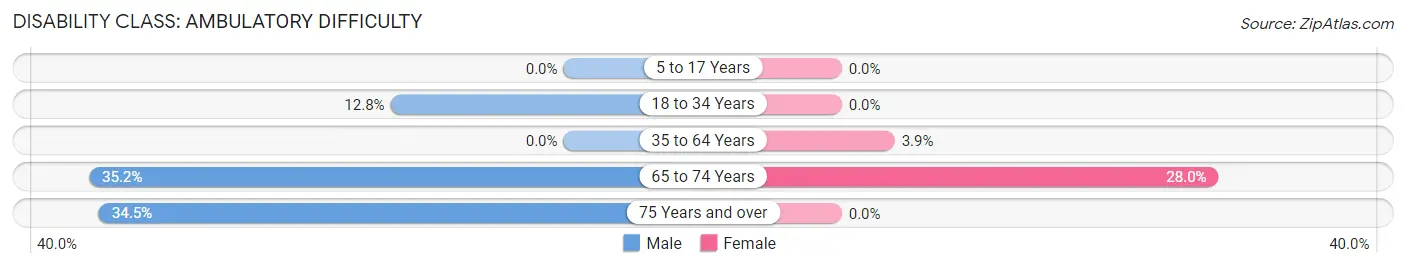
| Age Bracket | Male | Female |
| 5 to 17 Years | 0 (0.0%) | 0 (0.0%) |
| 18 to 34 Years | 33 (12.8%) | 0 (0.0%) |
| 35 to 64 Years | 0 (0.0%) | 18 (3.9%) |
| 65 to 74 Years | 25 (35.2%) | 26 (28.0%) |
| 75 Years and over | 10 (34.5%) | 0 (0.0%) |
Disability Class: Self-Care Difficulty
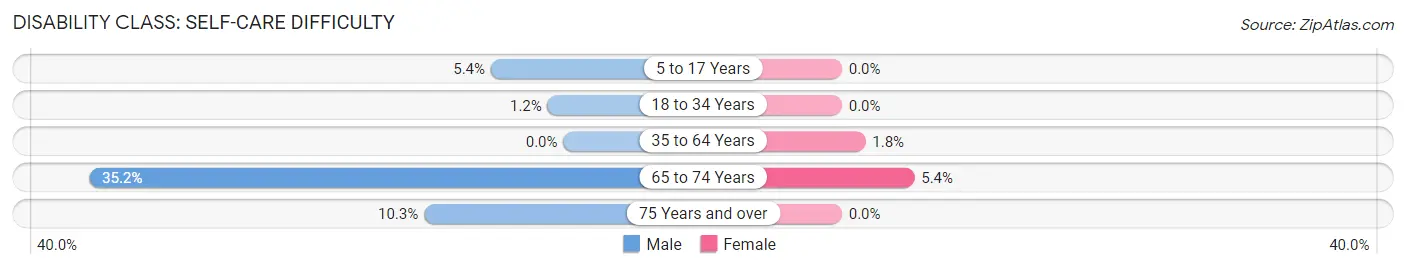
| Age Bracket | Male | Female |
| 5 to 17 Years | 14 (5.4%) | 0 (0.0%) |
| 18 to 34 Years | 3 (1.2%) | 0 (0.0%) |
| 35 to 64 Years | 0 (0.0%) | 8 (1.8%) |
| 65 to 74 Years | 25 (35.2%) | 5 (5.4%) |
| 75 Years and over | 3 (10.3%) | 0 (0.0%) |
Technology Access in Gold Bar
Computing Device Access in Gold Bar
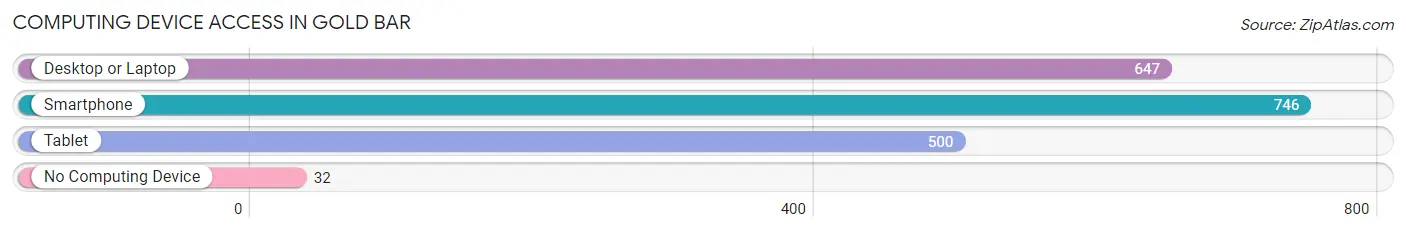
| Device Type | # Households | % Households |
| Desktop or Laptop | 647 | 78.1% |
| Smartphone | 746 | 90.1% |
| Tablet | 500 | 60.4% |
| No Computing Device | 32 | 3.9% |
| Total | 828 | 100.0% |
Internet Access in Gold Bar
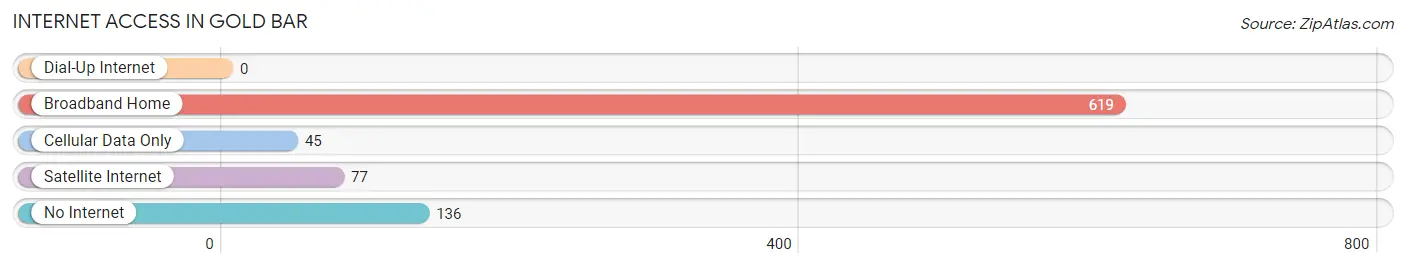
| Internet Type | # Households | % Households |
| Dial-Up Internet | 0 | 0.0% |
| Broadband Home | 619 | 74.8% |
| Cellular Data Only | 45 | 5.4% |
| Satellite Internet | 77 | 9.3% |
| No Internet | 136 | 16.4% |
| Total | 828 | 100.0% |
Gold Bar Summary
Gold Bar, Washington is a small town located in Snohomish County, Washington, United States. It is situated in the foothills of the Cascade Mountains, approximately 40 miles east of Seattle. The town has a population of approximately 2,000 people and is known for its rural charm and outdoor recreation opportunities.
History
Gold Bar was first settled in the late 1800s by miners who were searching for gold in the nearby rivers and streams. The town was officially incorporated in 1909 and was named after the nearby Gold Bar Mine. The mine was one of the most productive gold mines in the area and was responsible for much of the town’s early growth.
In the early 1900s, the town was a bustling center of commerce and industry. It was home to several sawmills, a brickyard, a flour mill, and a number of other businesses. The town also had a railroad station, which connected it to the larger cities of Seattle and Everett.
In the 1950s, the town began to decline as the local economy shifted away from mining and logging. Many of the businesses closed and the population began to decline. In the late 1970s, the town was revitalized by the construction of the nearby Wallace Falls State Park. The park brought new visitors to the area and helped to revive the local economy.
Geography
Gold Bar is located in the foothills of the Cascade Mountains, approximately 40 miles east of Seattle. The town is situated at the confluence of the Skykomish and Sultan Rivers. The surrounding area is characterized by rolling hills, dense forests, and numerous rivers and streams.
The climate in Gold Bar is mild and temperate. Summers are warm and dry, while winters are cool and wet. The average annual temperature is around 50 degrees Fahrenheit.
Economy
The economy of Gold Bar is largely based on tourism and outdoor recreation. The town is home to several popular attractions, including Wallace Falls State Park, the Wallace Falls Interpretive Center, and the Gold Bar Mine. The town also has several restaurants, shops, and other businesses that cater to visitors.
In addition to tourism, the town is also home to several small businesses, including a sawmill, a lumber yard, and a number of other small businesses. The town also has a number of small farms and ranches that produce a variety of crops and livestock.
Demographics
As of the 2010 census, the population of Gold Bar was 2,067. The racial makeup of the town was 94.3% White, 0.7% African American, 0.7% Native American, 0.7% Asian, 0.2% Pacific Islander, and 2.6% from other races. The median household income was $50,938, and the median family income was $56,250.
Gold Bar is a small, rural town with a strong sense of community. The town is home to a variety of churches, schools, and other organizations that help to foster a sense of community and provide a variety of services to the residents. The town also has a number of parks and recreational areas that provide a variety of outdoor activities for residents and visitors alike.
Common Questions
What is Per Capita Income in Gold Bar?
Per Capita income in Gold Bar is $34,540.
What is the Median Family Income in Gold Bar?
Median Family Income in Gold Bar is $98,365.
What is the Median Household income in Gold Bar?
Median Household Income in Gold Bar is $84,310.
What is Income or Wage Gap in Gold Bar?
Income or Wage Gap in Gold Bar is 27.5%.
Women in Gold Bar earn 72.5 cents for every dollar earned by a man.
What is Inequality or Gini Index in Gold Bar?
Inequality or Gini Index in Gold Bar is 0.33.
What is the Total Population of Gold Bar?
Total Population of Gold Bar is 2,338.
What is the Total Male Population of Gold Bar?
Total Male Population of Gold Bar is 1,201.
What is the Total Female Population of Gold Bar?
Total Female Population of Gold Bar is 1,137.
What is the Ratio of Males per 100 Females in Gold Bar?
There are 105.63 Males per 100 Females in Gold Bar.
What is the Ratio of Females per 100 Males in Gold Bar?
There are 94.67 Females per 100 Males in Gold Bar.
What is the Median Population Age in Gold Bar?
Median Population Age in Gold Bar is 35.4 Years.
What is the Average Family Size in Gold Bar
Average Family Size in Gold Bar is 3.6 People.
What is the Average Household Size in Gold Bar
Average Household Size in Gold Bar is 2.8 People.
How Large is the Labor Force in Gold Bar?
There are 1,222 People in the Labor Forcein in Gold Bar.
What is the Percentage of People in the Labor Force in Gold Bar?
68.8% of People are in the Labor Force in Gold Bar.
What is the Unemployment Rate in Gold Bar?
Unemployment Rate in Gold Bar is 5.3%.