Zip Codes with the Highest Percentage of Population Employed in Installation, Maintenance & Repair in Bothell, WA
RELATED REPORTS & OPTIONS
Installation, Maintenance & Repair
Bothell
Compare Zip Codes
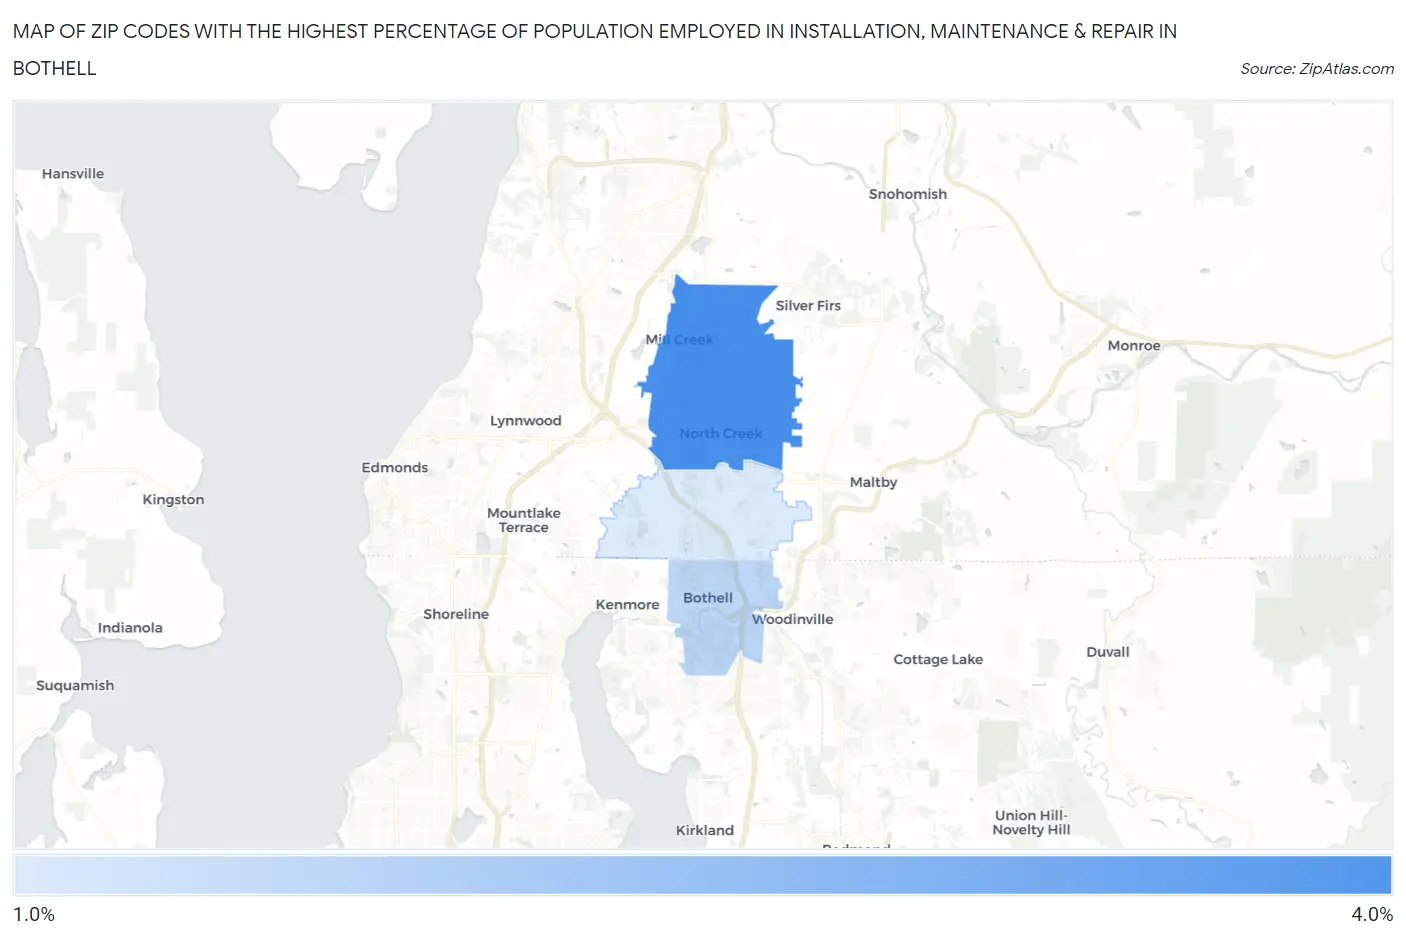
Map of Zip Codes with the Highest Percentage of Population Employed in Installation, Maintenance & Repair in Bothell
1.1%
3.0%
Zip Codes with the Highest Percentage of Population Employed in Installation, Maintenance & Repair in Bothell, WA
| Zip Code | % Employed | vs State | vs National | |
| 1. | 98012 | 3.0% | 2.9%(+0.096)#278 | 3.1%(-0.043)#16,870 |
| 2. | 98011 | 1.5% | 2.9%(-1.41)#415 | 3.1%(-1.55)#24,095 |
| 3. | 98021 | 1.1% | 2.9%(-1.81)#447 | 3.1%(-1.95)#25,539 |
1
Common Questions
What are the Top Zip Codes with the Highest Percentage of Population Employed in Installation, Maintenance & Repair in Bothell, WA?
Top Zip Codes with the Highest Percentage of Population Employed in Installation, Maintenance & Repair in Bothell, WA are:
What zip code has the Highest Percentage of Population Employed in Installation, Maintenance & Repair in Bothell, WA?
98012 has the Highest Percentage of Population Employed in Installation, Maintenance & Repair in Bothell, WA with 3.0%.
What is the Percentage of Population Employed in Installation, Maintenance & Repair in Bothell, WA?
Percentage of Population Employed in Installation, Maintenance & Repair in Bothell is 1.2%.
What is the Percentage of Population Employed in Installation, Maintenance & Repair in Washington?
Percentage of Population Employed in Installation, Maintenance & Repair in Washington is 2.9%.
What is the Percentage of Population Employed in Installation, Maintenance & Repair in the United States?
Percentage of Population Employed in Installation, Maintenance & Repair in the United States is 3.1%.