Lyman, WA Map & Demographics
Lyman Map
Lyman Overview
$34,188
PER CAPITA INCOME
$103,125
AVG FAMILY INCOME
$81,250
AVG HOUSEHOLD INCOME
42.2%
WAGE / INCOME GAP [ % ]
57.8¢/ $1
WAGE / INCOME GAP [ $ ]
0.34
INEQUALITY / GINI INDEX
386
TOTAL POPULATION
183
MALE POPULATION
203
FEMALE POPULATION
90.15
MALES / 100 FEMALES
110.93
FEMALES / 100 MALES
39.2
MEDIAN AGE
2.9
AVG FAMILY SIZE
2.7
AVG HOUSEHOLD SIZE
225
LABOR FORCE [ PEOPLE ]
72.6%
PERCENT IN LABOR FORCE
5.8%
UNEMPLOYMENT RATE
Lyman Zip Codes
Lyman Area Codes
Income in Lyman
Income Overview in Lyman
Per Capita Income in Lyman is $34,188, while median incomes of families and households are $103,125 and $81,250 respectively.
| Characteristic | Number | Measure |
| Per Capita Income | 386 | $34,188 |
| Median Family Income | 111 | $103,125 |
| Mean Family Income | 111 | $98,513 |
| Median Household Income | 144 | $81,250 |
| Mean Household Income | 144 | $90,269 |
| Income Deficit | 111 | $0 |
| Wage / Income Gap (%) | 386 | 42.17% |
| Wage / Income Gap ($) | 386 | 57.83¢ per $1 |
| Gini / Inequality Index | 386 | 0.34 |
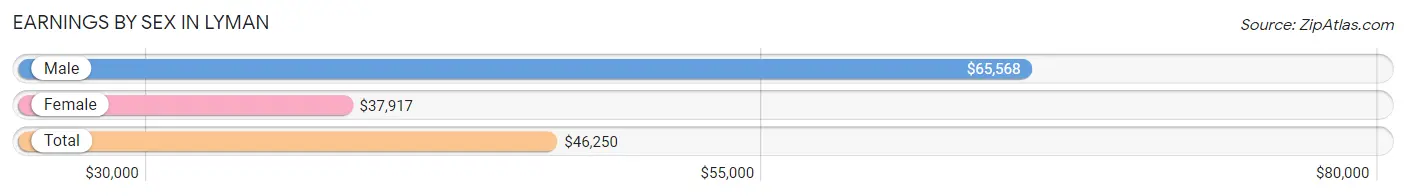
Earnings by Sex in Lyman
Average Earnings in Lyman are $46,250, $65,568 for men and $37,917 for women, a difference of 42.2%.
| Sex | Number | Average Earnings |
| Male | 121 (54.3%) | $65,568 |
| Female | 102 (45.7%) | $37,917 |
| Total | 223 (100.0%) | $46,250 |
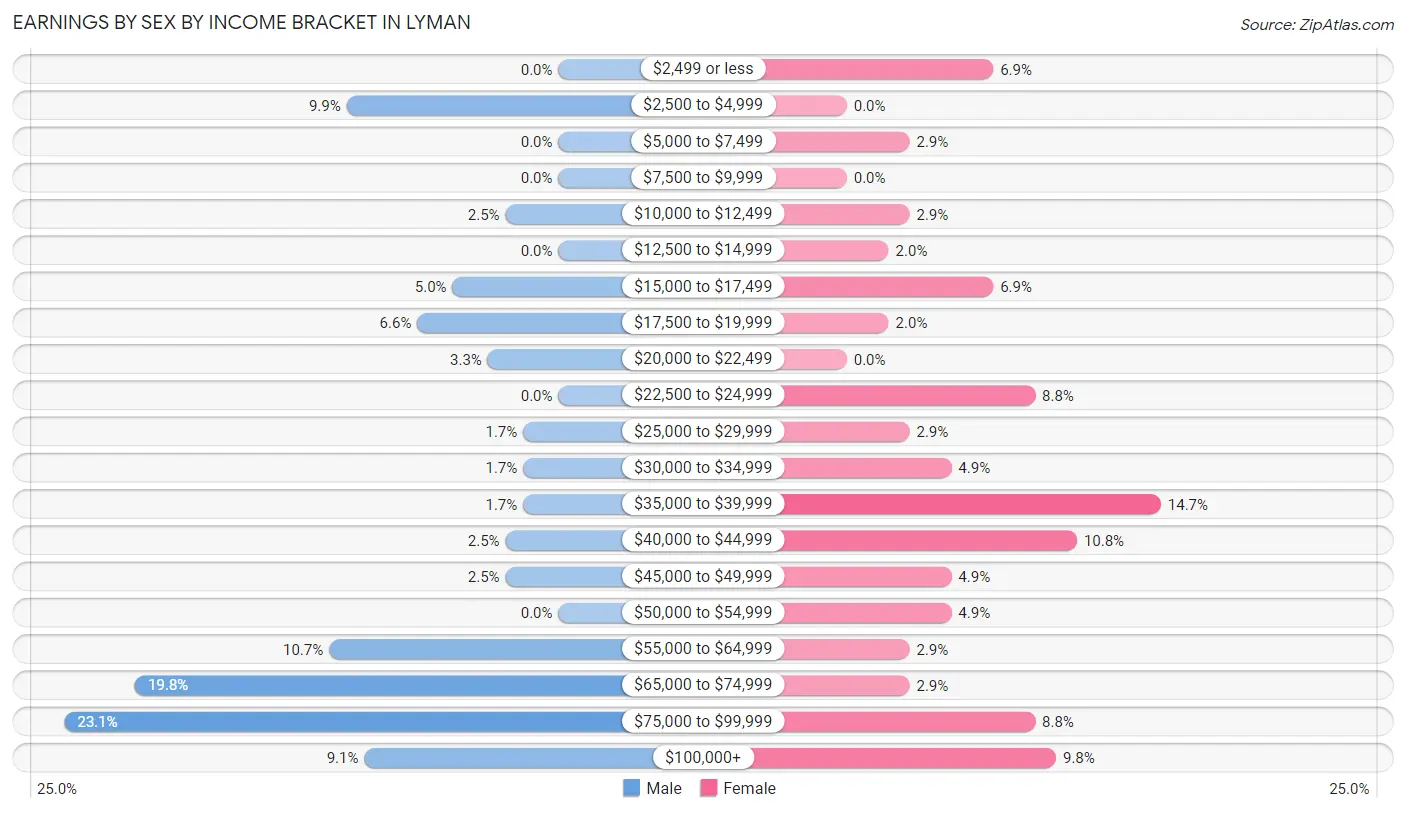
Earnings by Sex by Income Bracket in Lyman
The most common earnings brackets in Lyman are $75,000 to $99,999 for men (28 | 23.1%) and $35,000 to $39,999 for women (15 | 14.7%).
| Income | Male | Female |
| $2,499 or less | 0 (0.0%) | 7 (6.9%) |
| $2,500 to $4,999 | 12 (9.9%) | 0 (0.0%) |
| $5,000 to $7,499 | 0 (0.0%) | 3 (2.9%) |
| $7,500 to $9,999 | 0 (0.0%) | 0 (0.0%) |
| $10,000 to $12,499 | 3 (2.5%) | 3 (2.9%) |
| $12,500 to $14,999 | 0 (0.0%) | 2 (2.0%) |
| $15,000 to $17,499 | 6 (5.0%) | 7 (6.9%) |
| $17,500 to $19,999 | 8 (6.6%) | 2 (2.0%) |
| $20,000 to $22,499 | 4 (3.3%) | 0 (0.0%) |
| $22,500 to $24,999 | 0 (0.0%) | 9 (8.8%) |
| $25,000 to $29,999 | 2 (1.7%) | 3 (2.9%) |
| $30,000 to $34,999 | 2 (1.7%) | 5 (4.9%) |
| $35,000 to $39,999 | 2 (1.7%) | 15 (14.7%) |
| $40,000 to $44,999 | 3 (2.5%) | 11 (10.8%) |
| $45,000 to $49,999 | 3 (2.5%) | 5 (4.9%) |
| $50,000 to $54,999 | 0 (0.0%) | 5 (4.9%) |
| $55,000 to $64,999 | 13 (10.7%) | 3 (2.9%) |
| $65,000 to $74,999 | 24 (19.8%) | 3 (2.9%) |
| $75,000 to $99,999 | 28 (23.1%) | 9 (8.8%) |
| $100,000+ | 11 (9.1%) | 10 (9.8%) |
| Total | 121 (100.0%) | 102 (100.0%) |
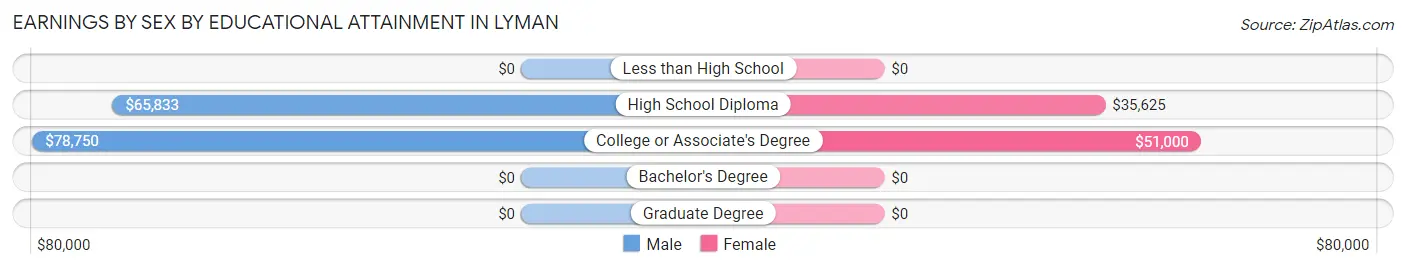
Earnings by Sex by Educational Attainment in Lyman
Average earnings in Lyman are $67,159 for men and $39,375 for women, a difference of 41.4%. Men with an educational attainment of college or associate's degree enjoy the highest average annual earnings of $78,750, while those with high school diploma education earn the least with $65,833. Women with an educational attainment of college or associate's degree earn the most with the average annual earnings of $51,000, while those with high school diploma education have the smallest earnings of $35,625.
| Educational Attainment | Male Income | Female Income |
| Less than High School | - | - |
| High School Diploma | $65,833 | $35,625 |
| College or Associate's Degree | $78,750 | $51,000 |
| Bachelor's Degree | - | - |
| Graduate Degree | - | - |
| Total | $67,159 | $39,375 |
Family Income in Lyman
Family Income Brackets in Lyman
According to the Lyman family income data, there are 37 families falling into the $100,000 to $149,999 income range, which is the most common income bracket and makes up 33.3% of all families.
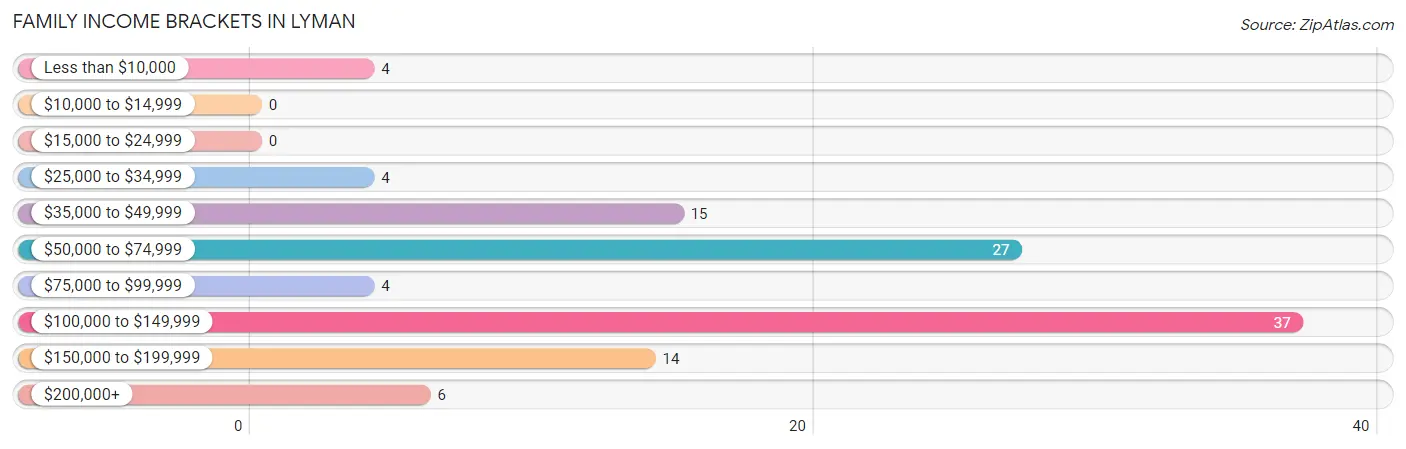
| Income Bracket | # Families | % Families |
| Less than $10,000 | 4 | 3.6% |
| $10,000 to $14,999 | 0 | 0.0% |
| $15,000 to $24,999 | 0 | 0.0% |
| $25,000 to $34,999 | 4 | 3.6% |
| $35,000 to $49,999 | 15 | 13.5% |
| $50,000 to $74,999 | 27 | 24.3% |
| $75,000 to $99,999 | 4 | 3.6% |
| $100,000 to $149,999 | 37 | 33.3% |
| $150,000 to $199,999 | 14 | 12.6% |
| $200,000+ | 6 | 5.4% |
Family Income by Famaliy Size in Lyman
4-person families (23 | 20.7%) account for the highest median family income in Lyman with $115,625 per family, while 2-person families (54 | 48.6%) have the highest median income of $35,625 per family member.
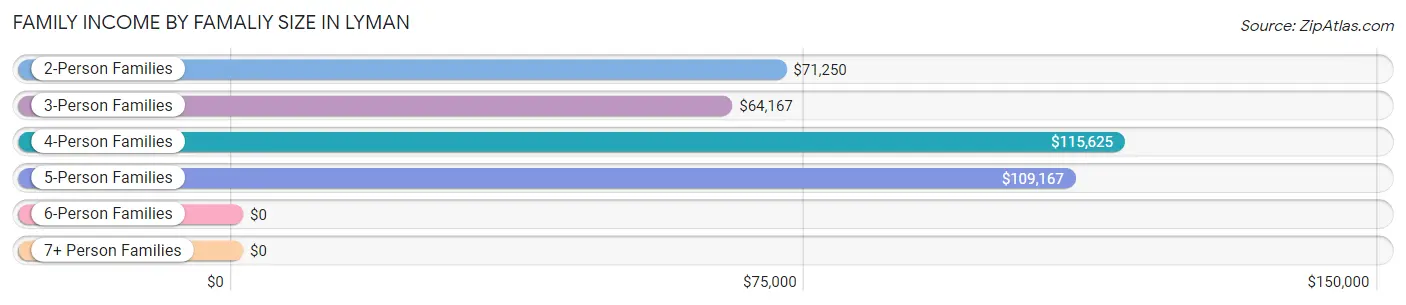
| Income Bracket | # Families | Median Income |
| 2-Person Families | 54 (48.6%) | $71,250 |
| 3-Person Families | 26 (23.4%) | $64,167 |
| 4-Person Families | 23 (20.7%) | $115,625 |
| 5-Person Families | 6 (5.4%) | $109,167 |
| 6-Person Families | 2 (1.8%) | $0 |
| 7+ Person Families | 0 (0.0%) | $0 |
| Total | 111 (100.0%) | $103,125 |
Family Income by Number of Earners in Lyman
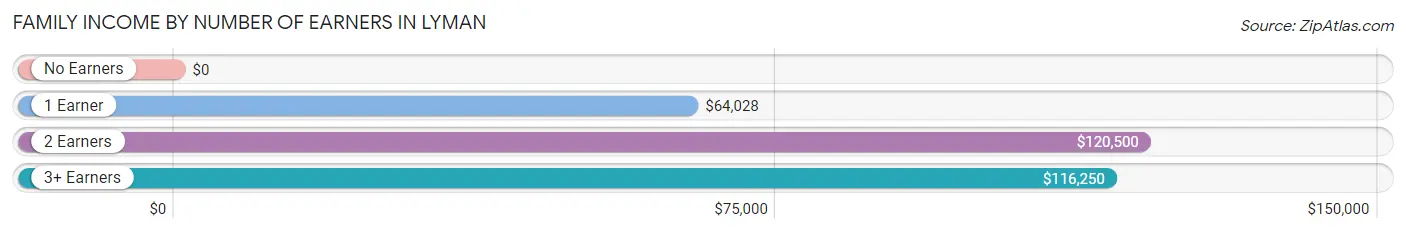
| Number of Earners | # Families | Median Income |
| No Earners | 4 (3.6%) | $0 |
| 1 Earner | 49 (44.1%) | $64,028 |
| 2 Earners | 48 (43.2%) | $120,500 |
| 3+ Earners | 10 (9.0%) | $116,250 |
| Total | 111 (100.0%) | $103,125 |
Household Income in Lyman
Household Income Brackets in Lyman
With 46 households falling in the category, the $100,000 to $149,999 income range is the most frequent in Lyman, accounting for 31.9% of all households.
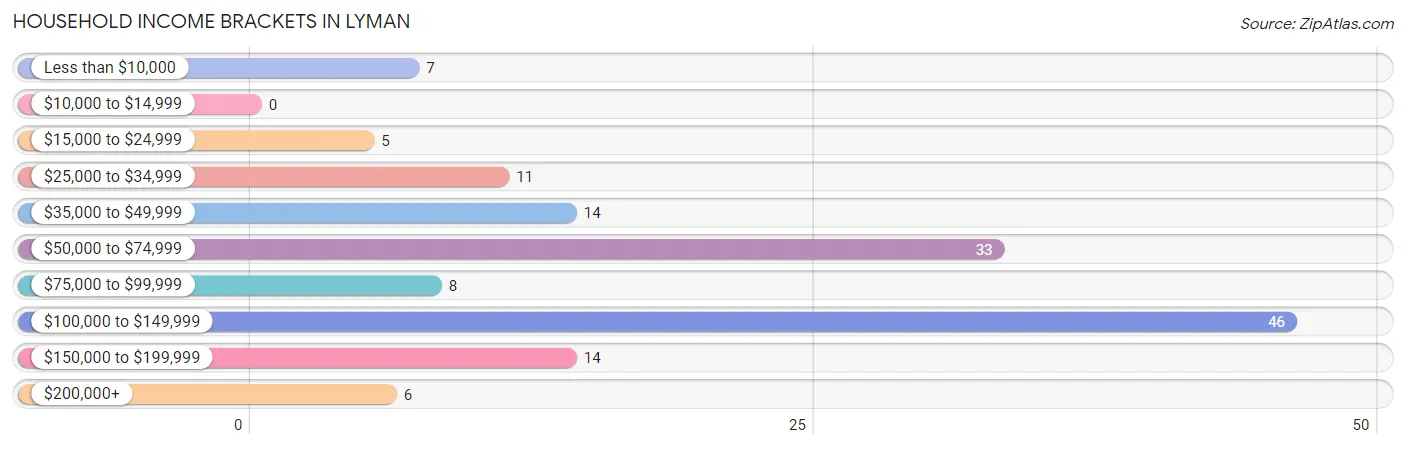
| Income Bracket | # Households | % Households |
| Less than $10,000 | 7 | 4.9% |
| $10,000 to $14,999 | 0 | 0.0% |
| $15,000 to $24,999 | 5 | 3.5% |
| $25,000 to $34,999 | 11 | 7.6% |
| $35,000 to $49,999 | 14 | 9.7% |
| $50,000 to $74,999 | 33 | 22.9% |
| $75,000 to $99,999 | 8 | 5.6% |
| $100,000 to $149,999 | 46 | 31.9% |
| $150,000 to $199,999 | 14 | 9.7% |
| $200,000+ | 6 | 4.2% |
Household Income by Householder Age in Lyman
The median household income in Lyman is $81,250, with the highest median household income of $110,156 found in the 25 to 44 years age bracket for the primary householder. A total of 67 households (46.5%) fall into this category. Meanwhile, the 15 to 24 years age bracket for the primary householder has the lowest median household income of $0, with 8 households (5.6%) in this group.
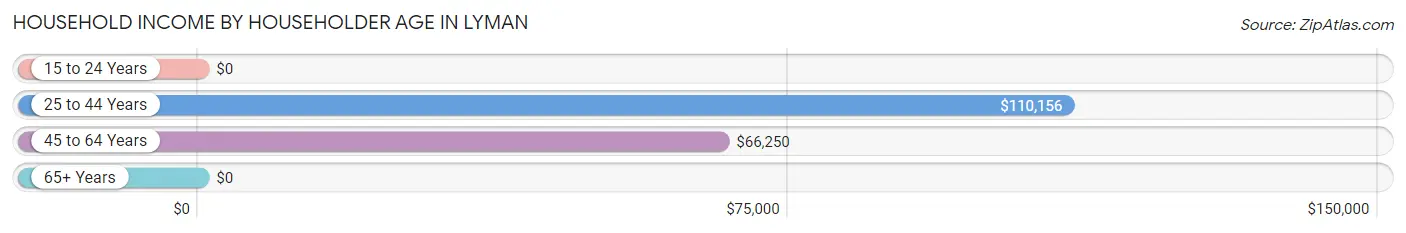
| Income Bracket | # Households | Median Income |
| 15 to 24 Years | 8 (5.6%) | $0 |
| 25 to 44 Years | 67 (46.5%) | $110,156 |
| 45 to 64 Years | 52 (36.1%) | $66,250 |
| 65+ Years | 17 (11.8%) | $0 |
| Total | 144 (100.0%) | $81,250 |
Poverty in Lyman
Income Below Poverty by Sex and Age in Lyman
With 7.6% poverty level for males and 13.8% for females among the residents of Lyman, 18 to 24 year old males and 15 year old females are the most vulnerable to poverty, with 7 males (28.0%) and 5 females (62.5%) in their respective age groups living below the poverty level.
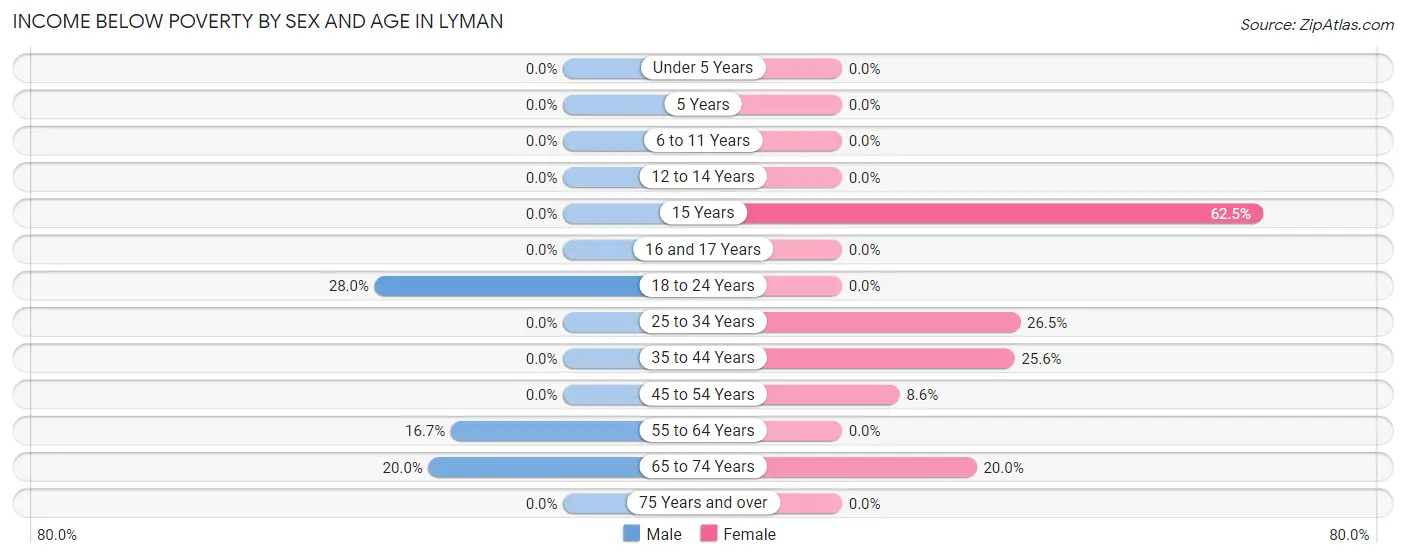
| Age Bracket | Male | Female |
| Under 5 Years | 0 (0.0%) | 0 (0.0%) |
| 5 Years | 0 (0.0%) | 0 (0.0%) |
| 6 to 11 Years | 0 (0.0%) | 0 (0.0%) |
| 12 to 14 Years | 0 (0.0%) | 0 (0.0%) |
| 15 Years | 0 (0.0%) | 5 (62.5%) |
| 16 and 17 Years | 0 (0.0%) | 0 (0.0%) |
| 18 to 24 Years | 7 (28.0%) | 0 (0.0%) |
| 25 to 34 Years | 0 (0.0%) | 9 (26.5%) |
| 35 to 44 Years | 0 (0.0%) | 10 (25.6%) |
| 45 to 54 Years | 0 (0.0%) | 3 (8.6%) |
| 55 to 64 Years | 5 (16.7%) | 0 (0.0%) |
| 65 to 74 Years | 2 (20.0%) | 1 (20.0%) |
| 75 Years and over | 0 (0.0%) | 0 (0.0%) |
| Total | 14 (7.6%) | 28 (13.8%) |
Income Above Poverty by Sex and Age in Lyman
According to the poverty statistics in Lyman, males aged under 5 years and females aged under 5 years are the age groups that are most secure financially, with 100.0% of males and 100.0% of females in these age groups living above the poverty line.
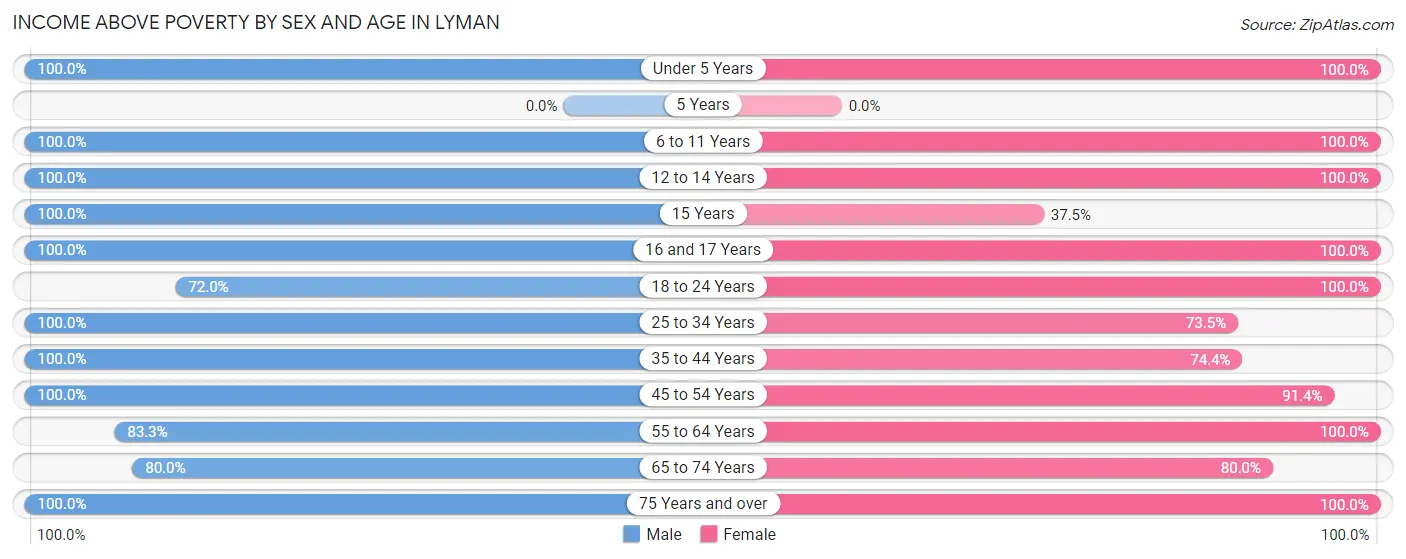
| Age Bracket | Male | Female |
| Under 5 Years | 4 (100.0%) | 12 (100.0%) |
| 5 Years | 0 (0.0%) | 0 (0.0%) |
| 6 to 11 Years | 10 (100.0%) | 21 (100.0%) |
| 12 to 14 Years | 16 (100.0%) | 4 (100.0%) |
| 15 Years | 1 (100.0%) | 3 (37.5%) |
| 16 and 17 Years | 5 (100.0%) | 4 (100.0%) |
| 18 to 24 Years | 18 (72.0%) | 20 (100.0%) |
| 25 to 34 Years | 21 (100.0%) | 25 (73.5%) |
| 35 to 44 Years | 27 (100.0%) | 29 (74.4%) |
| 45 to 54 Years | 28 (100.0%) | 32 (91.4%) |
| 55 to 64 Years | 25 (83.3%) | 17 (100.0%) |
| 65 to 74 Years | 8 (80.0%) | 4 (80.0%) |
| 75 Years and over | 6 (100.0%) | 4 (100.0%) |
| Total | 169 (92.3%) | 175 (86.2%) |
Income Below Poverty Among Married-Couple Families in Lyman
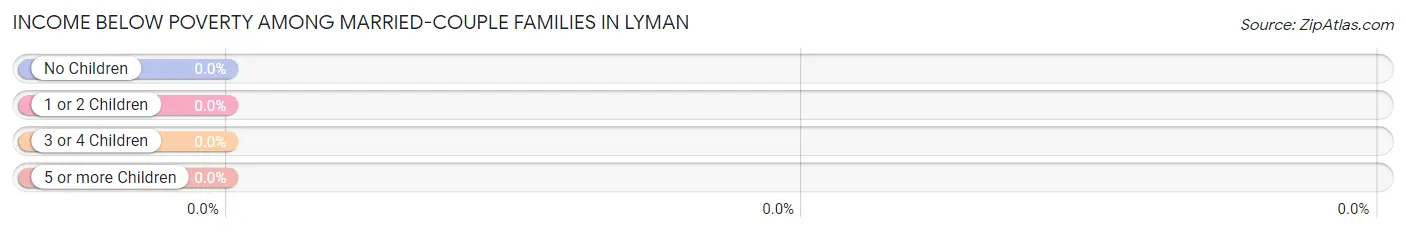
| Children | Above Poverty | Below Poverty |
| No Children | 49 (100.0%) | 0 (0.0%) |
| 1 or 2 Children | 31 (100.0%) | 0 (0.0%) |
| 3 or 4 Children | 2 (100.0%) | 0 (0.0%) |
| 5 or more Children | 0 (0.0%) | 0 (0.0%) |
| Total | 82 (100.0%) | 0 (0.0%) |
Income Below Poverty Among Single-Parent Households in Lyman
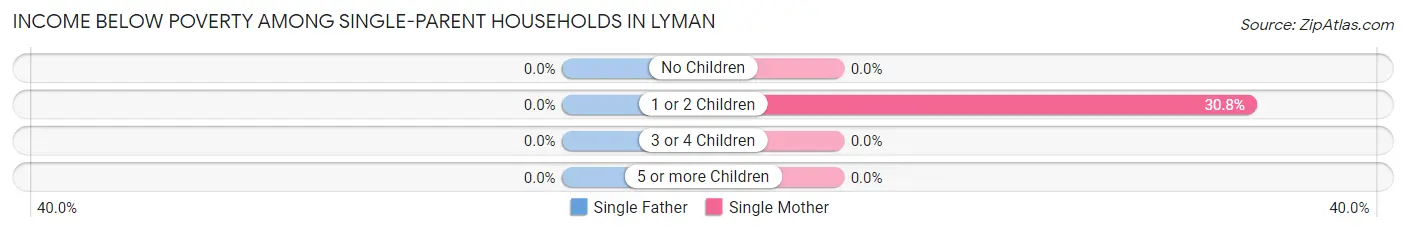
| Children | Single Father | Single Mother |
| No Children | 0 (0.0%) | 0 (0.0%) |
| 1 or 2 Children | 0 (0.0%) | 4 (30.8%) |
| 3 or 4 Children | 0 (0.0%) | 0 (0.0%) |
| 5 or more Children | 0 (0.0%) | 0 (0.0%) |
| Total | 0 (0.0%) | 4 (22.2%) |
Income Below Poverty Among Married-Couple vs Single-Parent Households in Lyman
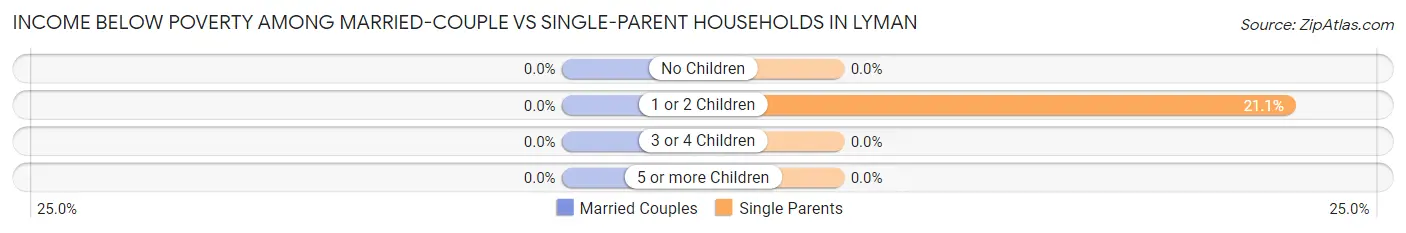
| Children | Married-Couple Families | Single-Parent Households |
| No Children | 0 (0.0%) | 0 (0.0%) |
| 1 or 2 Children | 0 (0.0%) | 4 (21.0%) |
| 3 or 4 Children | 0 (0.0%) | 0 (0.0%) |
| 5 or more Children | 0 (0.0%) | 0 (0.0%) |
| Total | 0 (0.0%) | 4 (13.8%) |
Race in Lyman
The most populous races in Lyman are White / Caucasian (319 | 82.6%), Two or more Races (61 | 15.8%), and Hispanic or Latino (18 | 4.7%).
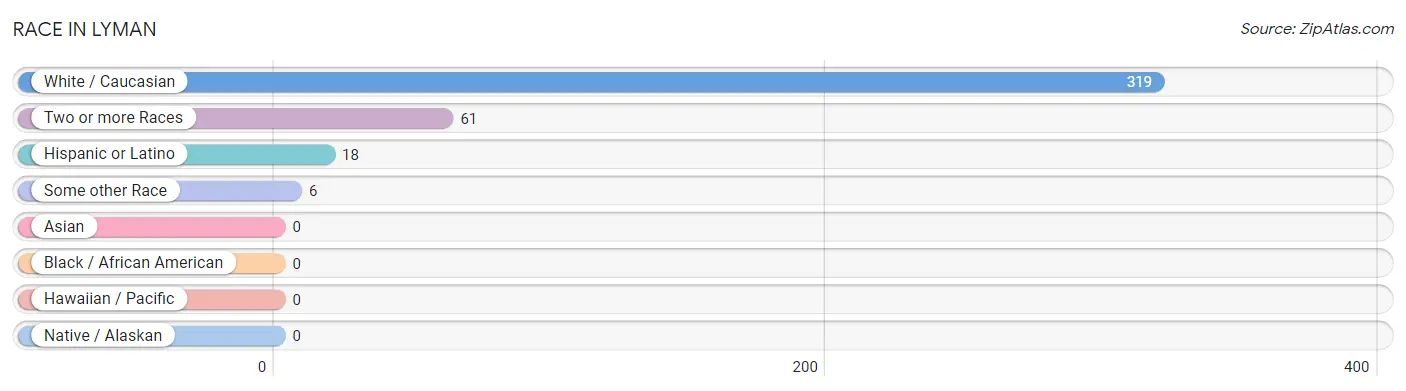
| Race | # Population | % Population |
| Asian | 0 | 0.0% |
| Black / African American | 0 | 0.0% |
| Hawaiian / Pacific | 0 | 0.0% |
| Hispanic or Latino | 18 | 4.7% |
| Native / Alaskan | 0 | 0.0% |
| White / Caucasian | 319 | 82.6% |
| Two or more Races | 61 | 15.8% |
| Some other Race | 6 | 1.5% |
| Total | 386 | 100.0% |
Ancestry in Lyman
The most populous ancestries reported in Lyman are American (50 | 13.0%), German (48 | 12.4%), English (34 | 8.8%), Irish (30 | 7.8%), and Norwegian (28 | 7.2%), together accounting for 49.2% of all Lyman residents.
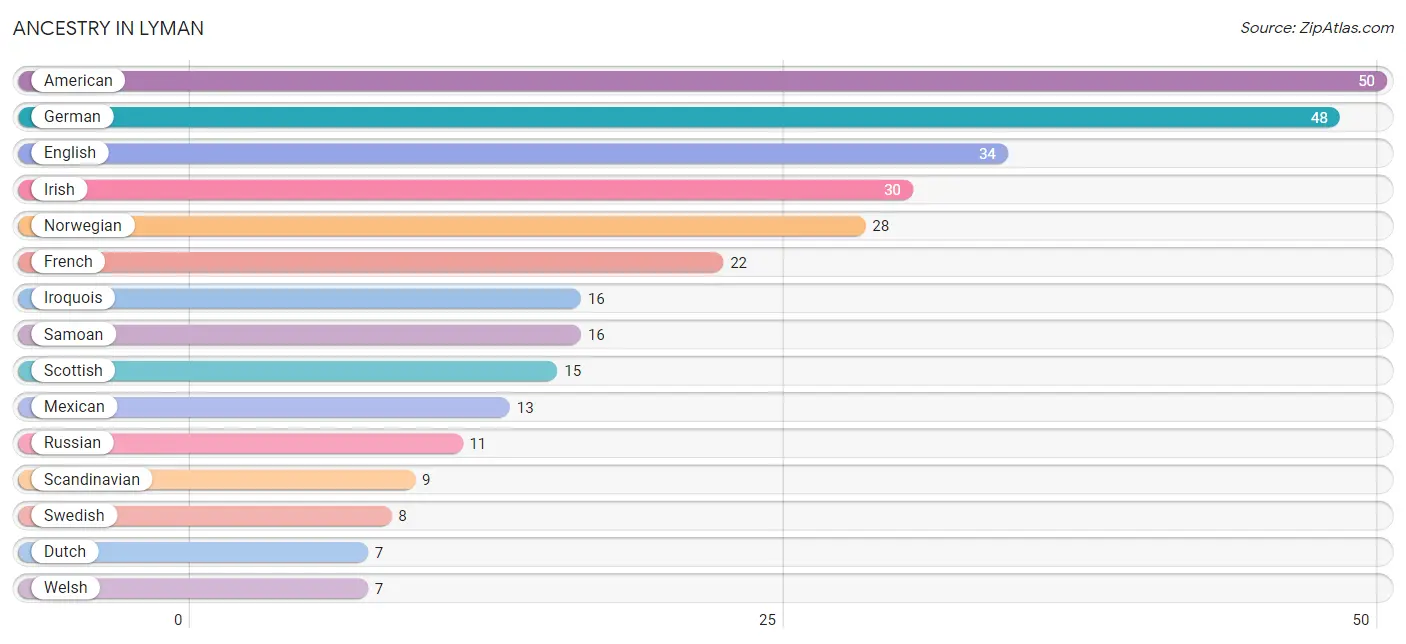
| Ancestry | # Population | % Population |
| American | 50 | 13.0% |
| Dutch | 7 | 1.8% |
| Dutch West Indian | 1 | 0.3% |
| English | 34 | 8.8% |
| French | 22 | 5.7% |
| French Canadian | 1 | 0.3% |
| German | 48 | 12.4% |
| German Russian | 2 | 0.5% |
| Greek | 6 | 1.5% |
| Hungarian | 3 | 0.8% |
| Irish | 30 | 7.8% |
| Iroquois | 16 | 4.2% |
| Italian | 1 | 0.3% |
| Mexican | 13 | 3.4% |
| Norwegian | 28 | 7.2% |
| Peruvian | 5 | 1.3% |
| Polish | 6 | 1.5% |
| Russian | 11 | 2.9% |
| Samoan | 16 | 4.2% |
| Scandinavian | 9 | 2.3% |
| Scottish | 15 | 3.9% |
| South American | 5 | 1.3% |
| Swedish | 8 | 2.1% |
| Swiss | 5 | 1.3% |
| Welsh | 7 | 1.8% | View All 25 Rows |
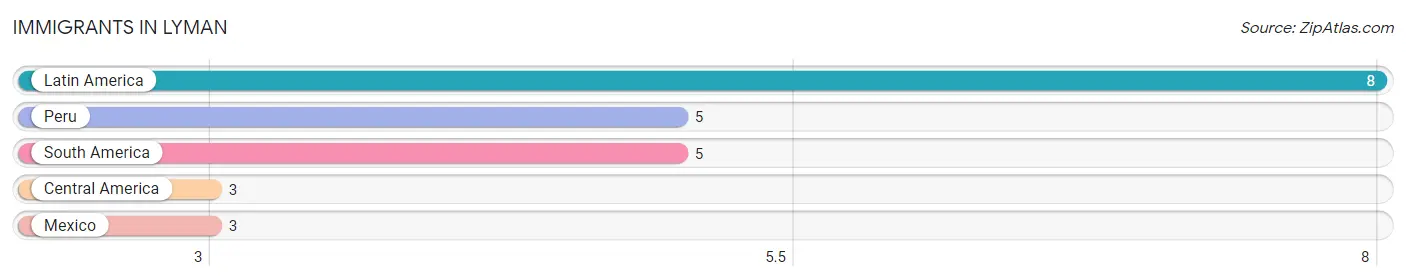
Immigrants in Lyman
The most numerous immigrant groups reported in Lyman came from Latin America (8 | 2.1%), Peru (5 | 1.3%), South America (5 | 1.3%), Central America (3 | 0.8%), and Mexico (3 | 0.8%), together accounting for 6.2% of all Lyman residents.
| Immigration Origin | # Population | % Population |
| Central America | 3 | 0.8% |
| Latin America | 8 | 2.1% |
| Mexico | 3 | 0.8% |
| Peru | 5 | 1.3% |
| South America | 5 | 1.3% | View All 5 Rows |
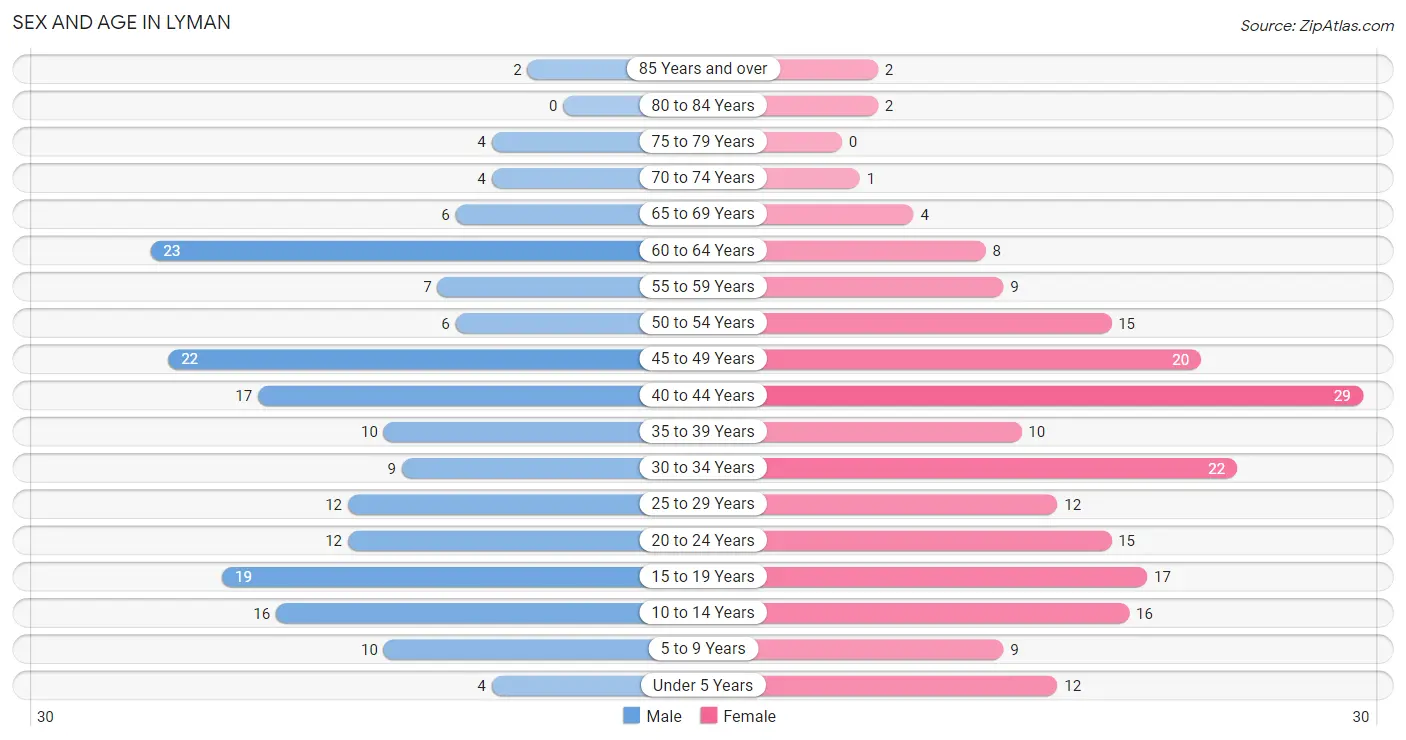
Sex and Age in Lyman
Sex and Age in Lyman
The most populous age groups in Lyman are 60 to 64 Years (23 | 12.6%) for men and 40 to 44 Years (29 | 14.3%) for women.
| Age Bracket | Male | Female |
| Under 5 Years | 4 (2.2%) | 12 (5.9%) |
| 5 to 9 Years | 10 (5.5%) | 9 (4.4%) |
| 10 to 14 Years | 16 (8.7%) | 16 (7.9%) |
| 15 to 19 Years | 19 (10.4%) | 17 (8.4%) |
| 20 to 24 Years | 12 (6.6%) | 15 (7.4%) |
| 25 to 29 Years | 12 (6.6%) | 12 (5.9%) |
| 30 to 34 Years | 9 (4.9%) | 22 (10.8%) |
| 35 to 39 Years | 10 (5.5%) | 10 (4.9%) |
| 40 to 44 Years | 17 (9.3%) | 29 (14.3%) |
| 45 to 49 Years | 22 (12.0%) | 20 (9.9%) |
| 50 to 54 Years | 6 (3.3%) | 15 (7.4%) |
| 55 to 59 Years | 7 (3.8%) | 9 (4.4%) |
| 60 to 64 Years | 23 (12.6%) | 8 (3.9%) |
| 65 to 69 Years | 6 (3.3%) | 4 (2.0%) |
| 70 to 74 Years | 4 (2.2%) | 1 (0.5%) |
| 75 to 79 Years | 4 (2.2%) | 0 (0.0%) |
| 80 to 84 Years | 0 (0.0%) | 2 (1.0%) |
| 85 Years and over | 2 (1.1%) | 2 (1.0%) |
| Total | 183 (100.0%) | 203 (100.0%) |
Families and Households in Lyman
Median Family Size in Lyman
The median family size in Lyman is 2.87 persons per family, with single male/father families (11 | 9.9%) accounting for the largest median family size of 3.09 persons per family. On the other hand, single female/mother families (18 | 16.2%) represent the smallest median family size with 2.39 persons per family.
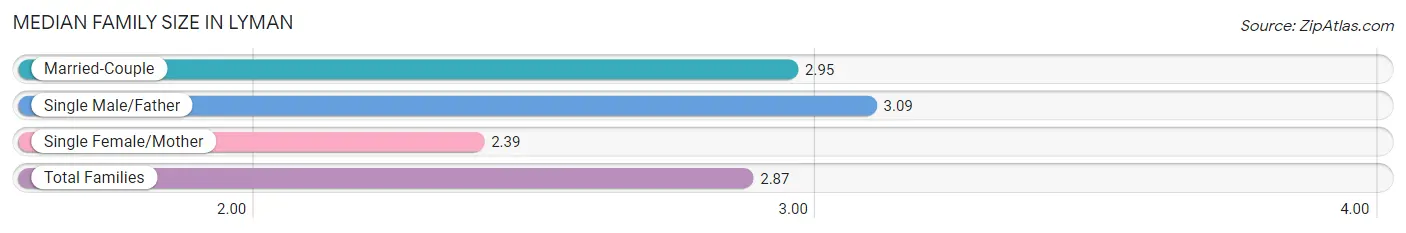
| Family Type | # Families | Family Size |
| Married-Couple | 82 (73.9%) | 2.95 |
| Single Male/Father | 11 (9.9%) | 3.09 |
| Single Female/Mother | 18 (16.2%) | 2.39 |
| Total Families | 111 (100.0%) | 2.87 |
Median Household Size in Lyman
The median household size in Lyman is 2.68 persons per household, with single male/father households (11 | 7.6%) accounting for the largest median household size of 4.36 persons per household. non-family households (33 | 22.9%) represent the smallest median household size with 1.30 persons per household.
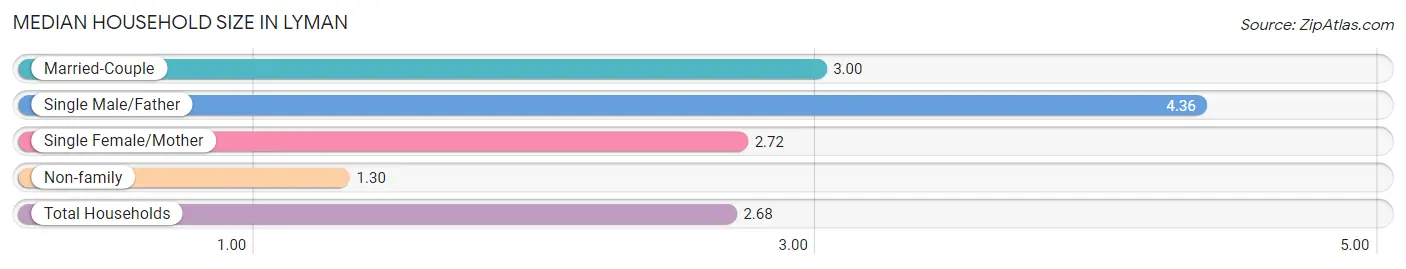
| Household Type | # Households | Household Size |
| Married-Couple | 82 (56.9%) | 3.00 |
| Single Male/Father | 11 (7.6%) | 4.36 |
| Single Female/Mother | 18 (12.5%) | 2.72 |
| Non-family | 33 (22.9%) | 1.30 |
| Total Households | 144 (100.0%) | 2.68 |
Household Size by Marriage Status in Lyman
Out of a total of 144 households in Lyman, 111 (77.1%) are family households, while 33 (22.9%) are nonfamily households. The most numerous type of family households are 2-person households, comprising 46, and the most common type of nonfamily households are 1-person households, comprising 23.
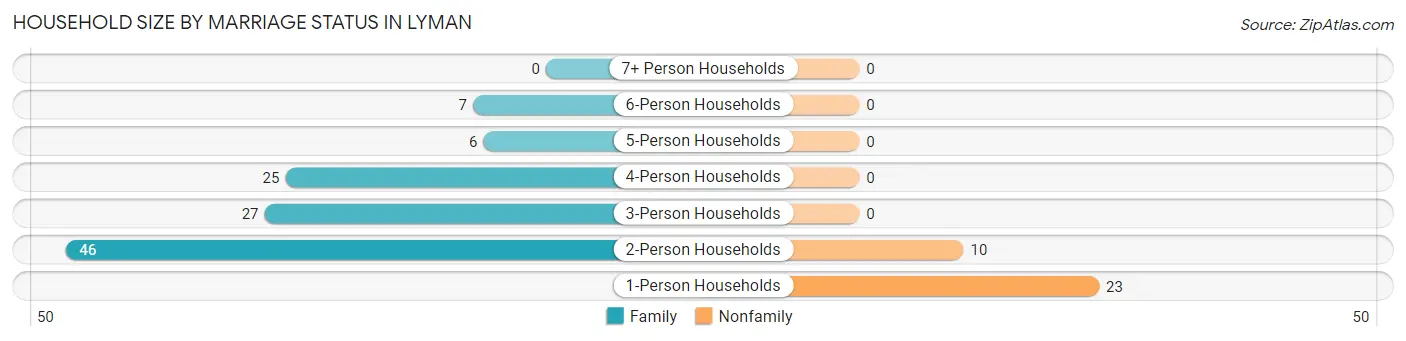
| Household Size | Family Households | Nonfamily Households |
| 1-Person Households | - | 23 (16.0%) |
| 2-Person Households | 46 (31.9%) | 10 (6.9%) |
| 3-Person Households | 27 (18.8%) | 0 (0.0%) |
| 4-Person Households | 25 (17.4%) | 0 (0.0%) |
| 5-Person Households | 6 (4.2%) | 0 (0.0%) |
| 6-Person Households | 7 (4.9%) | 0 (0.0%) |
| 7+ Person Households | 0 (0.0%) | 0 (0.0%) |
| Total | 111 (77.1%) | 33 (22.9%) |
Female Fertility in Lyman
Fertility by Age in Lyman
| Age Bracket | Women with Births | Births / 1,000 Women |
| 15 to 19 years | 0 (0.0%) | 0.0 |
| 20 to 34 years | 0 (0.0%) | 0.0 |
| 35 to 50 years | 0 (0.0%) | 0.0 |
| Total | 0 (0.0%) | 0.0 |
Fertility by Age by Marriage Status in Lyman
| Age Bracket | Married | Unmarried |
| 15 to 19 years | 0 (0.0%) | 0 (0.0%) |
| 20 to 34 years | 0 (0.0%) | 0 (0.0%) |
| 35 to 50 years | 0 (0.0%) | 0 (0.0%) |
| Total | 0 (0.0%) | 0 (0.0%) |
Fertility by Education in Lyman
| Educational Attainment | Women with Births | Births / 1,000 Women |
| Less than High School | 0 (0.0%) | 0.0 |
| High School Diploma | 0 (0.0%) | 0.0 |
| College or Associate's Degree | 0 (0.0%) | 0.0 |
| Bachelor's Degree | 0 (0.0%) | 0.0 |
| Graduate Degree | 0 (0.0%) | 0.0 |
| Total | 0 (0.0%) | 0.0 |
Fertility by Education by Marriage Status in Lyman
| Educational Attainment | Married | Unmarried |
| Less than High School | 0 (0.0%) | 0 (0.0%) |
| High School Diploma | 0 (0.0%) | 0 (0.0%) |
| College or Associate's Degree | 0 (0.0%) | 0 (0.0%) |
| Bachelor's Degree | 0 (0.0%) | 0 (0.0%) |
| Graduate Degree | 0 (0.0%) | 0 (0.0%) |
| Total | 0 (0.0%) | 0 (0.0%) |
Employment Characteristics in Lyman
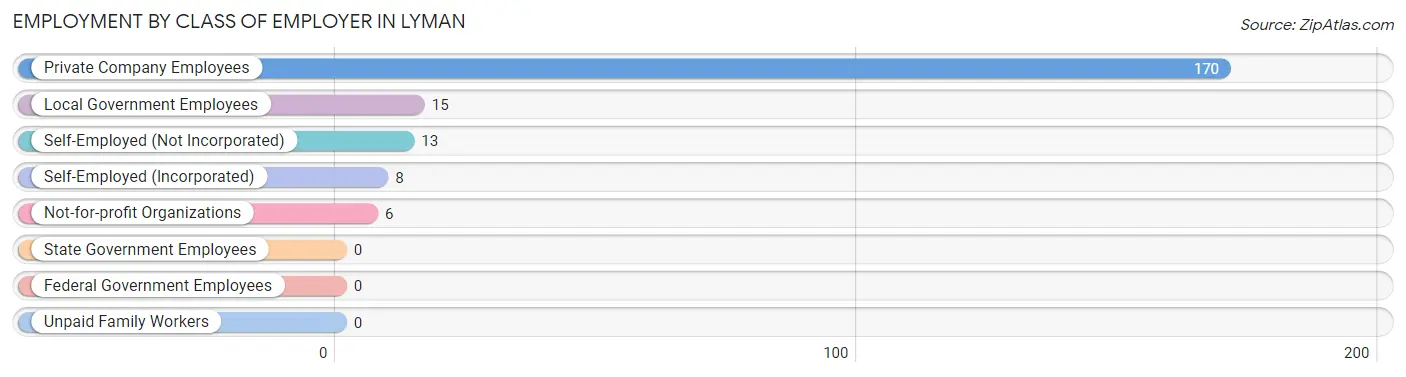
Employment by Class of Employer in Lyman
Among the 212 employed individuals in Lyman, private company employees (170 | 80.2%), local government employees (15 | 7.1%), and self-employed (not incorporated) (13 | 6.1%) make up the most common classes of employment.
| Employer Class | # Employees | % Employees |
| Private Company Employees | 170 | 80.2% |
| Self-Employed (Incorporated) | 8 | 3.8% |
| Self-Employed (Not Incorporated) | 13 | 6.1% |
| Not-for-profit Organizations | 6 | 2.8% |
| Local Government Employees | 15 | 7.1% |
| State Government Employees | 0 | 0.0% |
| Federal Government Employees | 0 | 0.0% |
| Unpaid Family Workers | 0 | 0.0% |
| Total | 212 | 100.0% |
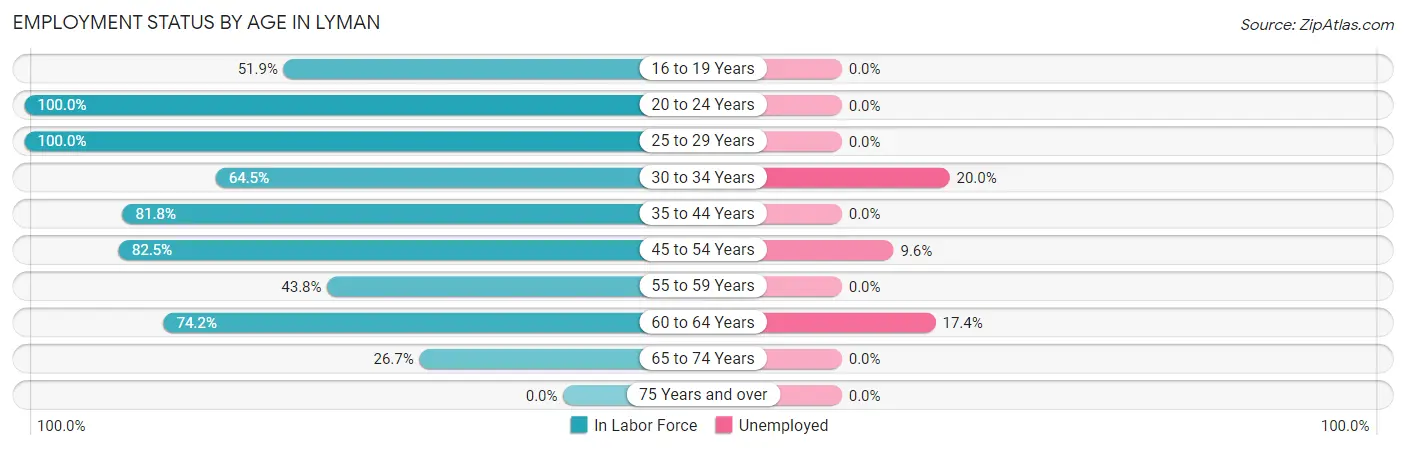
Employment Status by Age in Lyman
According to the labor force statistics for Lyman, out of the total population over 16 years of age (310), 72.6% or 225 individuals are in the labor force, with 5.8% or 13 of them unemployed. The age group with the highest labor force participation rate is 20 to 24 years, with 100.0% or 27 individuals in the labor force. Within the labor force, the 30 to 34 years age range has the highest percentage of unemployed individuals, with 20.0% or 4 of them being unemployed.
| Age Bracket | In Labor Force | Unemployed |
| 16 to 19 Years | 14 (51.9%) | 0 (0.0%) |
| 20 to 24 Years | 27 (100.0%) | 0 (0.0%) |
| 25 to 29 Years | 24 (100.0%) | 0 (0.0%) |
| 30 to 34 Years | 20 (64.5%) | 4 (20.0%) |
| 35 to 44 Years | 54 (81.8%) | 0 (0.0%) |
| 45 to 54 Years | 52 (82.5%) | 5 (9.6%) |
| 55 to 59 Years | 7 (43.8%) | 0 (0.0%) |
| 60 to 64 Years | 23 (74.2%) | 4 (17.4%) |
| 65 to 74 Years | 4 (26.7%) | 0 (0.0%) |
| 75 Years and over | 0 (0.0%) | 0 (0.0%) |
| Total | 225 (72.6%) | 13 (5.8%) |
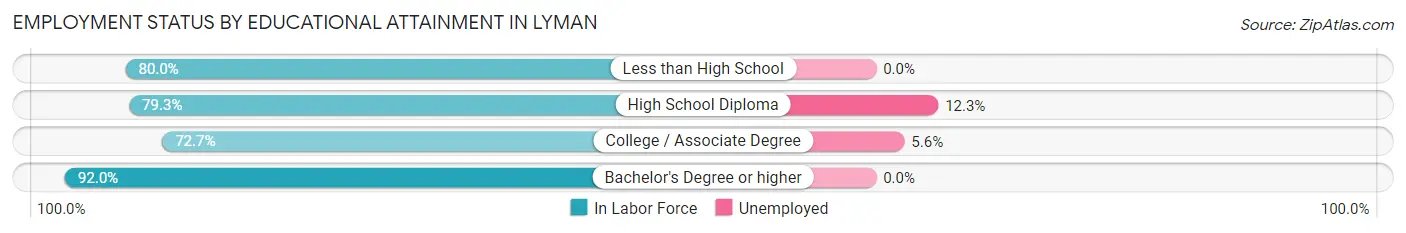
Employment Status by Educational Attainment in Lyman
According to labor force statistics for Lyman, 77.9% of individuals (180) out of the total population between 25 and 64 years of age (231) are in the labor force, with 7.2% or 13 of them being unemployed. The group with the highest labor force participation rate are those with the educational attainment of bachelor's degree or higher, with 92.0% or 23 individuals in the labor force. Within the labor force, individuals with high school diploma education have the highest percentage of unemployment, with 12.3% or 9 of them being unemployed.
| Educational Attainment | In Labor Force | Unemployed |
| Less than High School | 12 (80.0%) | 0 (0.0%) |
| High School Diploma | 73 (79.3%) | 11 (12.3%) |
| College / Associate Degree | 72 (72.7%) | 6 (5.6%) |
| Bachelor's Degree or higher | 23 (92.0%) | 0 (0.0%) |
| Total | 180 (77.9%) | 17 (7.2%) |
Employment Occupations by Sex in Lyman
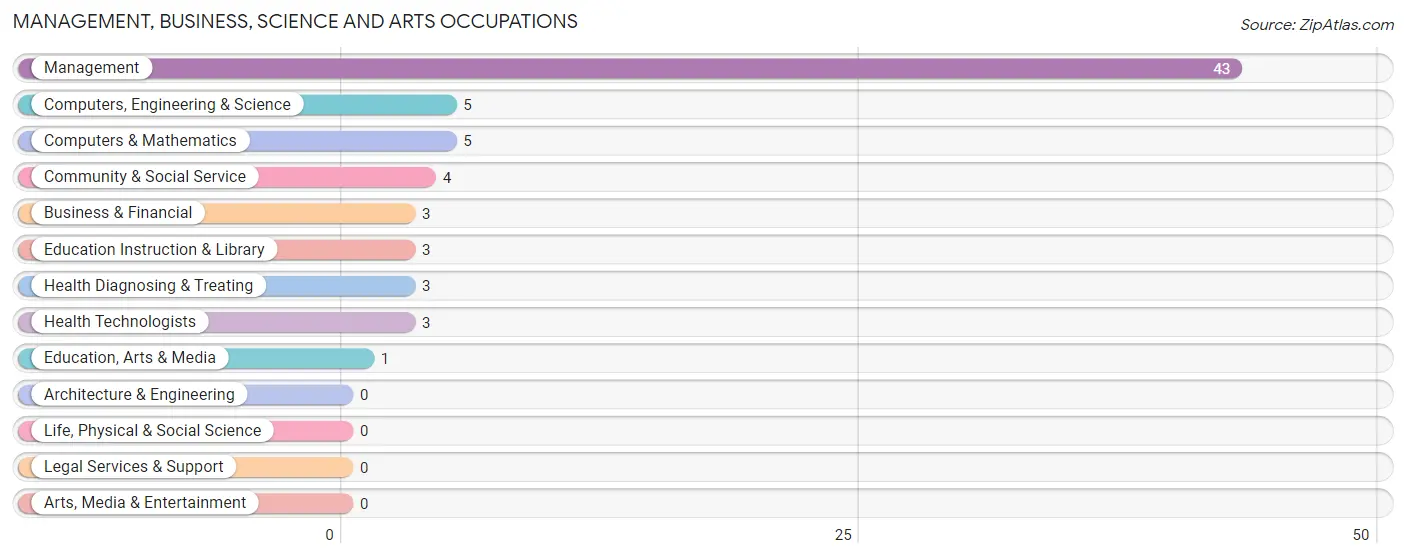
Management, Business, Science and Arts Occupations
The most common Management, Business, Science and Arts occupations in Lyman are Management (43 | 20.3%), Computers, Engineering & Science (5 | 2.4%), Computers & Mathematics (5 | 2.4%), Community & Social Service (4 | 1.9%), and Business & Financial (3 | 1.4%).
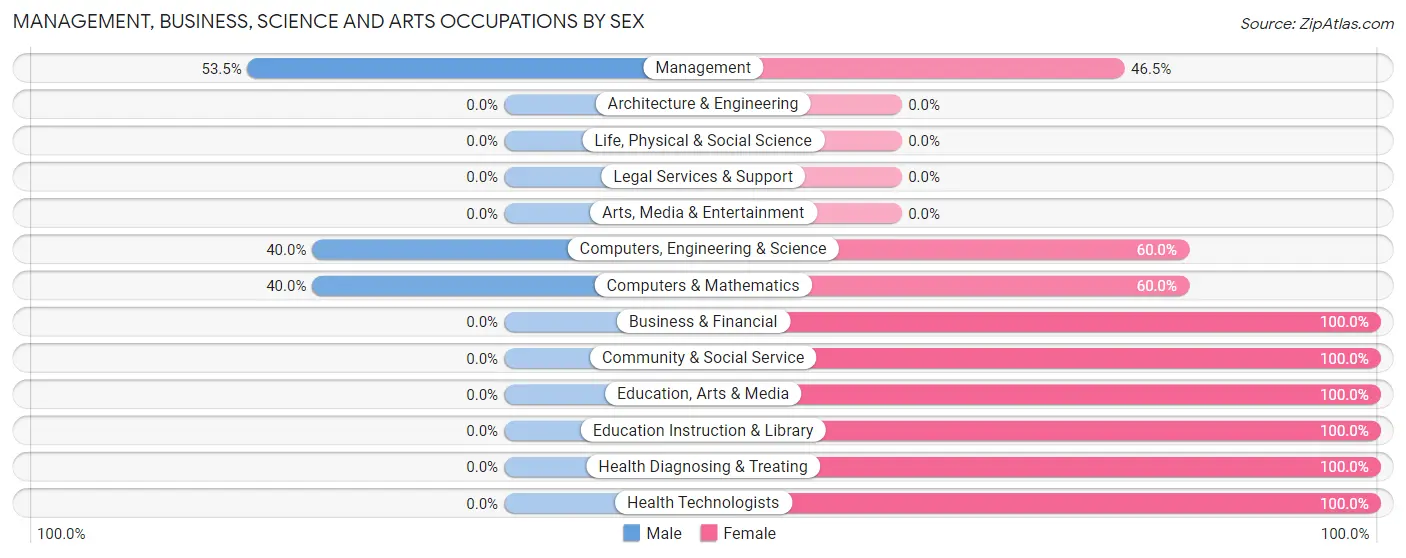
Management, Business, Science and Arts Occupations by Sex
Within the Management, Business, Science and Arts occupations in Lyman, the most male-oriented occupations are Management (53.5%), Computers, Engineering & Science (40.0%), and Computers & Mathematics (40.0%), while the most female-oriented occupations are Business & Financial (100.0%), Community & Social Service (100.0%), and Education, Arts & Media (100.0%).
| Occupation | Male | Female |
| Management | 23 (53.5%) | 20 (46.5%) |
| Business & Financial | 0 (0.0%) | 3 (100.0%) |
| Computers, Engineering & Science | 2 (40.0%) | 3 (60.0%) |
| Computers & Mathematics | 2 (40.0%) | 3 (60.0%) |
| Architecture & Engineering | 0 (0.0%) | 0 (0.0%) |
| Life, Physical & Social Science | 0 (0.0%) | 0 (0.0%) |
| Community & Social Service | 0 (0.0%) | 4 (100.0%) |
| Education, Arts & Media | 0 (0.0%) | 1 (100.0%) |
| Legal Services & Support | 0 (0.0%) | 0 (0.0%) |
| Education Instruction & Library | 0 (0.0%) | 3 (100.0%) |
| Arts, Media & Entertainment | 0 (0.0%) | 0 (0.0%) |
| Health Diagnosing & Treating | 0 (0.0%) | 3 (100.0%) |
| Health Technologists | 0 (0.0%) | 3 (100.0%) |
| Total (Category) | 25 (43.1%) | 33 (56.9%) |
| Total (Overall) | 116 (54.7%) | 96 (45.3%) |
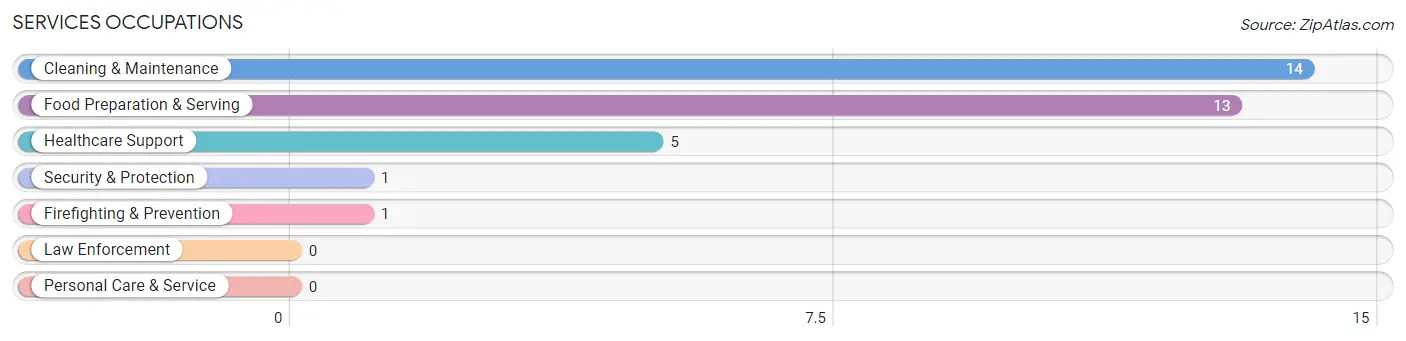
Services Occupations
The most common Services occupations in Lyman are Cleaning & Maintenance (14 | 6.6%), Food Preparation & Serving (13 | 6.1%), Healthcare Support (5 | 2.4%), Security & Protection (1 | 0.5%), and Firefighting & Prevention (1 | 0.5%).
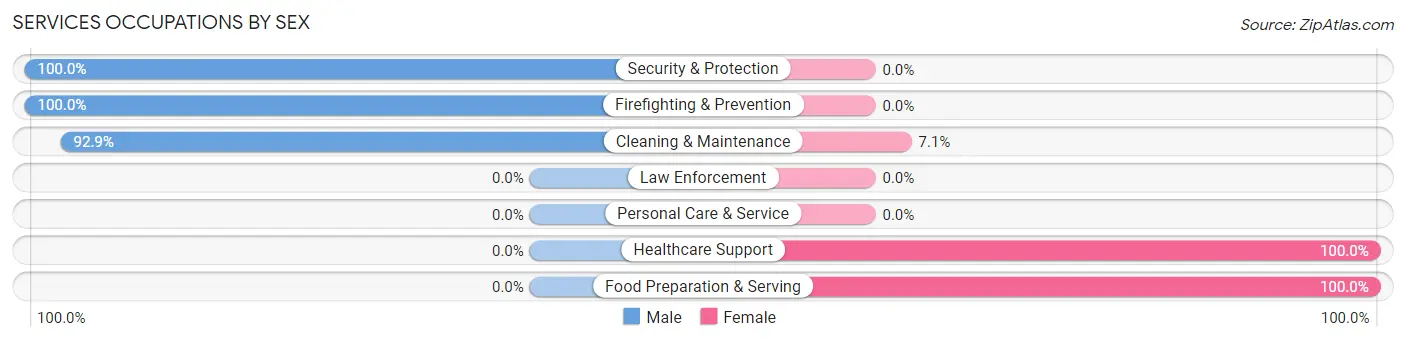
Services Occupations by Sex
Within the Services occupations in Lyman, the most male-oriented occupations are Security & Protection (100.0%), Firefighting & Prevention (100.0%), and Cleaning & Maintenance (92.9%), while the most female-oriented occupations are Healthcare Support (100.0%), Food Preparation & Serving (100.0%), and Cleaning & Maintenance (7.1%).
| Occupation | Male | Female |
| Healthcare Support | 0 (0.0%) | 5 (100.0%) |
| Security & Protection | 1 (100.0%) | 0 (0.0%) |
| Firefighting & Prevention | 1 (100.0%) | 0 (0.0%) |
| Law Enforcement | 0 (0.0%) | 0 (0.0%) |
| Food Preparation & Serving | 0 (0.0%) | 13 (100.0%) |
| Cleaning & Maintenance | 13 (92.9%) | 1 (7.1%) |
| Personal Care & Service | 0 (0.0%) | 0 (0.0%) |
| Total (Category) | 14 (42.4%) | 19 (57.6%) |
| Total (Overall) | 116 (54.7%) | 96 (45.3%) |
Sales and Office Occupations
The most common Sales and Office occupations in Lyman are Sales & Related (21 | 9.9%), and Office & Administration (10 | 4.7%).
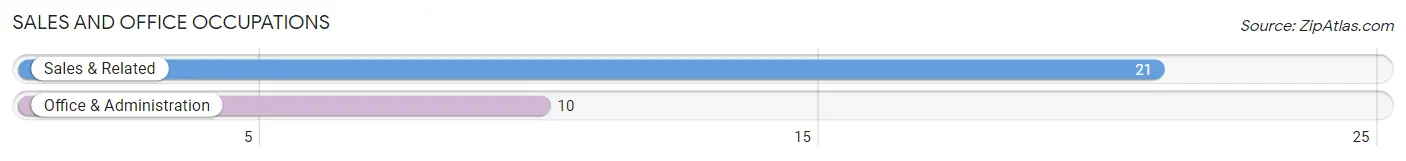
Sales and Office Occupations by Sex
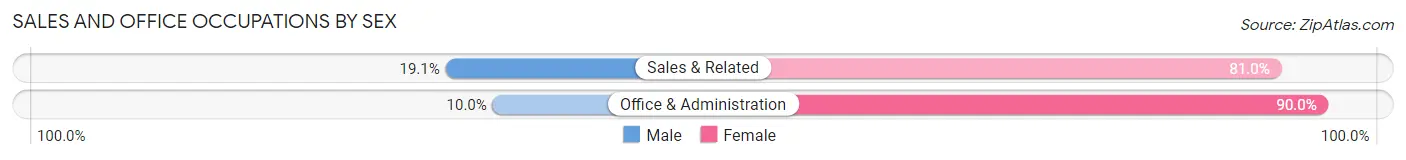
| Occupation | Male | Female |
| Sales & Related | 4 (19.1%) | 17 (80.9%) |
| Office & Administration | 1 (10.0%) | 9 (90.0%) |
| Total (Category) | 5 (16.1%) | 26 (83.9%) |
| Total (Overall) | 116 (54.7%) | 96 (45.3%) |
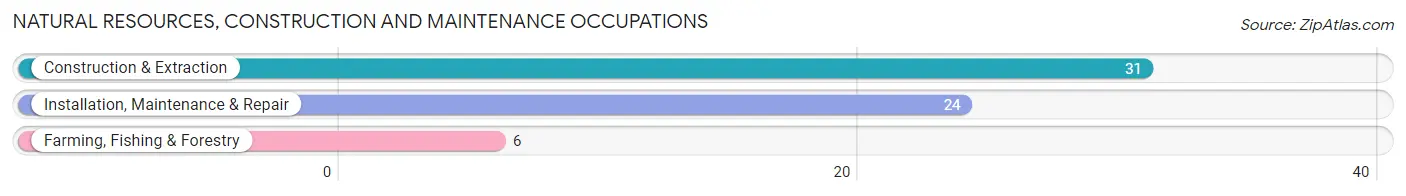
Natural Resources, Construction and Maintenance Occupations
The most common Natural Resources, Construction and Maintenance occupations in Lyman are Construction & Extraction (31 | 14.6%), Installation, Maintenance & Repair (24 | 11.3%), and Farming, Fishing & Forestry (6 | 2.8%).
Natural Resources, Construction and Maintenance Occupations by Sex
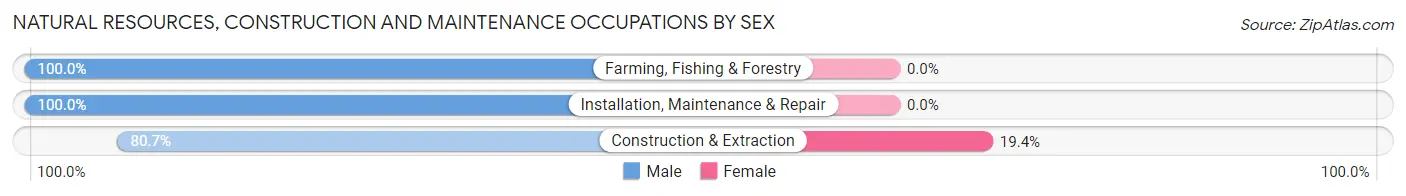
| Occupation | Male | Female |
| Farming, Fishing & Forestry | 6 (100.0%) | 0 (0.0%) |
| Construction & Extraction | 25 (80.6%) | 6 (19.4%) |
| Installation, Maintenance & Repair | 24 (100.0%) | 0 (0.0%) |
| Total (Category) | 55 (90.2%) | 6 (9.8%) |
| Total (Overall) | 116 (54.7%) | 96 (45.3%) |
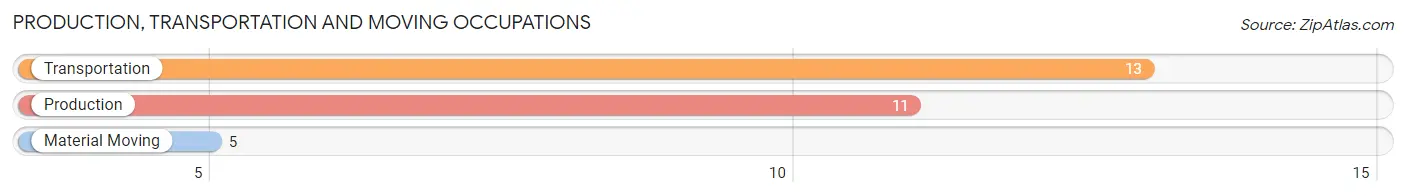
Production, Transportation and Moving Occupations
The most common Production, Transportation and Moving occupations in Lyman are Transportation (13 | 6.1%), Production (11 | 5.2%), and Material Moving (5 | 2.4%).
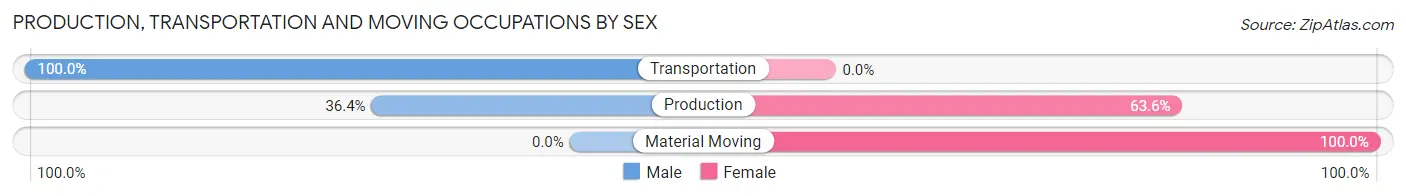
Production, Transportation and Moving Occupations by Sex
| Occupation | Male | Female |
| Production | 4 (36.4%) | 7 (63.6%) |
| Transportation | 13 (100.0%) | 0 (0.0%) |
| Material Moving | 0 (0.0%) | 5 (100.0%) |
| Total (Category) | 17 (58.6%) | 12 (41.4%) |
| Total (Overall) | 116 (54.7%) | 96 (45.3%) |
Employment Industries by Sex in Lyman
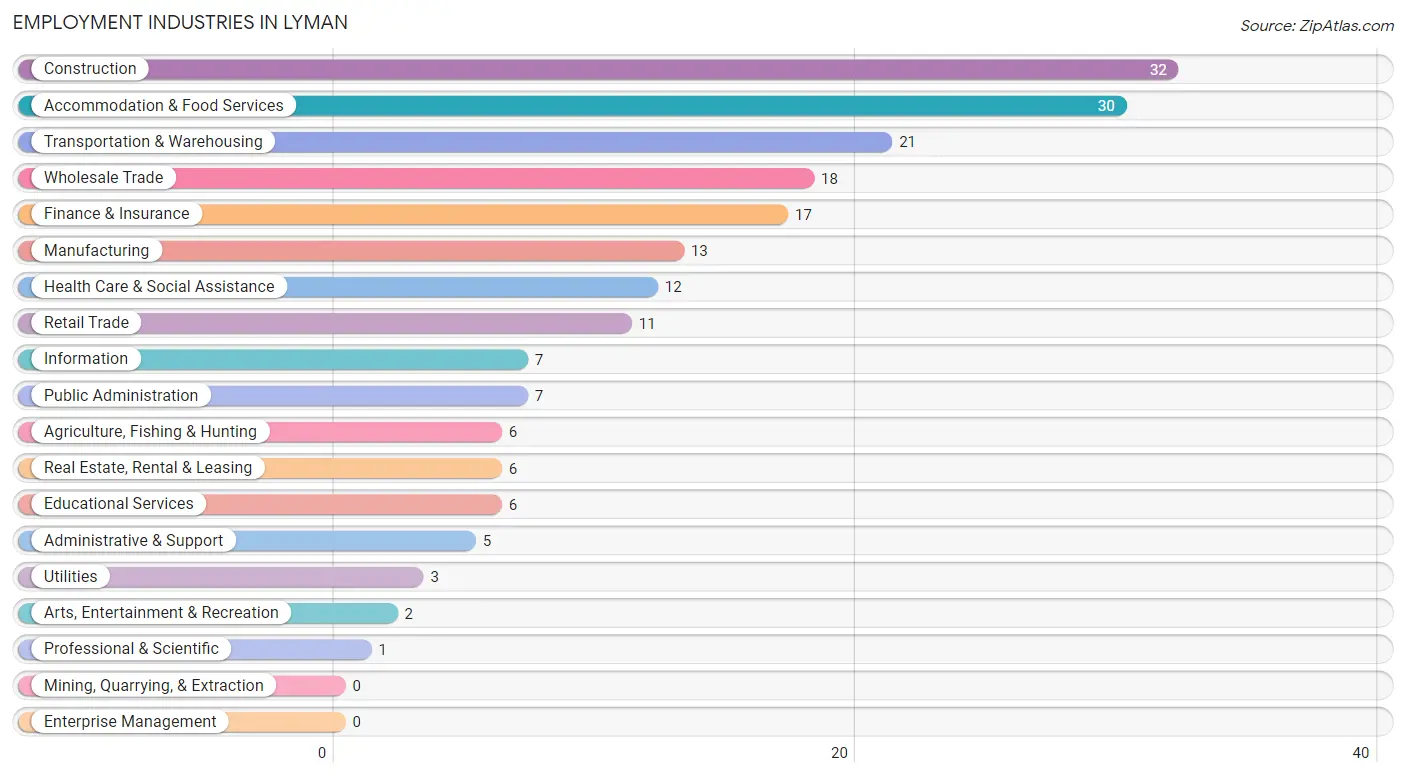
Employment Industries in Lyman
The major employment industries in Lyman include Construction (32 | 15.1%), Accommodation & Food Services (30 | 14.1%), Transportation & Warehousing (21 | 9.9%), Wholesale Trade (18 | 8.5%), and Finance & Insurance (17 | 8.0%).
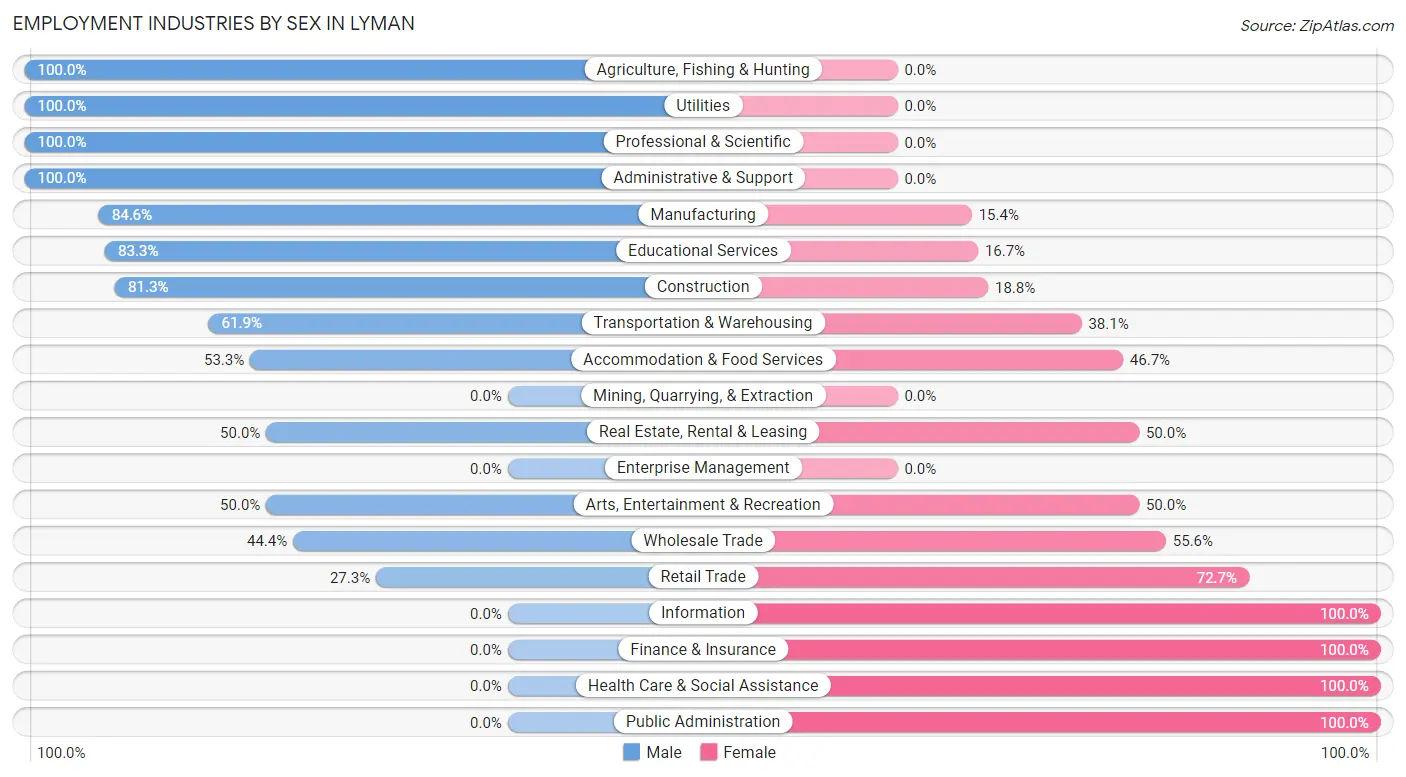
Employment Industries by Sex in Lyman
The Lyman industries that see more men than women are Agriculture, Fishing & Hunting (100.0%), Utilities (100.0%), and Professional & Scientific (100.0%), whereas the industries that tend to have a higher number of women are Information (100.0%), Finance & Insurance (100.0%), and Health Care & Social Assistance (100.0%).
| Industry | Male | Female |
| Agriculture, Fishing & Hunting | 6 (100.0%) | 0 (0.0%) |
| Mining, Quarrying, & Extraction | 0 (0.0%) | 0 (0.0%) |
| Construction | 26 (81.2%) | 6 (18.8%) |
| Manufacturing | 11 (84.6%) | 2 (15.4%) |
| Wholesale Trade | 8 (44.4%) | 10 (55.6%) |
| Retail Trade | 3 (27.3%) | 8 (72.7%) |
| Transportation & Warehousing | 13 (61.9%) | 8 (38.1%) |
| Utilities | 3 (100.0%) | 0 (0.0%) |
| Information | 0 (0.0%) | 7 (100.0%) |
| Finance & Insurance | 0 (0.0%) | 17 (100.0%) |
| Real Estate, Rental & Leasing | 3 (50.0%) | 3 (50.0%) |
| Professional & Scientific | 1 (100.0%) | 0 (0.0%) |
| Enterprise Management | 0 (0.0%) | 0 (0.0%) |
| Administrative & Support | 5 (100.0%) | 0 (0.0%) |
| Educational Services | 5 (83.3%) | 1 (16.7%) |
| Health Care & Social Assistance | 0 (0.0%) | 12 (100.0%) |
| Arts, Entertainment & Recreation | 1 (50.0%) | 1 (50.0%) |
| Accommodation & Food Services | 16 (53.3%) | 14 (46.7%) |
| Public Administration | 0 (0.0%) | 7 (100.0%) |
| Total | 116 (54.7%) | 96 (45.3%) |
Education in Lyman
School Enrollment in Lyman
The most common levels of schooling among the 85 students in Lyman are high school (28 | 32.9%), middle school (26 | 30.6%), and elementary school (24 | 28.2%).
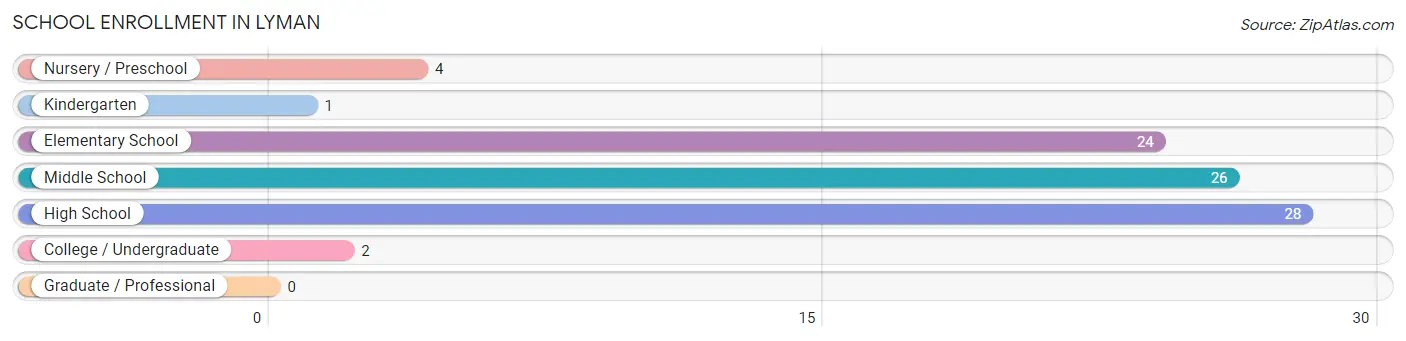
| School Level | # Students | % Students |
| Nursery / Preschool | 4 | 4.7% |
| Kindergarten | 1 | 1.2% |
| Elementary School | 24 | 28.2% |
| Middle School | 26 | 30.6% |
| High School | 28 | 32.9% |
| College / Undergraduate | 2 | 2.4% |
| Graduate / Professional | 0 | 0.0% |
| Total | 85 | 100.0% |
School Enrollment by Age by Funding Source in Lyman
Out of a total of 85 students who are enrolled in schools in Lyman, 5 (5.9%) attend a private institution, while the remaining 80 (94.1%) are enrolled in public schools. The age group of 5 to 9 year old has the highest likelihood of being enrolled in private schools, with 5 (26.3% in the age bracket) enrolled. Conversely, the age group of 3 to 4 year olds has the lowest likelihood of being enrolled in a private school, with 4 (100.0% in the age bracket) attending a public institution.
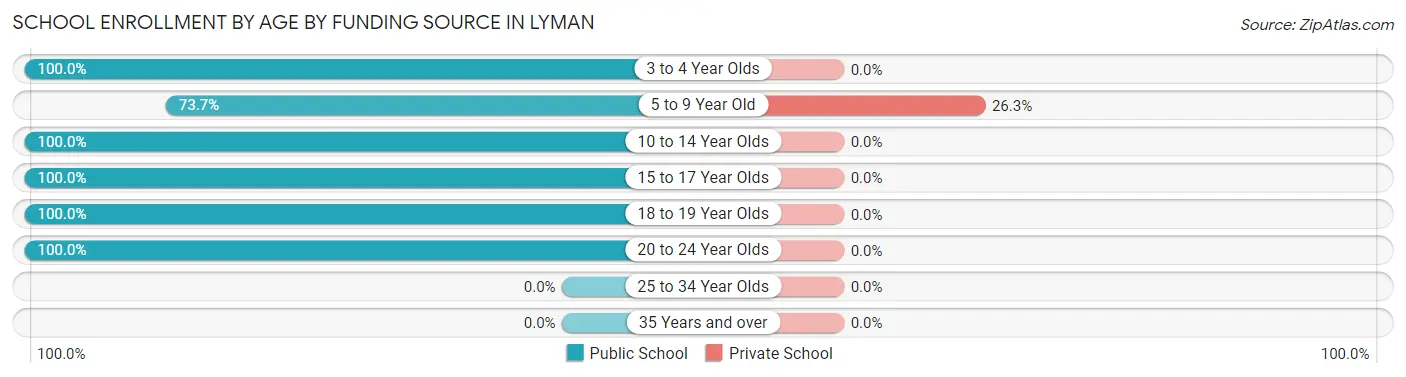
| Age Bracket | Public School | Private School |
| 3 to 4 Year Olds | 4 (100.0%) | 0 (0.0%) |
| 5 to 9 Year Old | 14 (73.7%) | 5 (26.3%) |
| 10 to 14 Year Olds | 32 (100.0%) | 0 (0.0%) |
| 15 to 17 Year Olds | 15 (100.0%) | 0 (0.0%) |
| 18 to 19 Year Olds | 13 (100.0%) | 0 (0.0%) |
| 20 to 24 Year Olds | 2 (100.0%) | 0 (0.0%) |
| 25 to 34 Year Olds | 0 (0.0%) | 0 (0.0%) |
| 35 Years and over | 0 (0.0%) | 0 (0.0%) |
| Total | 80 (94.1%) | 5 (5.9%) |
Educational Attainment by Field of Study in Lyman
Business (11 | 40.7%), psychology (6 | 22.2%), physical & health sciences (3 | 11.1%), literature & languages (3 | 11.1%), and social sciences (2 | 7.4%) are the most common fields of study among 27 individuals in Lyman who have obtained a bachelor's degree or higher.
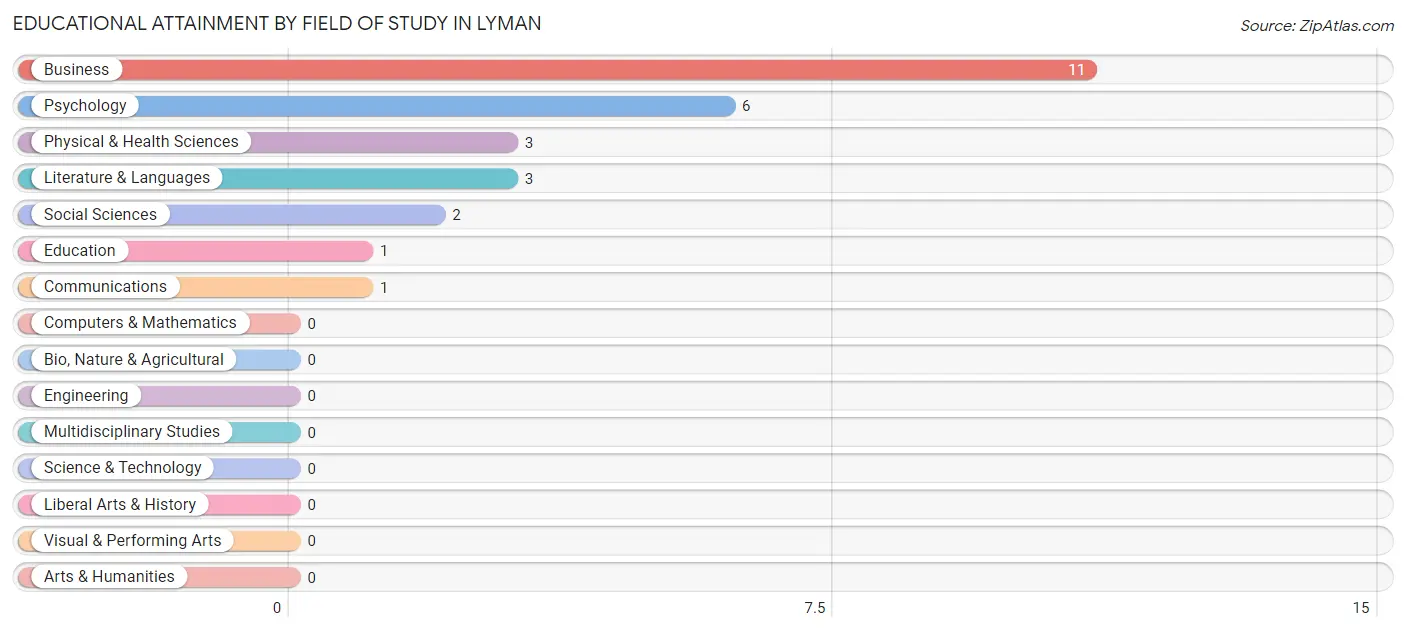
| Field of Study | # Graduates | % Graduates |
| Computers & Mathematics | 0 | 0.0% |
| Bio, Nature & Agricultural | 0 | 0.0% |
| Physical & Health Sciences | 3 | 11.1% |
| Psychology | 6 | 22.2% |
| Social Sciences | 2 | 7.4% |
| Engineering | 0 | 0.0% |
| Multidisciplinary Studies | 0 | 0.0% |
| Science & Technology | 0 | 0.0% |
| Business | 11 | 40.7% |
| Education | 1 | 3.7% |
| Literature & Languages | 3 | 11.1% |
| Liberal Arts & History | 0 | 0.0% |
| Visual & Performing Arts | 0 | 0.0% |
| Communications | 1 | 3.7% |
| Arts & Humanities | 0 | 0.0% |
| Total | 27 | 100.0% |
Transportation & Commute in Lyman
Vehicle Availability by Sex in Lyman
The most prevalent vehicle ownership categories in Lyman are males with 2 vehicles (61, accounting for 52.6%) and females with 2 vehicles (40, making up 63.5%).
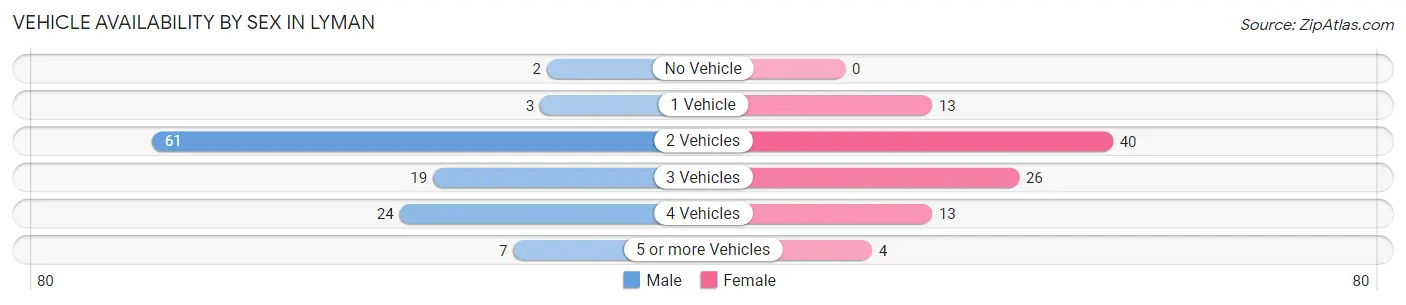
| Vehicles Available | Male | Female |
| No Vehicle | 2 (1.7%) | 0 (0.0%) |
| 1 Vehicle | 3 (2.6%) | 13 (13.5%) |
| 2 Vehicles | 61 (52.6%) | 40 (41.7%) |
| 3 Vehicles | 19 (16.4%) | 26 (27.1%) |
| 4 Vehicles | 24 (20.7%) | 13 (13.5%) |
| 5 or more Vehicles | 7 (6.0%) | 4 (4.2%) |
| Total | 116 (100.0%) | 96 (100.0%) |
Commute Time in Lyman
The most frequently occuring commute durations in Lyman are 20 to 24 minutes (34 commuters, 17.3%), 60 to 89 minutes (26 commuters, 13.2%), and 30 to 34 minutes (25 commuters, 12.7%).
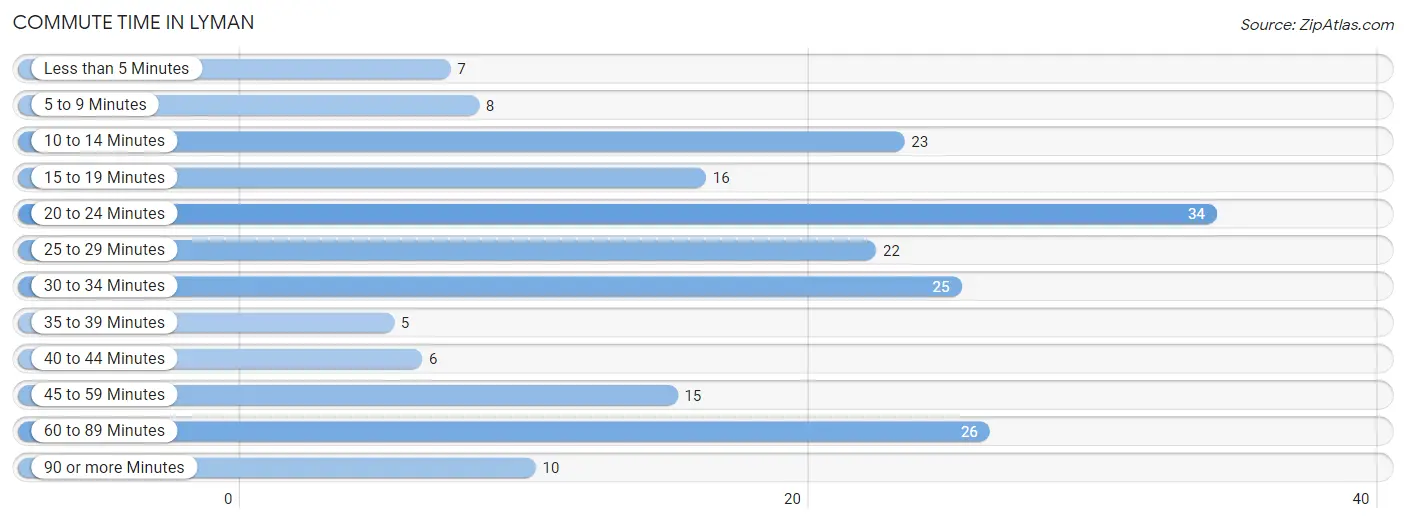
| Commute Time | # Commuters | % Commuters |
| Less than 5 Minutes | 7 | 3.5% |
| 5 to 9 Minutes | 8 | 4.1% |
| 10 to 14 Minutes | 23 | 11.7% |
| 15 to 19 Minutes | 16 | 8.1% |
| 20 to 24 Minutes | 34 | 17.3% |
| 25 to 29 Minutes | 22 | 11.2% |
| 30 to 34 Minutes | 25 | 12.7% |
| 35 to 39 Minutes | 5 | 2.5% |
| 40 to 44 Minutes | 6 | 3.0% |
| 45 to 59 Minutes | 15 | 7.6% |
| 60 to 89 Minutes | 26 | 13.2% |
| 90 or more Minutes | 10 | 5.1% |
Commute Time by Sex in Lyman
The most common commute times in Lyman are 20 to 24 minutes (32 commuters, 27.8%) for males and 30 to 34 minutes (23 commuters, 28.1%) for females.
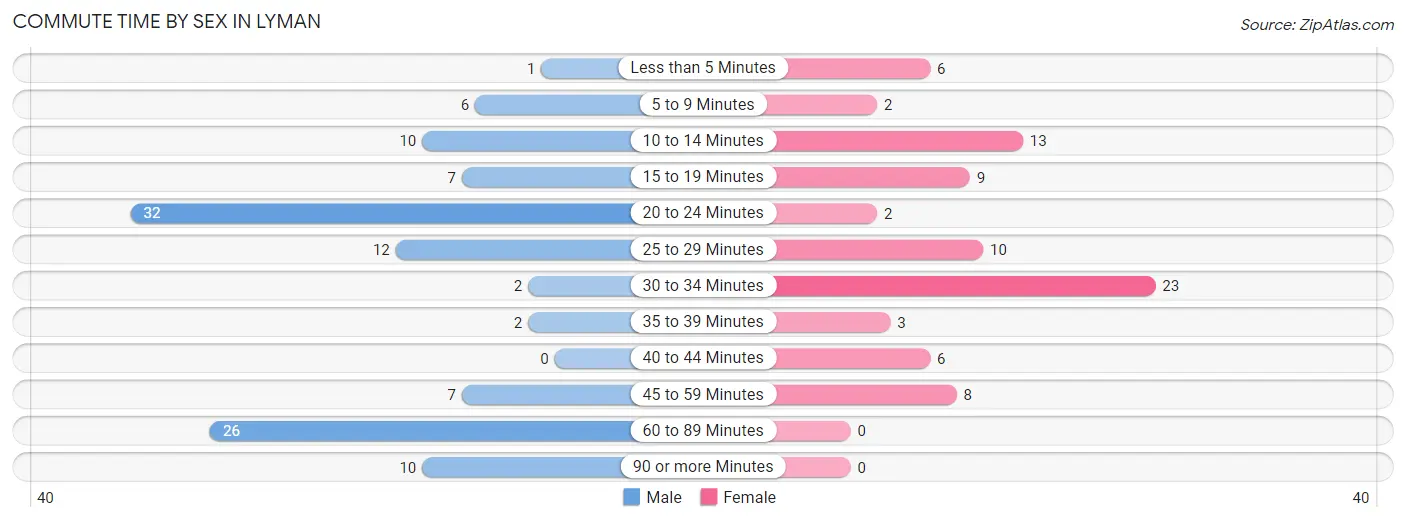
| Commute Time | Male | Female |
| Less than 5 Minutes | 1 (0.9%) | 6 (7.3%) |
| 5 to 9 Minutes | 6 (5.2%) | 2 (2.4%) |
| 10 to 14 Minutes | 10 (8.7%) | 13 (15.9%) |
| 15 to 19 Minutes | 7 (6.1%) | 9 (11.0%) |
| 20 to 24 Minutes | 32 (27.8%) | 2 (2.4%) |
| 25 to 29 Minutes | 12 (10.4%) | 10 (12.2%) |
| 30 to 34 Minutes | 2 (1.7%) | 23 (28.1%) |
| 35 to 39 Minutes | 2 (1.7%) | 3 (3.7%) |
| 40 to 44 Minutes | 0 (0.0%) | 6 (7.3%) |
| 45 to 59 Minutes | 7 (6.1%) | 8 (9.8%) |
| 60 to 89 Minutes | 26 (22.6%) | 0 (0.0%) |
| 90 or more Minutes | 10 (8.7%) | 0 (0.0%) |
Time of Departure to Work by Sex in Lyman
The most frequent times of departure to work in Lyman are 7:00 AM to 7:29 AM (34, 29.6%) for males and 8:00 AM to 8:29 AM (23, 28.1%) for females.
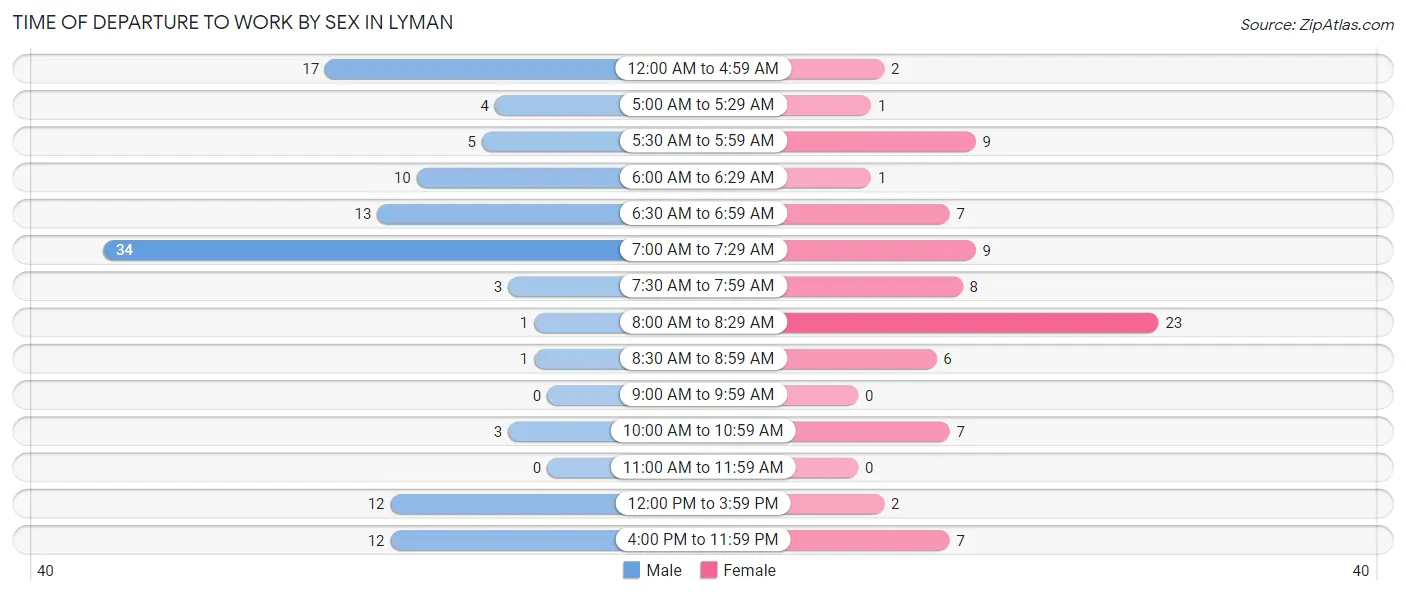
| Time of Departure | Male | Female |
| 12:00 AM to 4:59 AM | 17 (14.8%) | 2 (2.4%) |
| 5:00 AM to 5:29 AM | 4 (3.5%) | 1 (1.2%) |
| 5:30 AM to 5:59 AM | 5 (4.3%) | 9 (11.0%) |
| 6:00 AM to 6:29 AM | 10 (8.7%) | 1 (1.2%) |
| 6:30 AM to 6:59 AM | 13 (11.3%) | 7 (8.5%) |
| 7:00 AM to 7:29 AM | 34 (29.6%) | 9 (11.0%) |
| 7:30 AM to 7:59 AM | 3 (2.6%) | 8 (9.8%) |
| 8:00 AM to 8:29 AM | 1 (0.9%) | 23 (28.1%) |
| 8:30 AM to 8:59 AM | 1 (0.9%) | 6 (7.3%) |
| 9:00 AM to 9:59 AM | 0 (0.0%) | 0 (0.0%) |
| 10:00 AM to 10:59 AM | 3 (2.6%) | 7 (8.5%) |
| 11:00 AM to 11:59 AM | 0 (0.0%) | 0 (0.0%) |
| 12:00 PM to 3:59 PM | 12 (10.4%) | 2 (2.4%) |
| 4:00 PM to 11:59 PM | 12 (10.4%) | 7 (8.5%) |
| Total | 115 (100.0%) | 82 (100.0%) |
Housing Occupancy in Lyman
Occupancy by Ownership in Lyman
Of the total 144 dwellings in Lyman, owner-occupied units account for 121 (84.0%), while renter-occupied units make up 23 (16.0%).
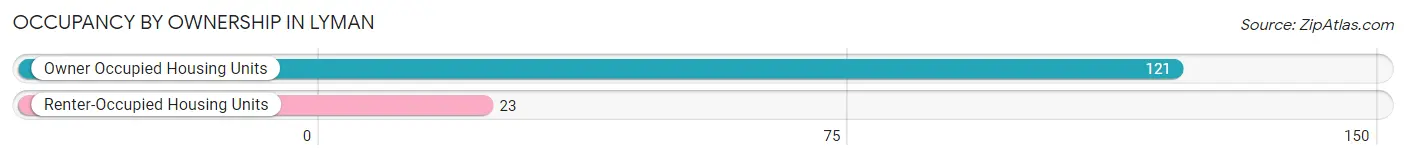
| Occupancy | # Housing Units | % Housing Units |
| Owner Occupied Housing Units | 121 | 84.0% |
| Renter-Occupied Housing Units | 23 | 16.0% |
| Total Occupied Housing Units | 144 | 100.0% |
Occupancy by Household Size in Lyman
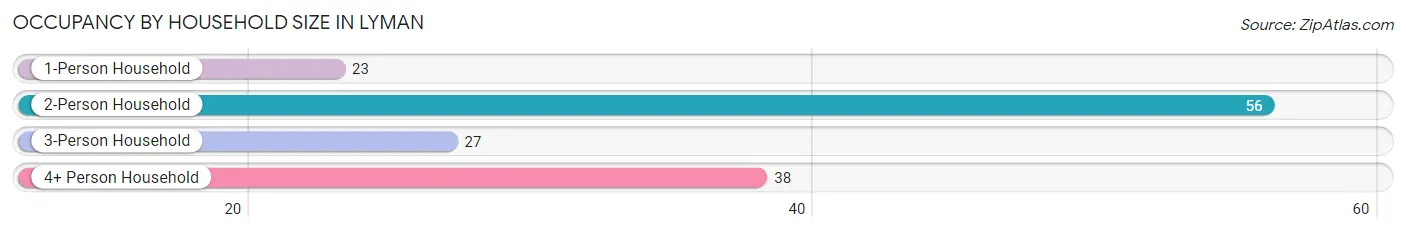
| Household Size | # Housing Units | % Housing Units |
| 1-Person Household | 23 | 16.0% |
| 2-Person Household | 56 | 38.9% |
| 3-Person Household | 27 | 18.8% |
| 4+ Person Household | 38 | 26.4% |
| Total Housing Units | 144 | 100.0% |
Occupancy by Ownership by Household Size in Lyman
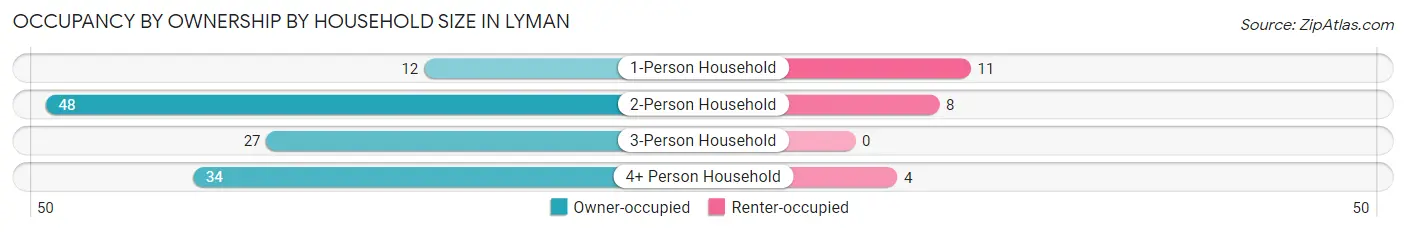
| Household Size | Owner-occupied | Renter-occupied |
| 1-Person Household | 12 (52.2%) | 11 (47.8%) |
| 2-Person Household | 48 (85.7%) | 8 (14.3%) |
| 3-Person Household | 27 (100.0%) | 0 (0.0%) |
| 4+ Person Household | 34 (89.5%) | 4 (10.5%) |
| Total Housing Units | 121 (84.0%) | 23 (16.0%) |
Occupancy by Educational Attainment in Lyman
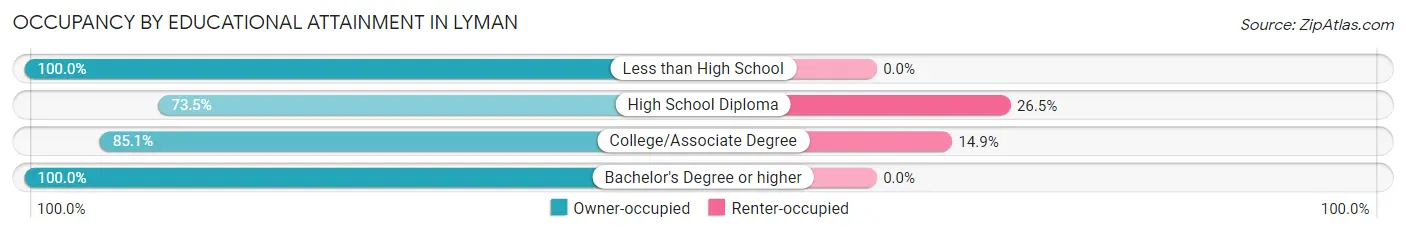
| Household Size | Owner-occupied | Renter-occupied |
| Less than High School | 13 (100.0%) | 0 (0.0%) |
| High School Diploma | 36 (73.5%) | 13 (26.5%) |
| College/Associate Degree | 57 (85.1%) | 10 (14.9%) |
| Bachelor's Degree or higher | 15 (100.0%) | 0 (0.0%) |
Occupancy by Age of Householder in Lyman
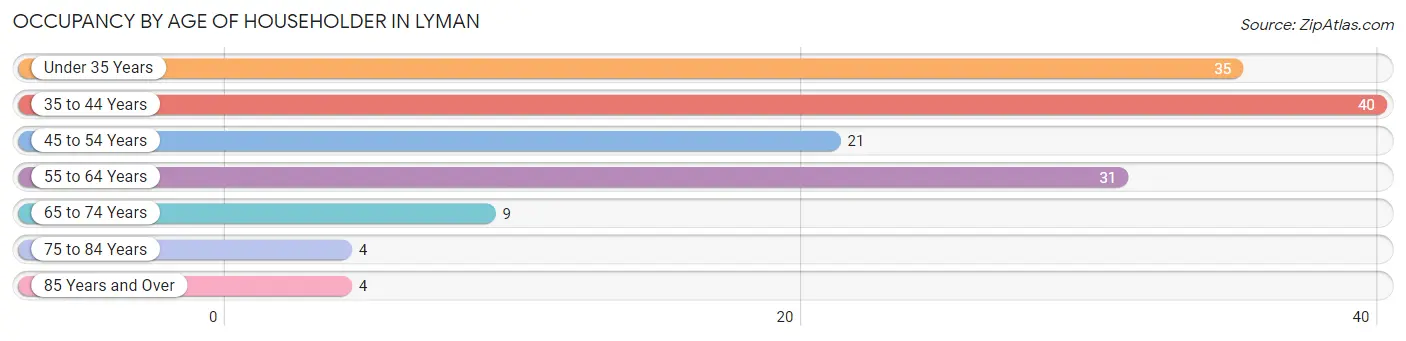
| Age Bracket | # Households | % Households |
| Under 35 Years | 35 | 24.3% |
| 35 to 44 Years | 40 | 27.8% |
| 45 to 54 Years | 21 | 14.6% |
| 55 to 64 Years | 31 | 21.5% |
| 65 to 74 Years | 9 | 6.2% |
| 75 to 84 Years | 4 | 2.8% |
| 85 Years and Over | 4 | 2.8% |
| Total | 144 | 100.0% |
Housing Finances in Lyman
Median Income by Occupancy in Lyman
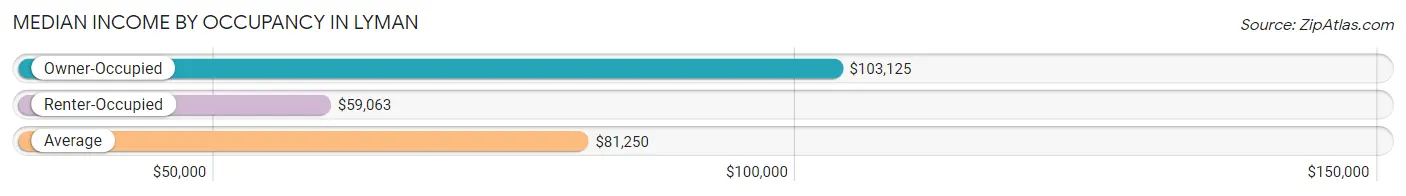
| Occupancy Type | # Households | Median Income |
| Owner-Occupied | 121 (84.0%) | $103,125 |
| Renter-Occupied | 23 (16.0%) | $59,063 |
| Average | 144 (100.0%) | $81,250 |
Occupancy by Householder Income Bracket in Lyman
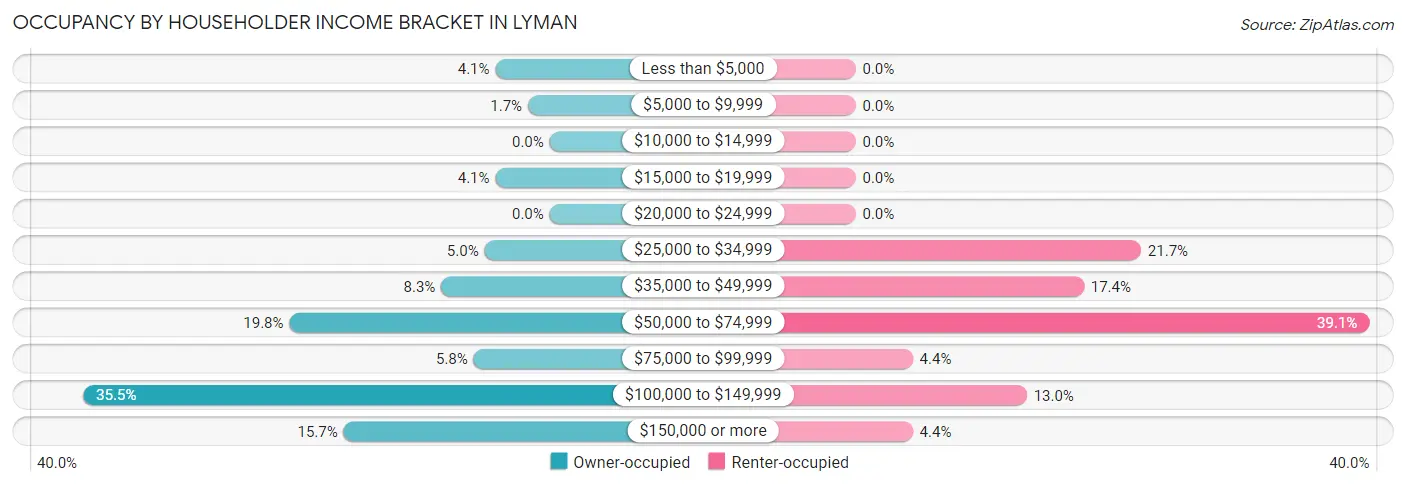
| Income Bracket | Owner-occupied | Renter-occupied |
| Less than $5,000 | 5 (4.1%) | 0 (0.0%) |
| $5,000 to $9,999 | 2 (1.7%) | 0 (0.0%) |
| $10,000 to $14,999 | 0 (0.0%) | 0 (0.0%) |
| $15,000 to $19,999 | 5 (4.1%) | 0 (0.0%) |
| $20,000 to $24,999 | 0 (0.0%) | 0 (0.0%) |
| $25,000 to $34,999 | 6 (5.0%) | 5 (21.7%) |
| $35,000 to $49,999 | 10 (8.3%) | 4 (17.4%) |
| $50,000 to $74,999 | 24 (19.8%) | 9 (39.1%) |
| $75,000 to $99,999 | 7 (5.8%) | 1 (4.3%) |
| $100,000 to $149,999 | 43 (35.5%) | 3 (13.0%) |
| $150,000 or more | 19 (15.7%) | 1 (4.3%) |
| Total | 121 (100.0%) | 23 (100.0%) |
Monthly Housing Cost Tiers in Lyman
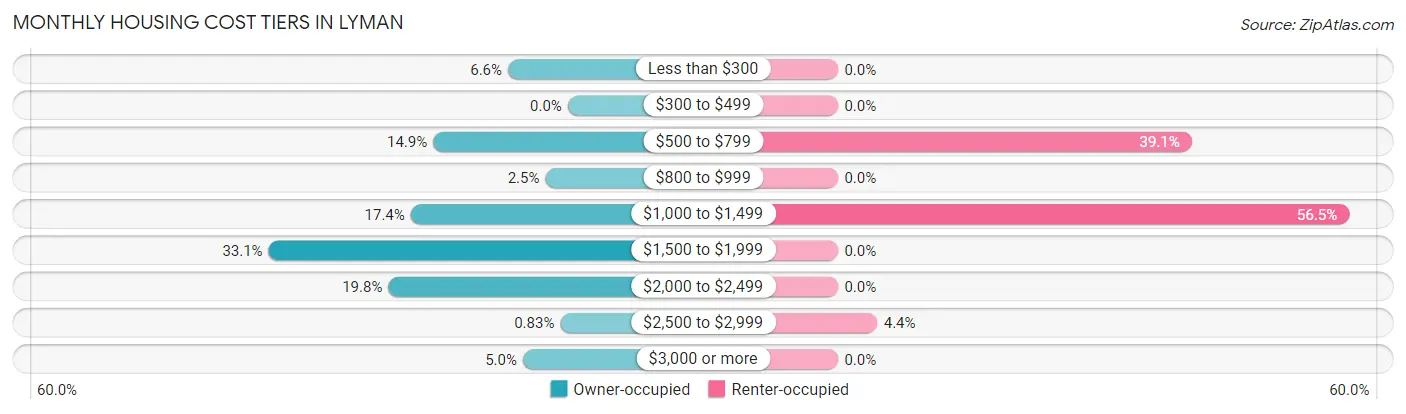
| Monthly Cost | Owner-occupied | Renter-occupied |
| Less than $300 | 8 (6.6%) | 0 (0.0%) |
| $300 to $499 | 0 (0.0%) | 0 (0.0%) |
| $500 to $799 | 18 (14.9%) | 9 (39.1%) |
| $800 to $999 | 3 (2.5%) | 0 (0.0%) |
| $1,000 to $1,499 | 21 (17.4%) | 13 (56.5%) |
| $1,500 to $1,999 | 40 (33.1%) | 0 (0.0%) |
| $2,000 to $2,499 | 24 (19.8%) | 0 (0.0%) |
| $2,500 to $2,999 | 1 (0.8%) | 1 (4.3%) |
| $3,000 or more | 6 (5.0%) | 0 (0.0%) |
| Total | 121 (100.0%) | 23 (100.0%) |
Physical Housing Characteristics in Lyman
Housing Structures in Lyman
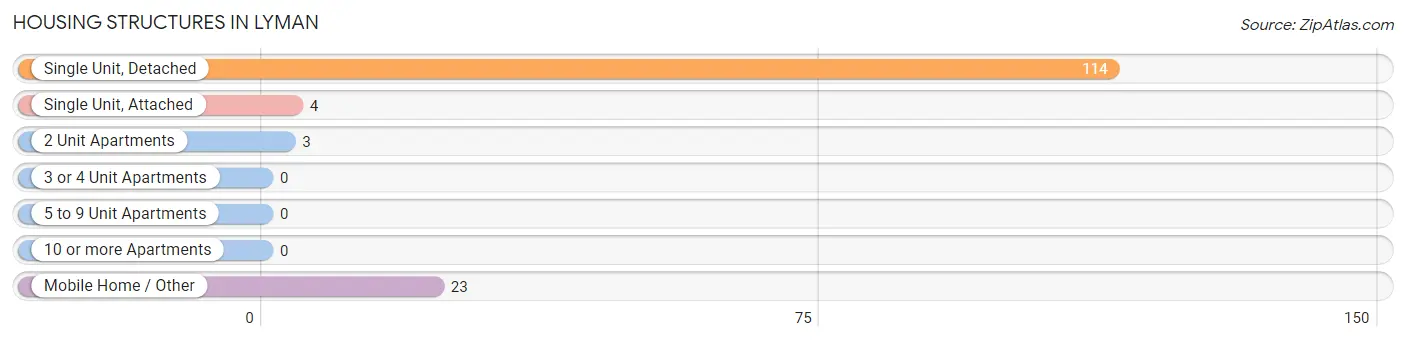
| Structure Type | # Housing Units | % Housing Units |
| Single Unit, Detached | 114 | 79.2% |
| Single Unit, Attached | 4 | 2.8% |
| 2 Unit Apartments | 3 | 2.1% |
| 3 or 4 Unit Apartments | 0 | 0.0% |
| 5 to 9 Unit Apartments | 0 | 0.0% |
| 10 or more Apartments | 0 | 0.0% |
| Mobile Home / Other | 23 | 16.0% |
| Total | 144 | 100.0% |
Housing Structures by Occupancy in Lyman
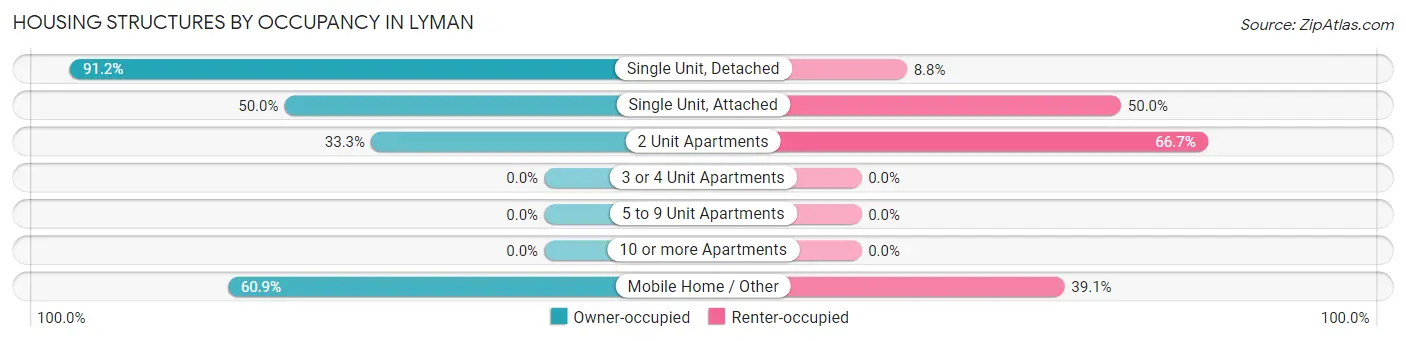
| Structure Type | Owner-occupied | Renter-occupied |
| Single Unit, Detached | 104 (91.2%) | 10 (8.8%) |
| Single Unit, Attached | 2 (50.0%) | 2 (50.0%) |
| 2 Unit Apartments | 1 (33.3%) | 2 (66.7%) |
| 3 or 4 Unit Apartments | 0 (0.0%) | 0 (0.0%) |
| 5 to 9 Unit Apartments | 0 (0.0%) | 0 (0.0%) |
| 10 or more Apartments | 0 (0.0%) | 0 (0.0%) |
| Mobile Home / Other | 14 (60.9%) | 9 (39.1%) |
| Total | 121 (84.0%) | 23 (16.0%) |
Housing Structures by Number of Rooms in Lyman
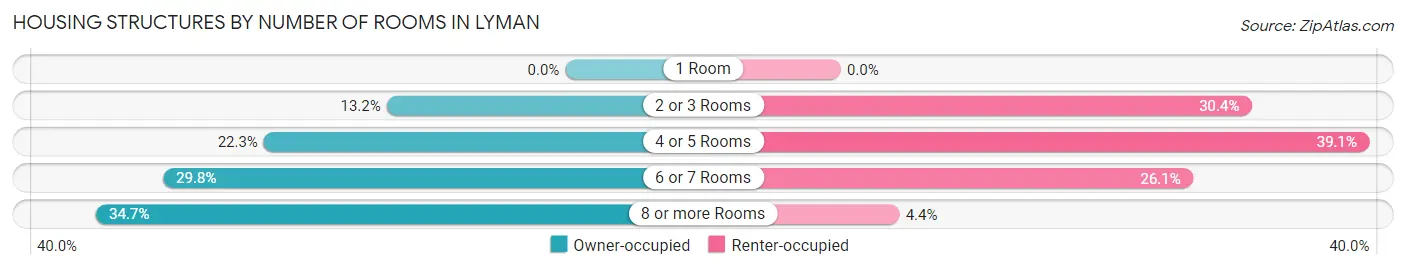
| Number of Rooms | Owner-occupied | Renter-occupied |
| 1 Room | 0 (0.0%) | 0 (0.0%) |
| 2 or 3 Rooms | 16 (13.2%) | 7 (30.4%) |
| 4 or 5 Rooms | 27 (22.3%) | 9 (39.1%) |
| 6 or 7 Rooms | 36 (29.7%) | 6 (26.1%) |
| 8 or more Rooms | 42 (34.7%) | 1 (4.3%) |
| Total | 121 (100.0%) | 23 (100.0%) |
Housing Structure by Heating Type in Lyman
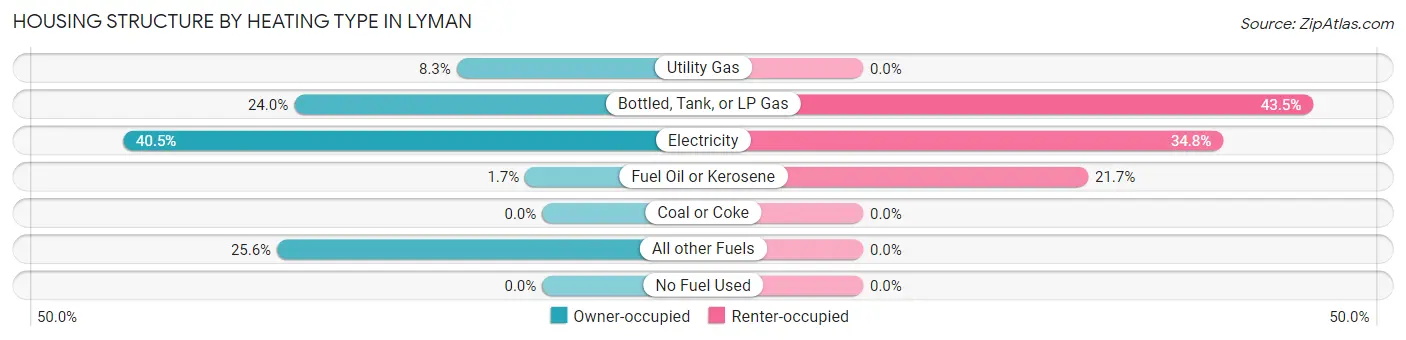
| Heating Type | Owner-occupied | Renter-occupied |
| Utility Gas | 10 (8.3%) | 0 (0.0%) |
| Bottled, Tank, or LP Gas | 29 (24.0%) | 10 (43.5%) |
| Electricity | 49 (40.5%) | 8 (34.8%) |
| Fuel Oil or Kerosene | 2 (1.7%) | 5 (21.7%) |
| Coal or Coke | 0 (0.0%) | 0 (0.0%) |
| All other Fuels | 31 (25.6%) | 0 (0.0%) |
| No Fuel Used | 0 (0.0%) | 0 (0.0%) |
| Total | 121 (100.0%) | 23 (100.0%) |
Household Vehicle Usage in Lyman
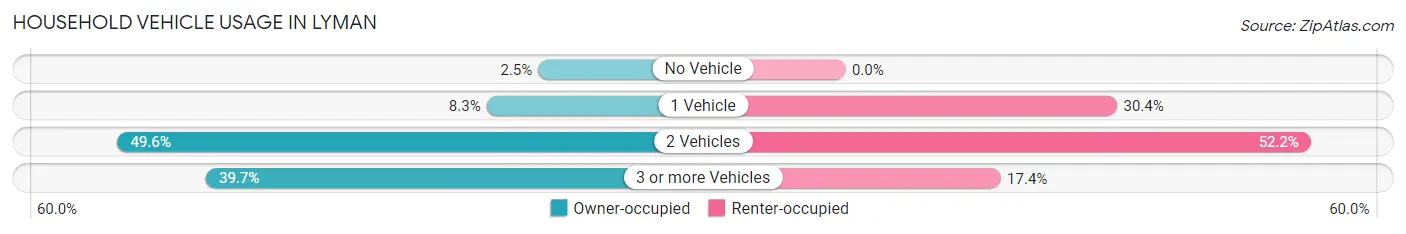
| Vehicles per Household | Owner-occupied | Renter-occupied |
| No Vehicle | 3 (2.5%) | 0 (0.0%) |
| 1 Vehicle | 10 (8.3%) | 7 (30.4%) |
| 2 Vehicles | 60 (49.6%) | 12 (52.2%) |
| 3 or more Vehicles | 48 (39.7%) | 4 (17.4%) |
| Total | 121 (100.0%) | 23 (100.0%) |
Real Estate & Mortgages in Lyman
Real Estate and Mortgage Overview in Lyman
| Characteristic | Without Mortgage | With Mortgage |
| Housing Units | 22 | 99 |
| Median Property Value | - | - |
| Median Household Income | - | - |
| Monthly Housing Costs | $586 | $6 |
| Real Estate Taxes | $1,800 | $5 |
Property Value by Mortgage Status in Lyman
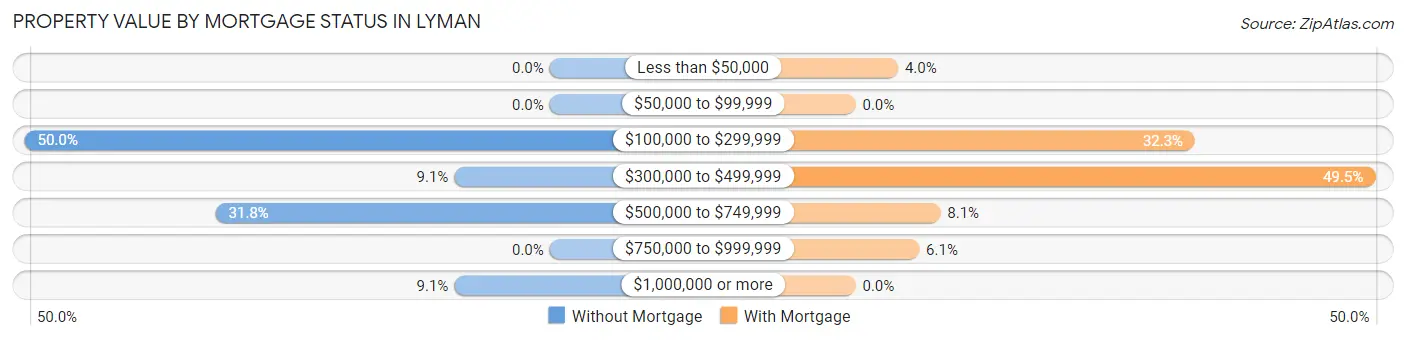
| Property Value | Without Mortgage | With Mortgage |
| Less than $50,000 | 0 (0.0%) | 4 (4.0%) |
| $50,000 to $99,999 | 0 (0.0%) | 0 (0.0%) |
| $100,000 to $299,999 | 11 (50.0%) | 32 (32.3%) |
| $300,000 to $499,999 | 2 (9.1%) | 49 (49.5%) |
| $500,000 to $749,999 | 7 (31.8%) | 8 (8.1%) |
| $750,000 to $999,999 | 0 (0.0%) | 6 (6.1%) |
| $1,000,000 or more | 2 (9.1%) | 0 (0.0%) |
| Total | 22 (100.0%) | 99 (100.0%) |
Household Income by Mortgage Status in Lyman
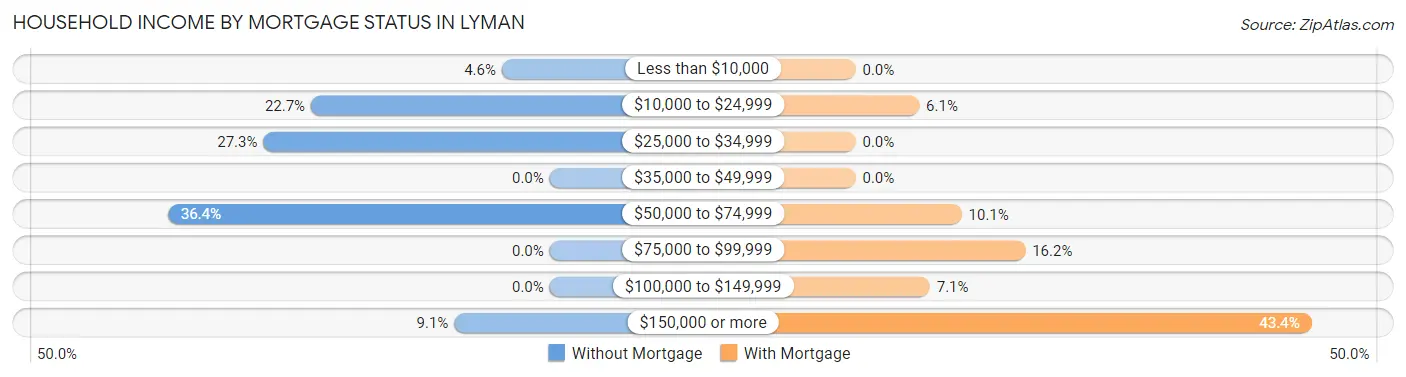
| Household Income | Without Mortgage | With Mortgage |
| Less than $10,000 | 1 (4.5%) | 0 (0.0%) |
| $10,000 to $24,999 | 5 (22.7%) | 6 (6.1%) |
| $25,000 to $34,999 | 6 (27.3%) | 0 (0.0%) |
| $35,000 to $49,999 | 0 (0.0%) | 0 (0.0%) |
| $50,000 to $74,999 | 8 (36.4%) | 10 (10.1%) |
| $75,000 to $99,999 | 0 (0.0%) | 16 (16.2%) |
| $100,000 to $149,999 | 0 (0.0%) | 7 (7.1%) |
| $150,000 or more | 2 (9.1%) | 43 (43.4%) |
| Total | 22 (100.0%) | 99 (100.0%) |
Property Value to Household Income Ratio in Lyman
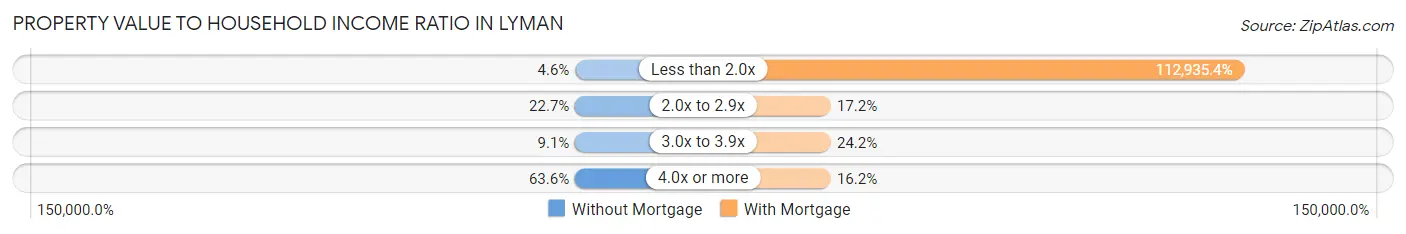
| Value-to-Income Ratio | Without Mortgage | With Mortgage |
| Less than 2.0x | 1 (4.5%) | 111,806 (112,935.3%) |
| 2.0x to 2.9x | 5 (22.7%) | 17 (17.2%) |
| 3.0x to 3.9x | 2 (9.1%) | 24 (24.2%) |
| 4.0x or more | 14 (63.6%) | 16 (16.2%) |
| Total | 22 (100.0%) | 99 (100.0%) |
Real Estate Taxes by Mortgage Status in Lyman
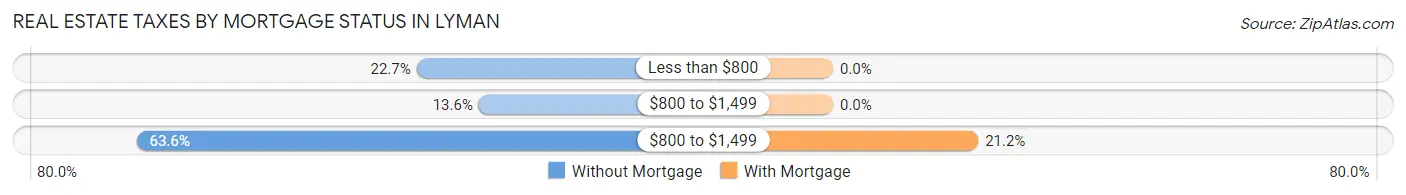
| Property Taxes | Without Mortgage | With Mortgage |
| Less than $800 | 5 (22.7%) | 0 (0.0%) |
| $800 to $1,499 | 3 (13.6%) | 0 (0.0%) |
| $800 to $1,499 | 14 (63.6%) | 21 (21.2%) |
| Total | 22 (100.0%) | 99 (100.0%) |
Health & Disability in Lyman
Health Insurance Coverage by Age in Lyman
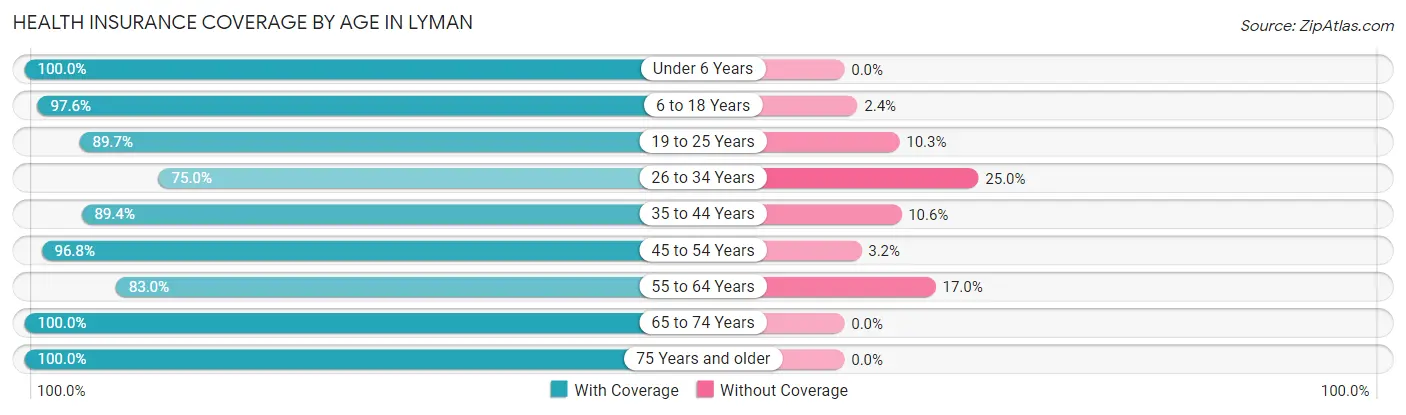
| Age Bracket | With Coverage | Without Coverage |
| Under 6 Years | 16 (100.0%) | 0 (0.0%) |
| 6 to 18 Years | 80 (97.6%) | 2 (2.4%) |
| 19 to 25 Years | 35 (89.7%) | 4 (10.3%) |
| 26 to 34 Years | 36 (75.0%) | 12 (25.0%) |
| 35 to 44 Years | 59 (89.4%) | 7 (10.6%) |
| 45 to 54 Years | 61 (96.8%) | 2 (3.2%) |
| 55 to 64 Years | 39 (83.0%) | 8 (17.0%) |
| 65 to 74 Years | 15 (100.0%) | 0 (0.0%) |
| 75 Years and older | 10 (100.0%) | 0 (0.0%) |
| Total | 351 (90.9%) | 35 (9.1%) |
Health Insurance Coverage by Citizenship Status in Lyman
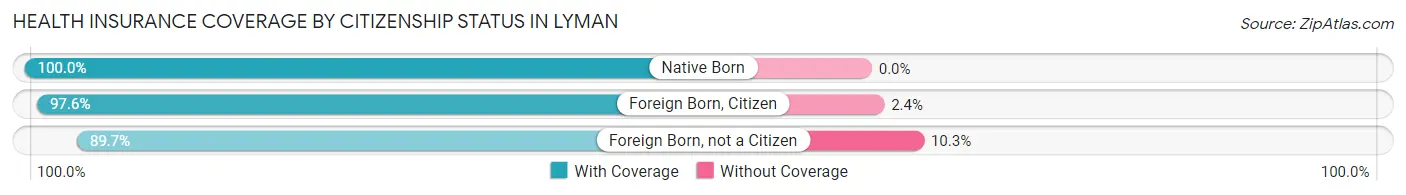
| Citizenship Status | With Coverage | Without Coverage |
| Native Born | 16 (100.0%) | 0 (0.0%) |
| Foreign Born, Citizen | 80 (97.6%) | 2 (2.4%) |
| Foreign Born, not a Citizen | 35 (89.7%) | 4 (10.3%) |
Health Insurance Coverage by Household Income in Lyman
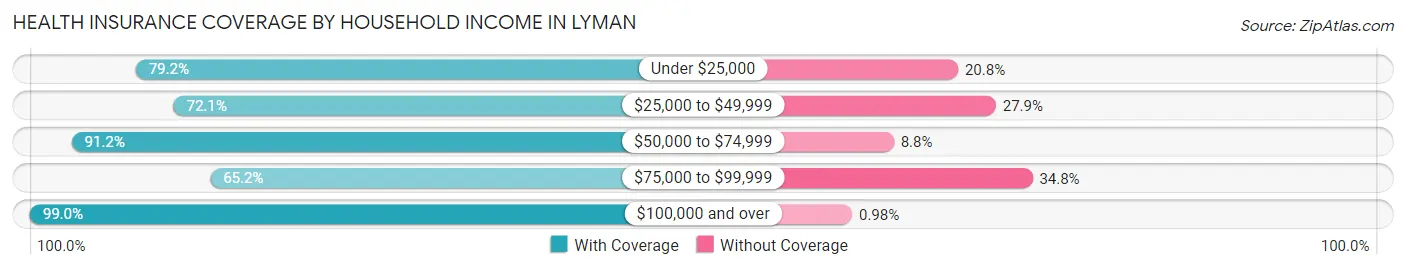
| Household Income | With Coverage | Without Coverage |
| Under $25,000 | 19 (79.2%) | 5 (20.8%) |
| $25,000 to $49,999 | 31 (72.1%) | 12 (27.9%) |
| $50,000 to $74,999 | 83 (91.2%) | 8 (8.8%) |
| $75,000 to $99,999 | 15 (65.2%) | 8 (34.8%) |
| $100,000 and over | 203 (99.0%) | 2 (1.0%) |
Public vs Private Health Insurance Coverage by Age in Lyman
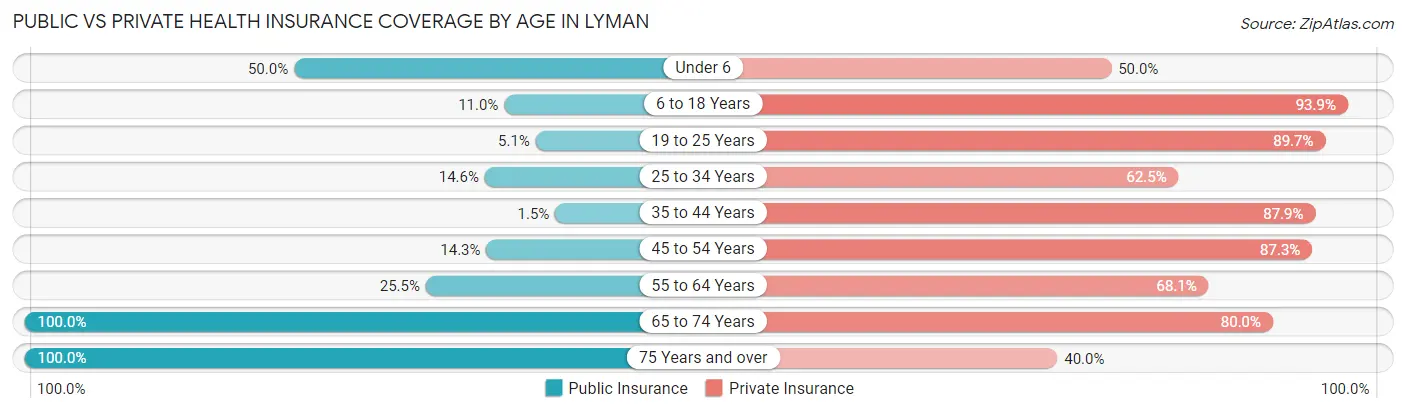
| Age Bracket | Public Insurance | Private Insurance |
| Under 6 | 8 (50.0%) | 8 (50.0%) |
| 6 to 18 Years | 9 (11.0%) | 77 (93.9%) |
| 19 to 25 Years | 2 (5.1%) | 35 (89.7%) |
| 25 to 34 Years | 7 (14.6%) | 30 (62.5%) |
| 35 to 44 Years | 1 (1.5%) | 58 (87.9%) |
| 45 to 54 Years | 9 (14.3%) | 55 (87.3%) |
| 55 to 64 Years | 12 (25.5%) | 32 (68.1%) |
| 65 to 74 Years | 15 (100.0%) | 12 (80.0%) |
| 75 Years and over | 10 (100.0%) | 4 (40.0%) |
| Total | 73 (18.9%) | 311 (80.6%) |
Disability Status by Sex by Age in Lyman
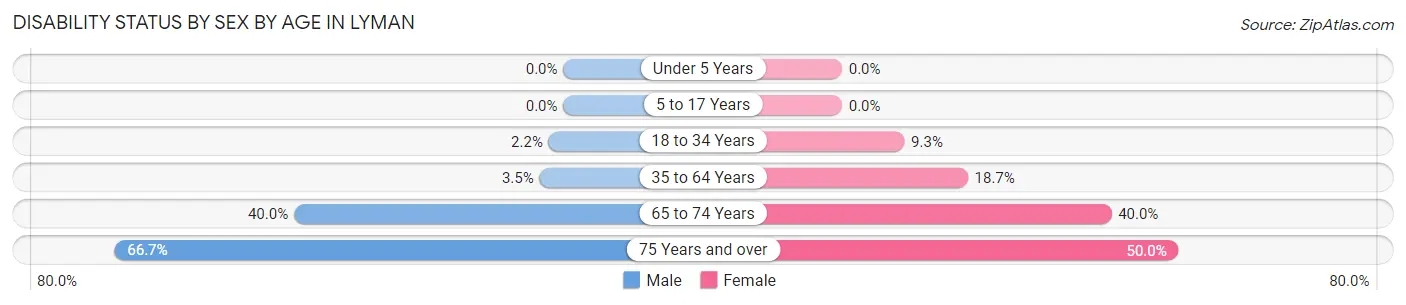
| Age Bracket | Male | Female |
| Under 5 Years | 0 (0.0%) | 0 (0.0%) |
| 5 to 17 Years | 0 (0.0%) | 0 (0.0%) |
| 18 to 34 Years | 1 (2.2%) | 5 (9.3%) |
| 35 to 64 Years | 3 (3.5%) | 17 (18.7%) |
| 65 to 74 Years | 4 (40.0%) | 2 (40.0%) |
| 75 Years and over | 4 (66.7%) | 2 (50.0%) |
Disability Class by Sex by Age in Lyman
Disability Class: Hearing Difficulty
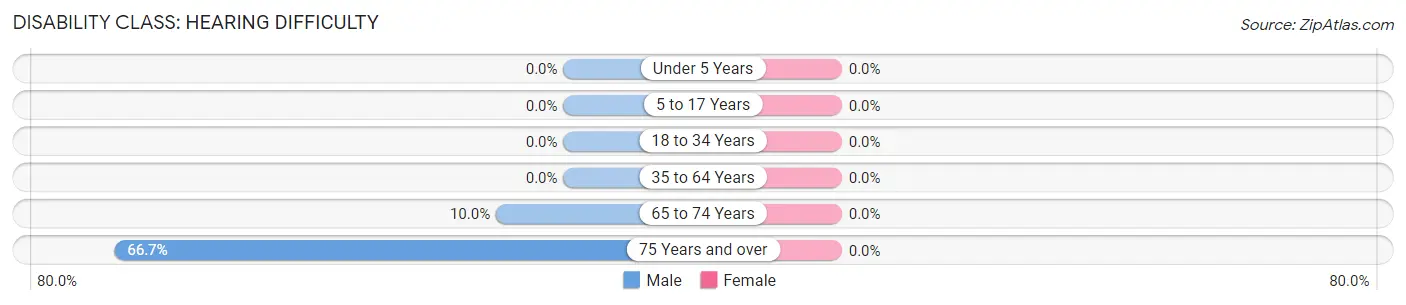
| Age Bracket | Male | Female |
| Under 5 Years | 0 (0.0%) | 0 (0.0%) |
| 5 to 17 Years | 0 (0.0%) | 0 (0.0%) |
| 18 to 34 Years | 0 (0.0%) | 0 (0.0%) |
| 35 to 64 Years | 0 (0.0%) | 0 (0.0%) |
| 65 to 74 Years | 1 (10.0%) | 0 (0.0%) |
| 75 Years and over | 4 (66.7%) | 0 (0.0%) |
Disability Class: Vision Difficulty
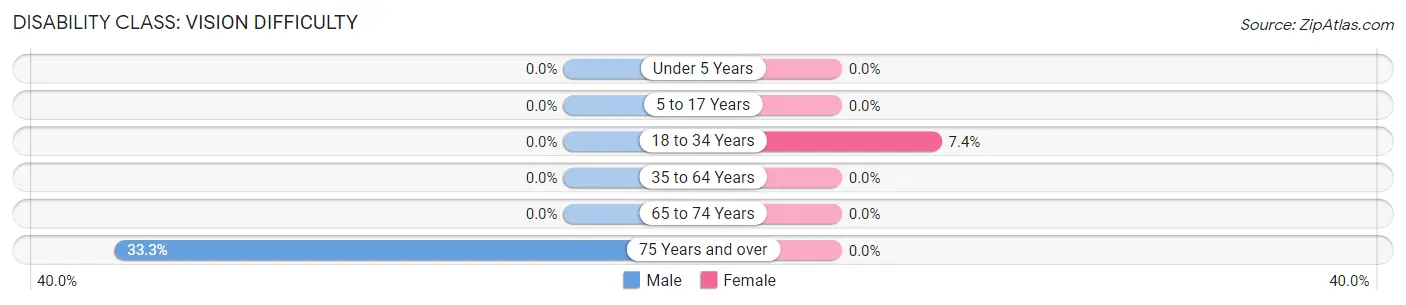
| Age Bracket | Male | Female |
| Under 5 Years | 0 (0.0%) | 0 (0.0%) |
| 5 to 17 Years | 0 (0.0%) | 0 (0.0%) |
| 18 to 34 Years | 0 (0.0%) | 4 (7.4%) |
| 35 to 64 Years | 0 (0.0%) | 0 (0.0%) |
| 65 to 74 Years | 0 (0.0%) | 0 (0.0%) |
| 75 Years and over | 2 (33.3%) | 0 (0.0%) |
Disability Class: Cognitive Difficulty
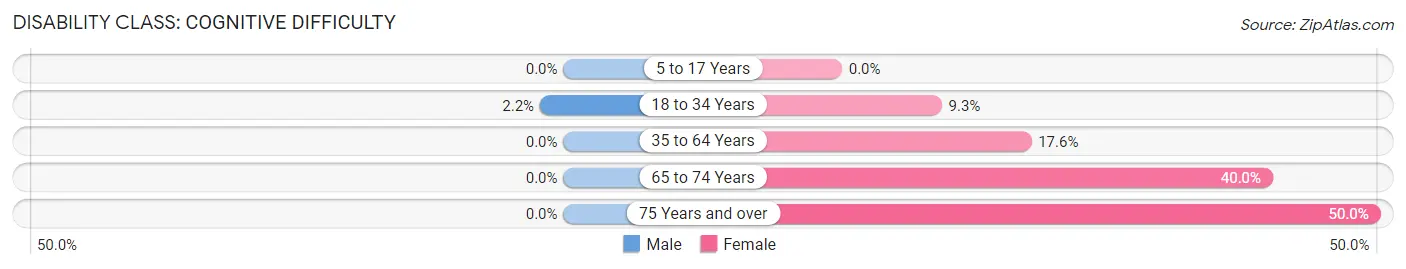
| Age Bracket | Male | Female |
| 5 to 17 Years | 0 (0.0%) | 0 (0.0%) |
| 18 to 34 Years | 1 (2.2%) | 5 (9.3%) |
| 35 to 64 Years | 0 (0.0%) | 16 (17.6%) |
| 65 to 74 Years | 0 (0.0%) | 2 (40.0%) |
| 75 Years and over | 0 (0.0%) | 2 (50.0%) |
Disability Class: Ambulatory Difficulty
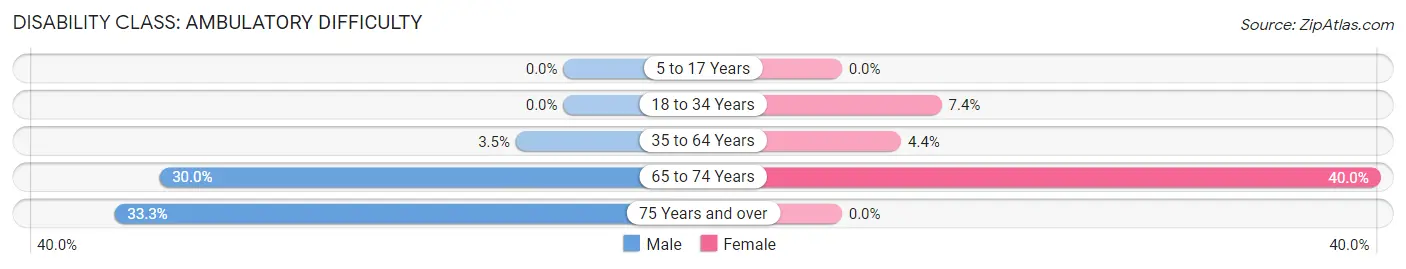
| Age Bracket | Male | Female |
| 5 to 17 Years | 0 (0.0%) | 0 (0.0%) |
| 18 to 34 Years | 0 (0.0%) | 4 (7.4%) |
| 35 to 64 Years | 3 (3.5%) | 4 (4.4%) |
| 65 to 74 Years | 3 (30.0%) | 2 (40.0%) |
| 75 Years and over | 2 (33.3%) | 0 (0.0%) |
Disability Class: Self-Care Difficulty
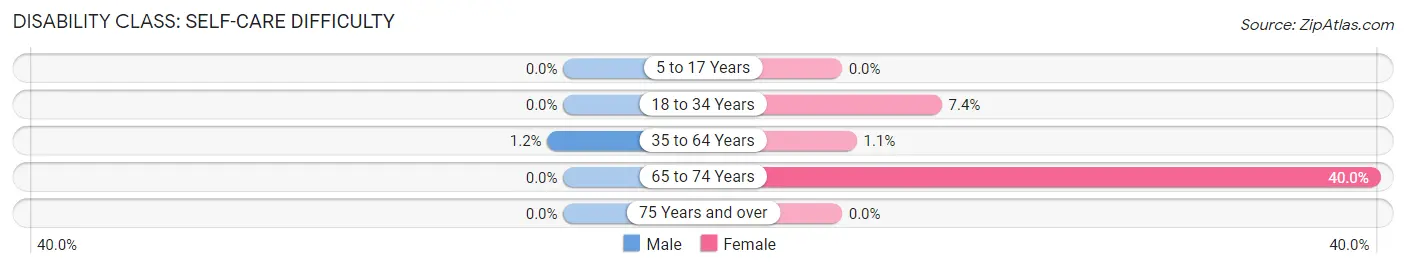
| Age Bracket | Male | Female |
| 5 to 17 Years | 0 (0.0%) | 0 (0.0%) |
| 18 to 34 Years | 0 (0.0%) | 4 (7.4%) |
| 35 to 64 Years | 1 (1.2%) | 1 (1.1%) |
| 65 to 74 Years | 0 (0.0%) | 2 (40.0%) |
| 75 Years and over | 0 (0.0%) | 0 (0.0%) |
Technology Access in Lyman
Computing Device Access in Lyman
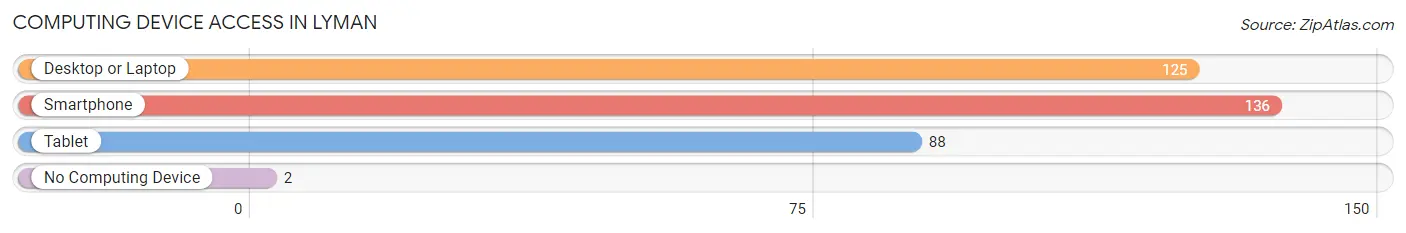
| Device Type | # Households | % Households |
| Desktop or Laptop | 125 | 86.8% |
| Smartphone | 136 | 94.4% |
| Tablet | 88 | 61.1% |
| No Computing Device | 2 | 1.4% |
| Total | 144 | 100.0% |
Internet Access in Lyman
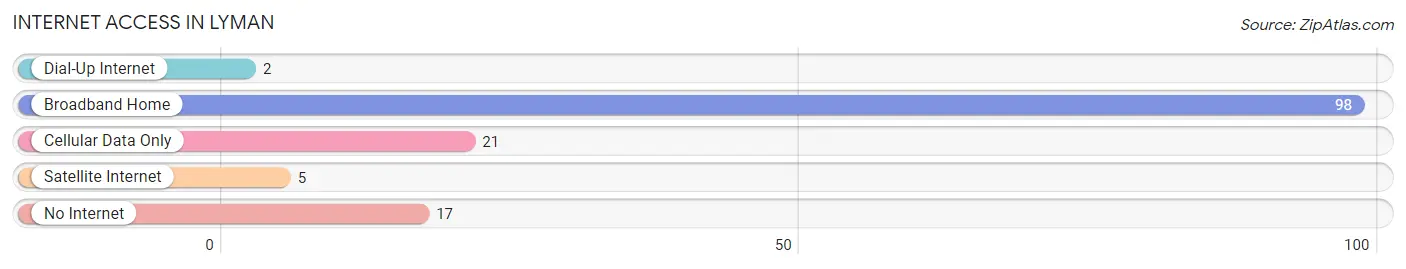
| Internet Type | # Households | % Households |
| Dial-Up Internet | 2 | 1.4% |
| Broadband Home | 98 | 68.1% |
| Cellular Data Only | 21 | 14.6% |
| Satellite Internet | 5 | 3.5% |
| No Internet | 17 | 11.8% |
| Total | 144 | 100.0% |
Lyman Summary
Lyman, Washington is a small town located in Skagit County, Washington, United States. It is situated on the banks of the Skagit River, about 25 miles north of Mount Vernon. The town was founded in 1891 and was named after the Lyman family, who were early settlers in the area. The population of Lyman was 1,093 at the 2010 census.
History
The area around Lyman was first settled by the Lummi people, who lived in the area for thousands of years before the arrival of European settlers. The first European settlers in the area were the Lyman family, who arrived in 1891. The family was led by William Lyman, who had previously served in the Civil War. The family established a homestead on the banks of the Skagit River and named the area Lyman.
The town was officially incorporated in 1909 and quickly grew to become a thriving community. The town was home to a variety of businesses, including a sawmill, a general store, a hotel, and a blacksmith shop. The town also had a school, a post office, and a church.
In the early 1900s, the town was a popular destination for tourists, who came to enjoy the scenic beauty of the area. The town was also a popular spot for fishing and hunting.
Geography
Lyman is located in Skagit County, Washington, United States. It is situated on the banks of the Skagit River, about 25 miles north of Mount Vernon. The town is surrounded by lush forests and rolling hills. The climate in Lyman is mild, with temperatures ranging from the mid-30s in the winter to the mid-70s in the summer.
Economy
The economy of Lyman is largely based on agriculture and tourism. The town is home to several farms, which produce a variety of crops, including apples, cherries, and hops. The town is also home to several wineries, which produce a variety of wines.
Tourism is also an important part of the economy of Lyman. The town is home to several parks and trails, which attract visitors from all over the region. The town is also home to several festivals and events, which attract visitors from all over the world.
Demographics
As of the 2010 census, the population of Lyman was 1,093. The racial makeup of the town was 94.3% White, 0.7% African American, 0.7% Native American, 0.7% Asian, 0.1% Pacific Islander, and 3.4% from other races. The median household income in Lyman was $45,938, and the median family income was $50,625. The per capita income in Lyman was $20,945.
Lyman is a small town with a close-knit community. The town is home to several churches, a library, and a variety of small businesses. The town is also home to several parks and trails, which attract visitors from all over the region.
Common Questions
What is Per Capita Income in Lyman?
Per Capita income in Lyman is $34,188.
What is the Median Family Income in Lyman?
Median Family Income in Lyman is $103,125.
What is the Median Household income in Lyman?
Median Household Income in Lyman is $81,250.
What is Income or Wage Gap in Lyman?
Income or Wage Gap in Lyman is 42.2%.
Women in Lyman earn 57.8 cents for every dollar earned by a man.
What is Inequality or Gini Index in Lyman?
Inequality or Gini Index in Lyman is 0.34.
What is the Total Population of Lyman?
Total Population of Lyman is 386.
What is the Total Male Population of Lyman?
Total Male Population of Lyman is 183.
What is the Total Female Population of Lyman?
Total Female Population of Lyman is 203.
What is the Ratio of Males per 100 Females in Lyman?
There are 90.15 Males per 100 Females in Lyman.
What is the Ratio of Females per 100 Males in Lyman?
There are 110.93 Females per 100 Males in Lyman.
What is the Median Population Age in Lyman?
Median Population Age in Lyman is 39.2 Years.
What is the Average Family Size in Lyman
Average Family Size in Lyman is 2.9 People.
What is the Average Household Size in Lyman
Average Household Size in Lyman is 2.7 People.
How Large is the Labor Force in Lyman?
There are 225 People in the Labor Forcein in Lyman.
What is the Percentage of People in the Labor Force in Lyman?
72.6% of People are in the Labor Force in Lyman.
What is the Unemployment Rate in Lyman?
Unemployment Rate in Lyman is 5.8%.