Zip Codes with the Highest Percentage of Population Employed in Installation, Maintenance & Repair in Issaquah, WA
RELATED REPORTS & OPTIONS
Installation, Maintenance & Repair
Issaquah
Compare Zip Codes
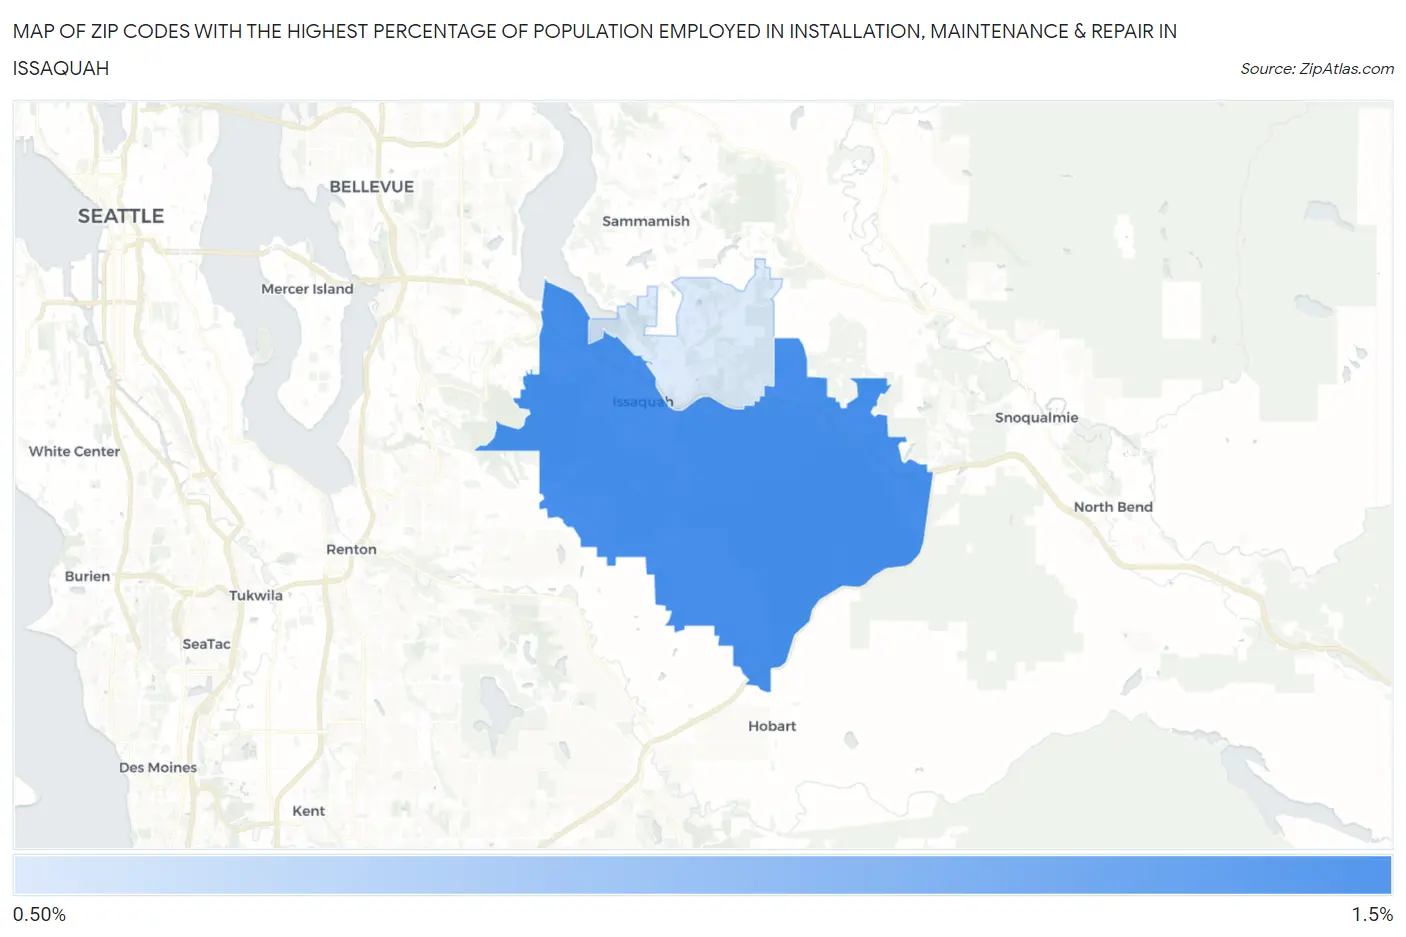
Map of Zip Codes with the Highest Percentage of Population Employed in Installation, Maintenance & Repair in Issaquah
1.2%
1.4%
Zip Codes with the Highest Percentage of Population Employed in Installation, Maintenance & Repair in Issaquah, WA
| Zip Code | % Employed | vs State | vs National | |
| 1. | 98027 | 1.4% | 2.9%(-1.49)#422 | 3.1%(-1.63)#24,416 |
| 2. | 98029 | 1.2% | 2.9%(-1.71)#438 | 3.1%(-1.85)#25,205 |
1
Common Questions
What are the Top Zip Codes with the Highest Percentage of Population Employed in Installation, Maintenance & Repair in Issaquah, WA?
Top Zip Codes with the Highest Percentage of Population Employed in Installation, Maintenance & Repair in Issaquah, WA are:
What zip code has the Highest Percentage of Population Employed in Installation, Maintenance & Repair in Issaquah, WA?
98027 has the Highest Percentage of Population Employed in Installation, Maintenance & Repair in Issaquah, WA with 1.4%.
What is the Percentage of Population Employed in Installation, Maintenance & Repair in Issaquah, WA?
Percentage of Population Employed in Installation, Maintenance & Repair in Issaquah is 0.90%.
What is the Percentage of Population Employed in Installation, Maintenance & Repair in Washington?
Percentage of Population Employed in Installation, Maintenance & Repair in Washington is 2.9%.
What is the Percentage of Population Employed in Installation, Maintenance & Repair in the United States?
Percentage of Population Employed in Installation, Maintenance & Repair in the United States is 3.1%.