Zip Codes with the Highest Percentage of Population Employed in Installation, Maintenance & Repair in Mount Vernon, WA
RELATED REPORTS & OPTIONS
Installation, Maintenance & Repair
Mount Vernon
Compare Zip Codes
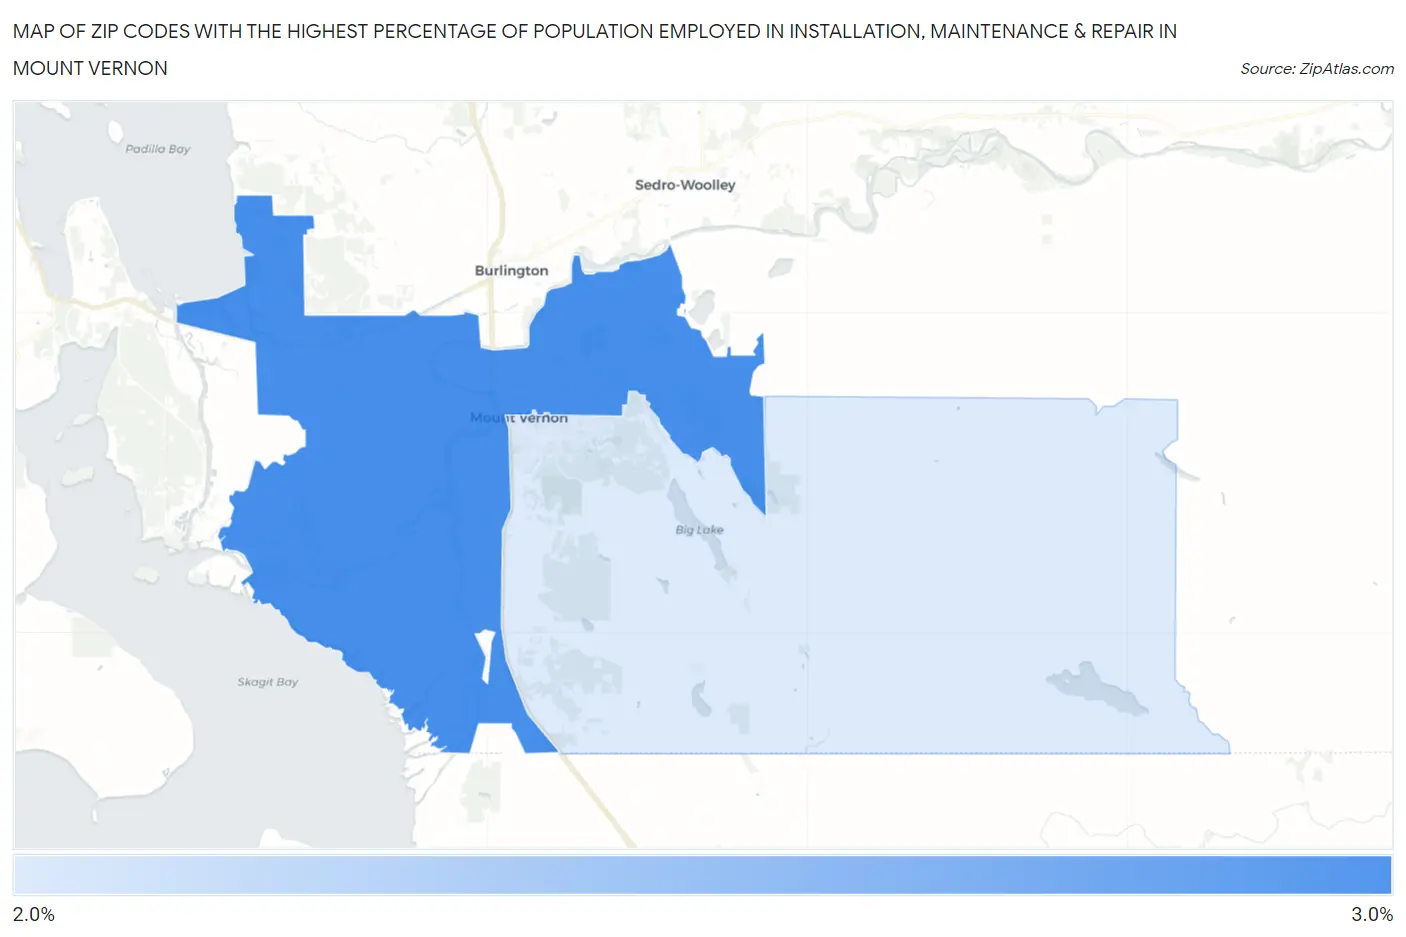
Map of Zip Codes with the Highest Percentage of Population Employed in Installation, Maintenance & Repair in Mount Vernon
2.1%
2.8%
Zip Codes with the Highest Percentage of Population Employed in Installation, Maintenance & Repair in Mount Vernon, WA
| Zip Code | % Employed | vs State | vs National | |
| 1. | 98273 | 2.8% | 2.9%(-0.110)#296 | 3.1%(-0.249)#17,905 |
| 2. | 98274 | 2.1% | 2.9%(-0.854)#368 | 3.1%(-0.993)#21,664 |
1
Common Questions
What are the Top Zip Codes with the Highest Percentage of Population Employed in Installation, Maintenance & Repair in Mount Vernon, WA?
Top Zip Codes with the Highest Percentage of Population Employed in Installation, Maintenance & Repair in Mount Vernon, WA are:
What zip code has the Highest Percentage of Population Employed in Installation, Maintenance & Repair in Mount Vernon, WA?
98273 has the Highest Percentage of Population Employed in Installation, Maintenance & Repair in Mount Vernon, WA with 2.8%.
What is the Percentage of Population Employed in Installation, Maintenance & Repair in Mount Vernon, WA?
Percentage of Population Employed in Installation, Maintenance & Repair in Mount Vernon is 2.1%.
What is the Percentage of Population Employed in Installation, Maintenance & Repair in Washington?
Percentage of Population Employed in Installation, Maintenance & Repair in Washington is 2.9%.
What is the Percentage of Population Employed in Installation, Maintenance & Repair in the United States?
Percentage of Population Employed in Installation, Maintenance & Repair in the United States is 3.1%.