Zip Codes with the Highest Percentage of Population Employed in Installation, Maintenance & Repair in Olympia, WA
RELATED REPORTS & OPTIONS
Installation, Maintenance & Repair
Olympia
Compare Zip Codes
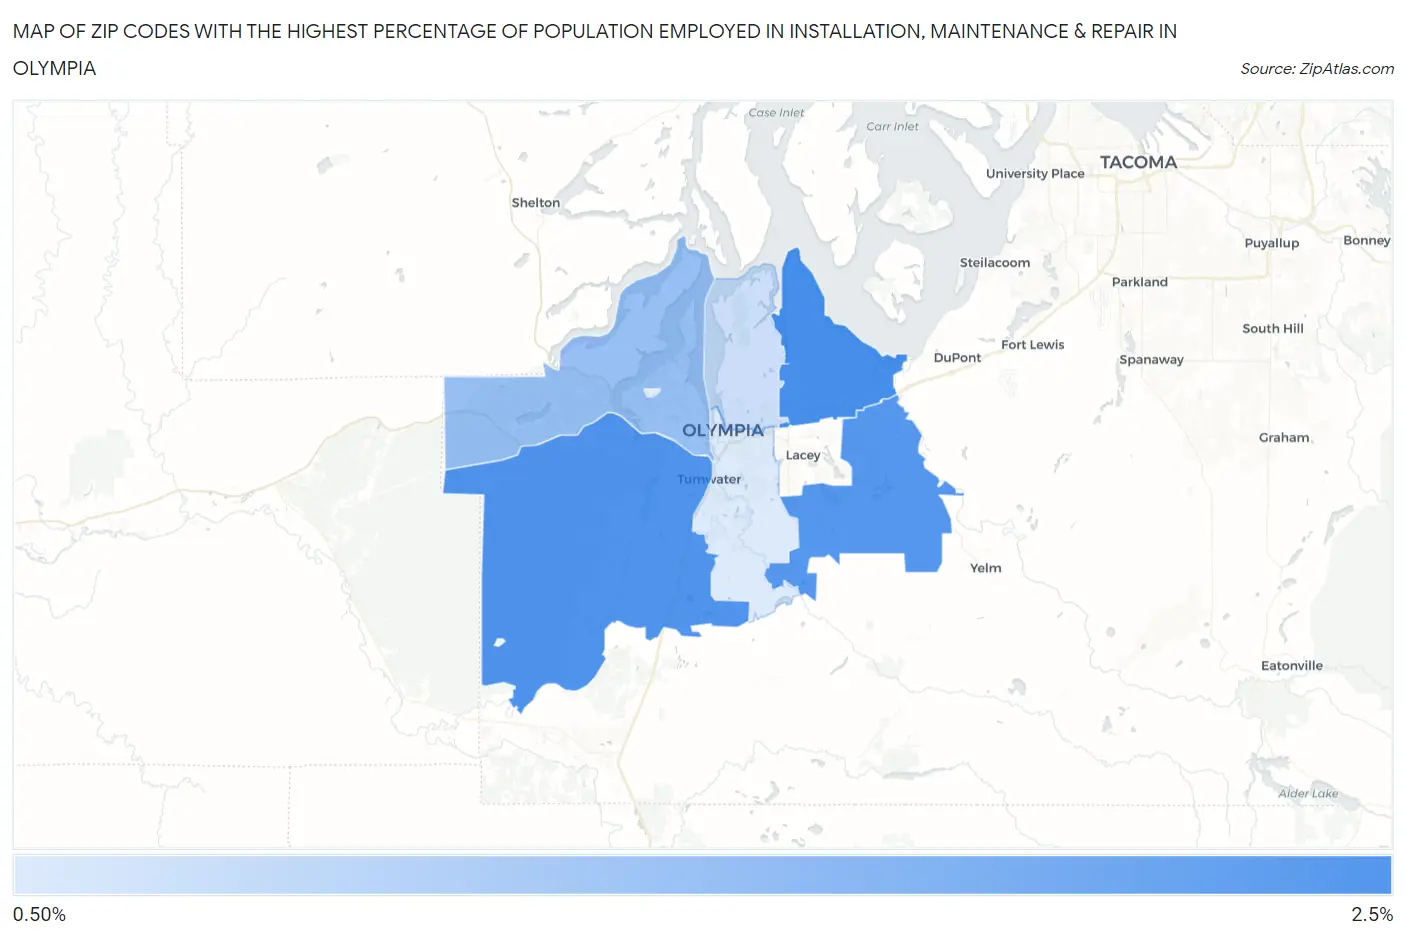
Map of Zip Codes with the Highest Percentage of Population Employed in Installation, Maintenance & Repair in Olympia
1.4%
2.5%
Zip Codes with the Highest Percentage of Population Employed in Installation, Maintenance & Repair in Olympia, WA
| Zip Code | % Employed | vs State | vs National | |
| 1. | 98516 | 2.5% | 2.9%(-0.465)#326 | 3.1%(-0.604)#19,722 |
| 2. | 98512 | 2.4% | 2.9%(-0.520)#332 | 3.1%(-0.658)#20,024 |
| 3. | 98513 | 2.4% | 2.9%(-0.565)#338 | 3.1%(-0.704)#20,252 |
| 4. | 98502 | 1.9% | 2.9%(-1.02)#388 | 3.1%(-1.16)#22,450 |
| 5. | 98506 | 1.5% | 2.9%(-1.38)#412 | 3.1%(-1.52)#23,998 |
| 6. | 98501 | 1.4% | 2.9%(-1.51)#424 | 3.1%(-1.65)#24,494 |
1
Common Questions
What are the Top 5 Zip Codes with the Highest Percentage of Population Employed in Installation, Maintenance & Repair in Olympia, WA?
Top 5 Zip Codes with the Highest Percentage of Population Employed in Installation, Maintenance & Repair in Olympia, WA are:
What zip code has the Highest Percentage of Population Employed in Installation, Maintenance & Repair in Olympia, WA?
98516 has the Highest Percentage of Population Employed in Installation, Maintenance & Repair in Olympia, WA with 2.5%.
What is the Percentage of Population Employed in Installation, Maintenance & Repair in Olympia, WA?
Percentage of Population Employed in Installation, Maintenance & Repair in Olympia is 1.9%.
What is the Percentage of Population Employed in Installation, Maintenance & Repair in Washington?
Percentage of Population Employed in Installation, Maintenance & Repair in Washington is 2.9%.
What is the Percentage of Population Employed in Installation, Maintenance & Repair in the United States?
Percentage of Population Employed in Installation, Maintenance & Repair in the United States is 3.1%.