Buena, WA Map & Demographics
Buena Map
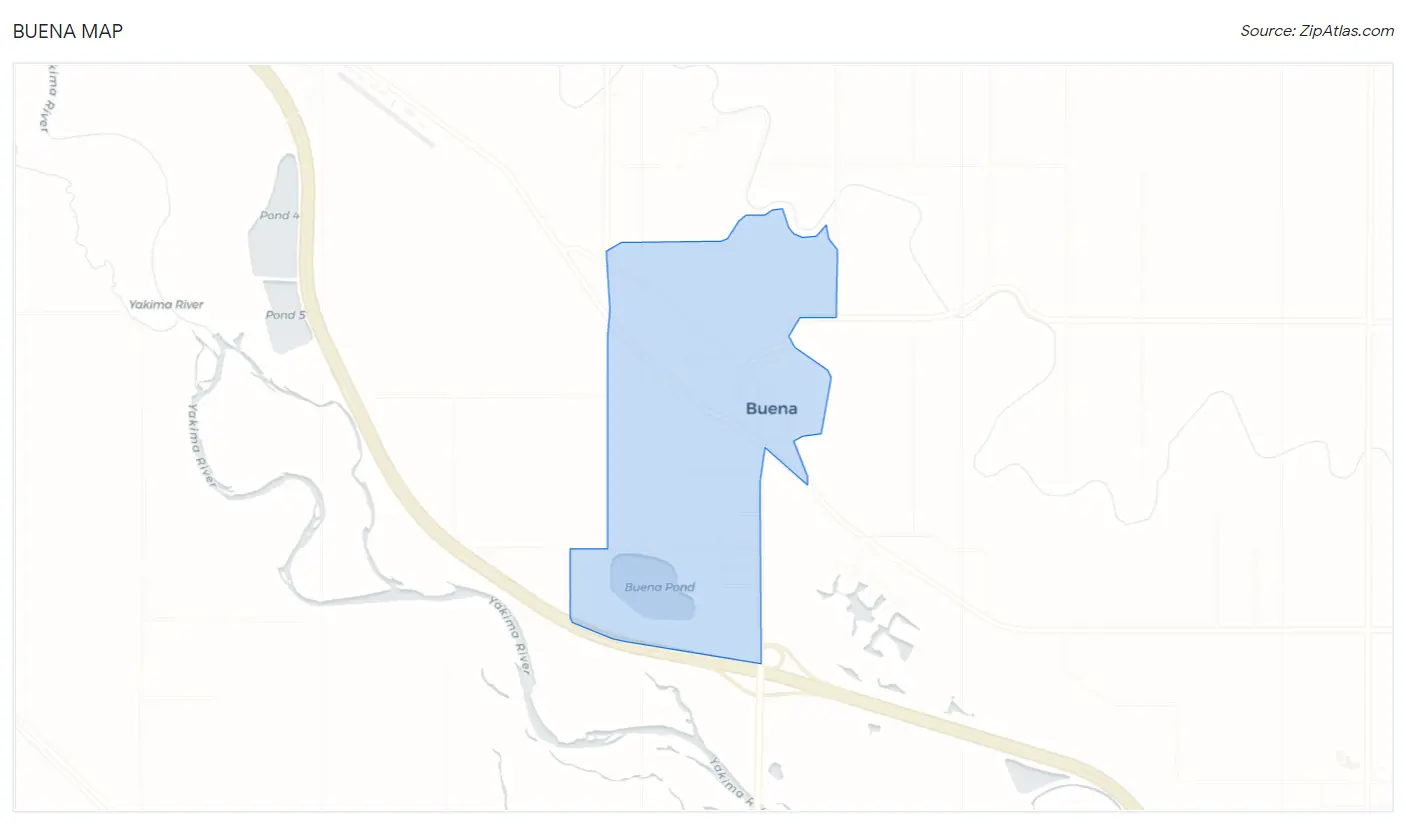
Buena Overview
$12,421
PER CAPITA INCOME
0.28
INEQUALITY / GINI INDEX
543
TOTAL POPULATION
258
MALE POPULATION
285
FEMALE POPULATION
90.53
MALES / 100 FEMALES
110.47
FEMALES / 100 MALES
16.1
MEDIAN AGE
6.0
AVG FAMILY SIZE
6.0
AVG HOUSEHOLD SIZE
178
LABOR FORCE [ PEOPLE ]
65.0%
PERCENT IN LABOR FORCE
Buena Area Codes
Income in Buena
Income Overview in Buena
| Characteristic | Number | Measure |
| Per Capita Income | 543 | $12,421 |
| Median Family Income | 79 | $0 |
| Mean Family Income | 79 | $70,633 |
| Median Household Income | 79 | $0 |
| Mean Household Income | 79 | $70,633 |
| Income Deficit | 79 | $0 |
| Wage / Income Gap (%) | 543 | 0.00% |
| Wage / Income Gap ($) | 543 | 100.00¢ per $1 |
| Gini / Inequality Index | 543 | 0.28 |
Earnings by Sex in Buena
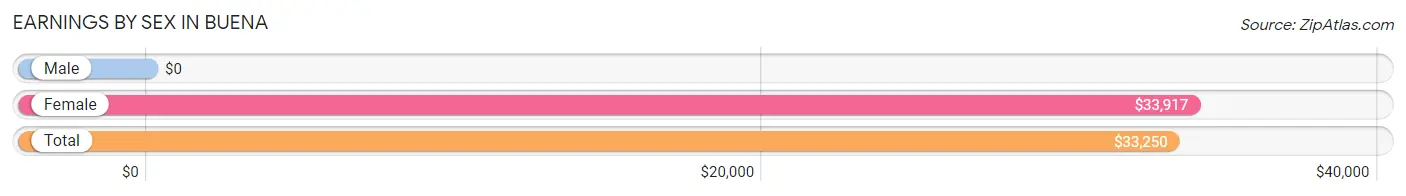
| Sex | Number | Average Earnings |
| Male | 108 (56.8%) | $0 |
| Female | 82 (43.2%) | $33,917 |
| Total | 190 (100.0%) | $33,250 |
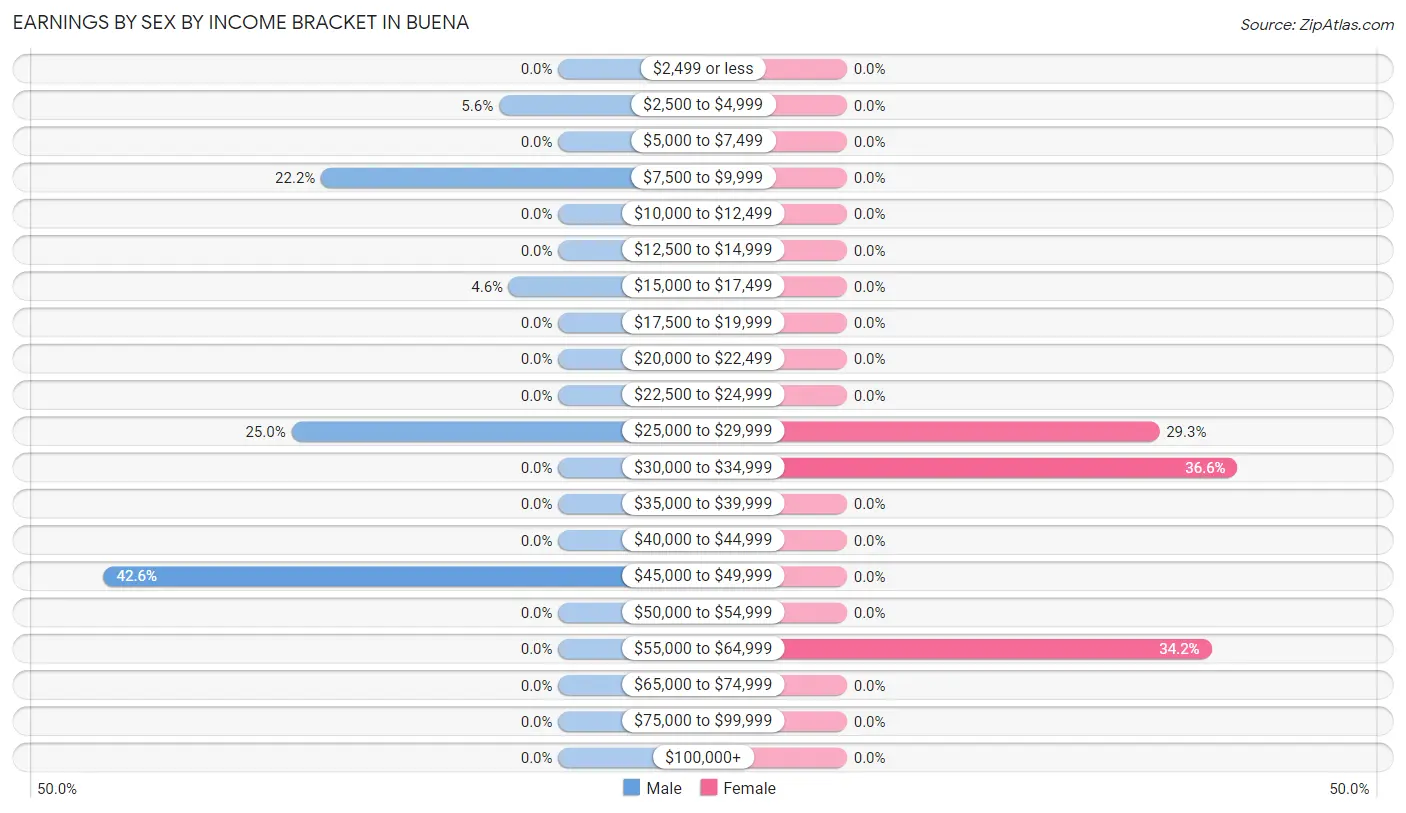
Earnings by Sex by Income Bracket in Buena
The most common earnings brackets in Buena are $45,000 to $49,999 for men (46 | 42.6%) and $30,000 to $34,999 for women (30 | 36.6%).
| Income | Male | Female |
| $2,499 or less | 0 (0.0%) | 0 (0.0%) |
| $2,500 to $4,999 | 6 (5.6%) | 0 (0.0%) |
| $5,000 to $7,499 | 0 (0.0%) | 0 (0.0%) |
| $7,500 to $9,999 | 24 (22.2%) | 0 (0.0%) |
| $10,000 to $12,499 | 0 (0.0%) | 0 (0.0%) |
| $12,500 to $14,999 | 0 (0.0%) | 0 (0.0%) |
| $15,000 to $17,499 | 5 (4.6%) | 0 (0.0%) |
| $17,500 to $19,999 | 0 (0.0%) | 0 (0.0%) |
| $20,000 to $22,499 | 0 (0.0%) | 0 (0.0%) |
| $22,500 to $24,999 | 0 (0.0%) | 0 (0.0%) |
| $25,000 to $29,999 | 27 (25.0%) | 24 (29.3%) |
| $30,000 to $34,999 | 0 (0.0%) | 30 (36.6%) |
| $35,000 to $39,999 | 0 (0.0%) | 0 (0.0%) |
| $40,000 to $44,999 | 0 (0.0%) | 0 (0.0%) |
| $45,000 to $49,999 | 46 (42.6%) | 0 (0.0%) |
| $50,000 to $54,999 | 0 (0.0%) | 0 (0.0%) |
| $55,000 to $64,999 | 0 (0.0%) | 28 (34.2%) |
| $65,000 to $74,999 | 0 (0.0%) | 0 (0.0%) |
| $75,000 to $99,999 | 0 (0.0%) | 0 (0.0%) |
| $100,000+ | 0 (0.0%) | 0 (0.0%) |
| Total | 108 (100.0%) | 82 (100.0%) |
Earnings by Sex by Educational Attainment in Buena
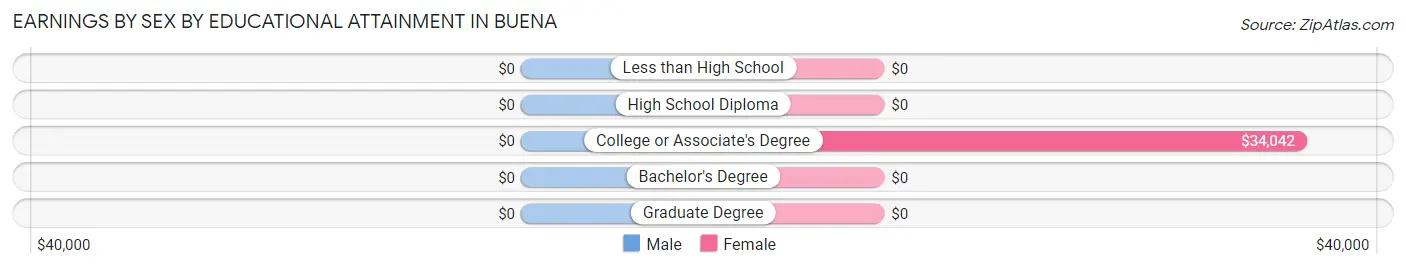
| Educational Attainment | Male Income | Female Income |
| Less than High School | - | - |
| High School Diploma | - | - |
| College or Associate's Degree | - | - |
| Bachelor's Degree | - | - |
| Graduate Degree | - | - |
| Total | $45,326 | $33,917 |
Family Income in Buena
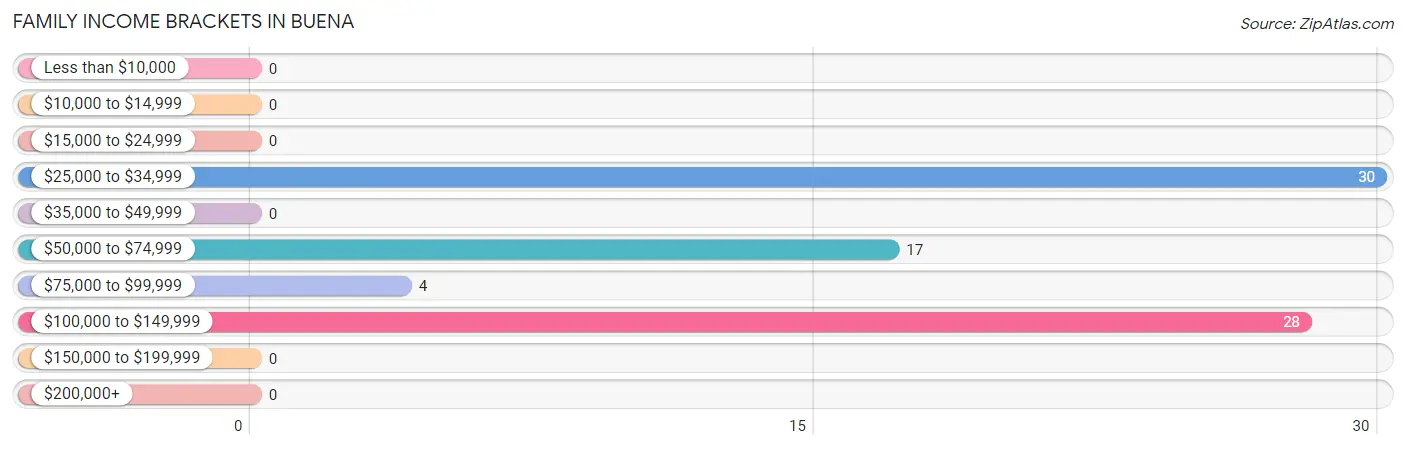
Family Income Brackets in Buena
According to the Buena family income data, there are 30 families falling into the $25,000 to $34,999 income range, which is the most common income bracket and makes up 38.0% of all families.
| Income Bracket | # Families | % Families |
| Less than $10,000 | 0 | 0.0% |
| $10,000 to $14,999 | 0 | 0.0% |
| $15,000 to $24,999 | 0 | 0.0% |
| $25,000 to $34,999 | 30 | 38.0% |
| $35,000 to $49,999 | 0 | 0.0% |
| $50,000 to $74,999 | 17 | 21.5% |
| $75,000 to $99,999 | 4 | 5.1% |
| $100,000 to $149,999 | 28 | 35.4% |
| $150,000 to $199,999 | 0 | 0.0% |
| $200,000+ | 0 | 0.0% |
Family Income by Famaliy Size in Buena
| Income Bracket | # Families | Median Income |
| 2-Person Families | 17 (21.5%) | $0 |
| 3-Person Families | 0 (0.0%) | $0 |
| 4-Person Families | 0 (0.0%) | $0 |
| 5-Person Families | 0 (0.0%) | $0 |
| 6-Person Families | 34 (43.0%) | $0 |
| 7+ Person Families | 28 (35.4%) | $0 |
| Total | 79 (100.0%) | $0 |
Family Income by Number of Earners in Buena
| Number of Earners | # Families | Median Income |
| No Earners | 0 (0.0%) | $0 |
| 1 Earner | 30 (38.0%) | $0 |
| 2 Earners | 17 (21.5%) | $0 |
| 3+ Earners | 32 (40.5%) | $0 |
| Total | 79 (100.0%) | $0 |
Household Income in Buena
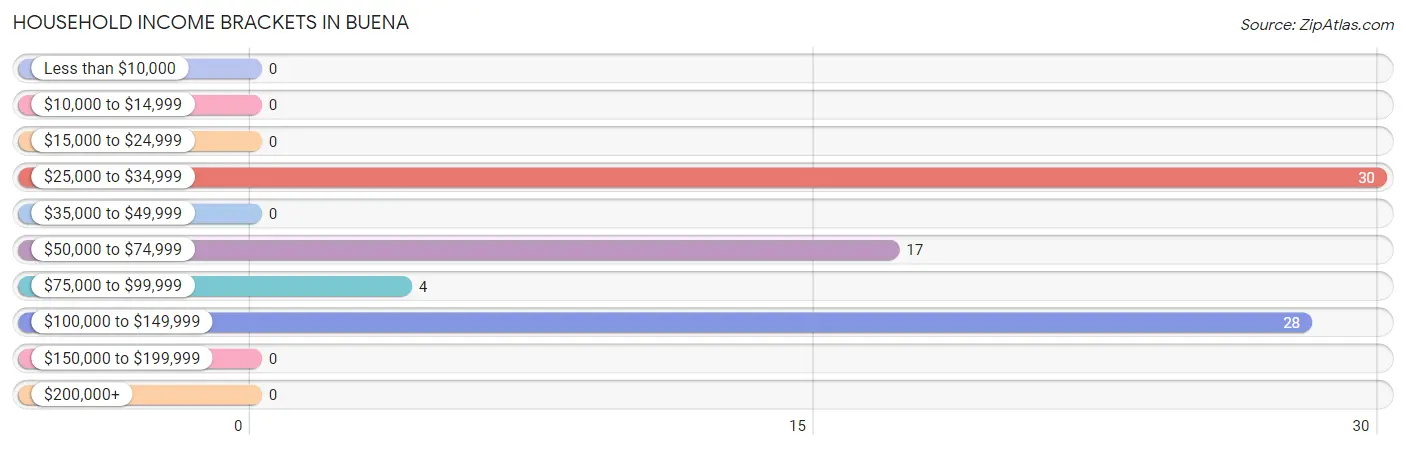
Household Income Brackets in Buena
With 30 households falling in the category, the $25,000 to $34,999 income range is the most frequent in Buena, accounting for 38.0% of all households.
| Income Bracket | # Households | % Households |
| Less than $10,000 | 0 | 0.0% |
| $10,000 to $14,999 | 0 | 0.0% |
| $15,000 to $24,999 | 0 | 0.0% |
| $25,000 to $34,999 | 30 | 38.0% |
| $35,000 to $49,999 | 0 | 0.0% |
| $50,000 to $74,999 | 17 | 21.5% |
| $75,000 to $99,999 | 4 | 5.1% |
| $100,000 to $149,999 | 28 | 35.4% |
| $150,000 to $199,999 | 0 | 0.0% |
| $200,000+ | 0 | 0.0% |
Household Income by Householder Age in Buena
| Income Bracket | # Households | Median Income |
| 15 to 24 Years | 0 (0.0%) | $0 |
| 25 to 44 Years | 75 (94.9%) | $0 |
| 45 to 64 Years | 4 (5.1%) | $0 |
| 65+ Years | 0 (0.0%) | $0 |
| Total | 79 (100.0%) | $0 |
Poverty in Buena
Income Below Poverty by Sex and Age in Buena
With 39.2% poverty level for males and 56.8% for females among the residents of Buena, 35 to 44 year old males and under 5 year old females are the most vulnerable to poverty, with 21 males (100.0%) and 40 females (100.0%) in their respective age groups living below the poverty level.
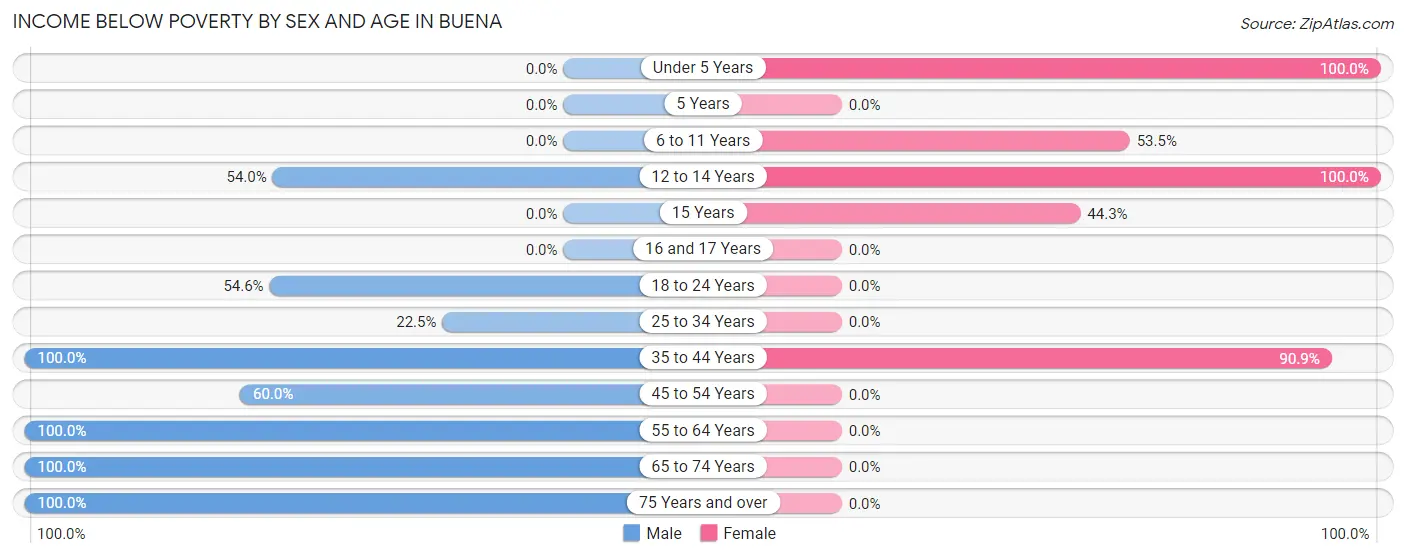
| Age Bracket | Male | Female |
| Under 5 Years | 0 (0.0%) | 40 (100.0%) |
| 5 Years | 0 (0.0%) | 0 (0.0%) |
| 6 to 11 Years | 0 (0.0%) | 31 (53.4%) |
| 12 to 14 Years | 34 (54.0%) | 30 (100.0%) |
| 15 Years | 0 (0.0%) | 31 (44.3%) |
| 16 and 17 Years | 0 (0.0%) | 0 (0.0%) |
| 18 to 24 Years | 6 (54.5%) | 0 (0.0%) |
| 25 to 34 Years | 20 (22.5%) | 0 (0.0%) |
| 35 to 44 Years | 21 (100.0%) | 30 (90.9%) |
| 45 to 54 Years | 6 (60.0%) | 0 (0.0%) |
| 55 to 64 Years | 7 (100.0%) | 0 (0.0%) |
| 65 to 74 Years | 3 (100.0%) | 0 (0.0%) |
| 75 Years and over | 4 (100.0%) | 0 (0.0%) |
| Total | 101 (39.2%) | 162 (56.8%) |
Income Above Poverty by Sex and Age in Buena
According to the poverty statistics in Buena, males aged under 5 years and females aged 18 to 24 years are the age groups that are most secure financially, with 100.0% of males and 100.0% of females in these age groups living above the poverty line.
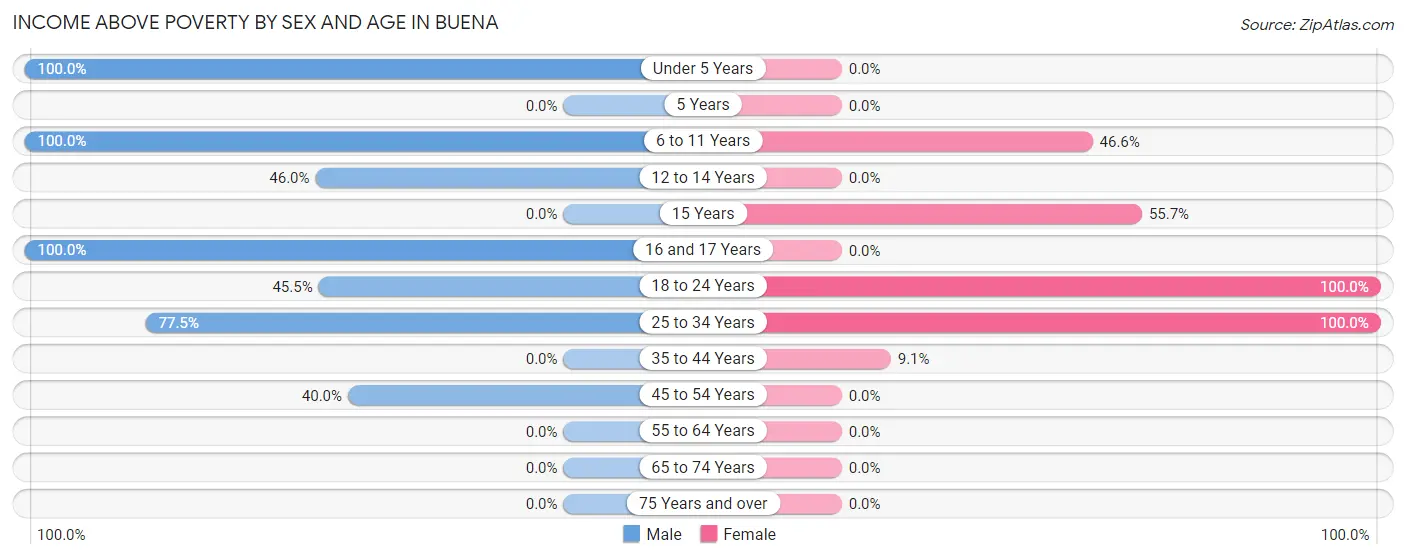
| Age Bracket | Male | Female |
| Under 5 Years | 4 (100.0%) | 0 (0.0%) |
| 5 Years | 0 (0.0%) | 0 (0.0%) |
| 6 to 11 Years | 4 (100.0%) | 27 (46.6%) |
| 12 to 14 Years | 29 (46.0%) | 0 (0.0%) |
| 15 Years | 0 (0.0%) | 39 (55.7%) |
| 16 and 17 Years | 42 (100.0%) | 0 (0.0%) |
| 18 to 24 Years | 5 (45.5%) | 5 (100.0%) |
| 25 to 34 Years | 69 (77.5%) | 49 (100.0%) |
| 35 to 44 Years | 0 (0.0%) | 3 (9.1%) |
| 45 to 54 Years | 4 (40.0%) | 0 (0.0%) |
| 55 to 64 Years | 0 (0.0%) | 0 (0.0%) |
| 65 to 74 Years | 0 (0.0%) | 0 (0.0%) |
| 75 Years and over | 0 (0.0%) | 0 (0.0%) |
| Total | 157 (60.9%) | 123 (43.2%) |
Income Below Poverty Among Married-Couple Families in Buena
| Children | Above Poverty | Below Poverty |
| No Children | 17 (100.0%) | 0 (0.0%) |
| 1 or 2 Children | 4 (100.0%) | 0 (0.0%) |
| 3 or 4 Children | 0 (0.0%) | 0 (0.0%) |
| 5 or more Children | 28 (100.0%) | 0 (0.0%) |
| Total | 49 (100.0%) | 0 (0.0%) |
Income Below Poverty Among Single-Parent Households in Buena
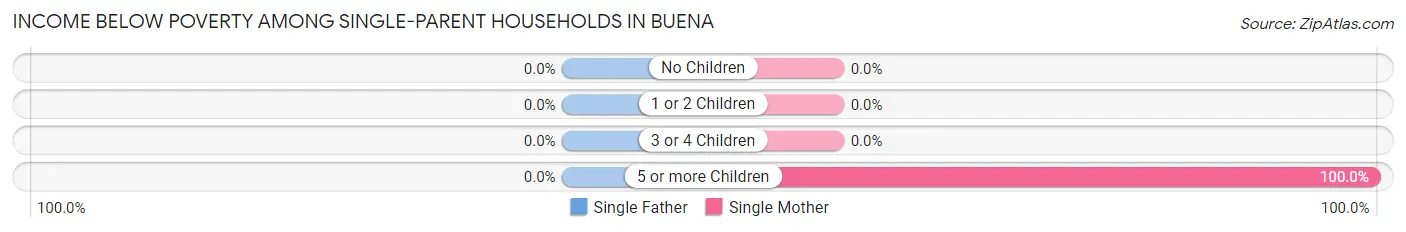
| Children | Single Father | Single Mother |
| No Children | 0 (0.0%) | 0 (0.0%) |
| 1 or 2 Children | 0 (0.0%) | 0 (0.0%) |
| 3 or 4 Children | 0 (0.0%) | 0 (0.0%) |
| 5 or more Children | 0 (0.0%) | 30 (100.0%) |
| Total | 0 (0.0%) | 30 (100.0%) |
Income Below Poverty Among Married-Couple vs Single-Parent Households in Buena
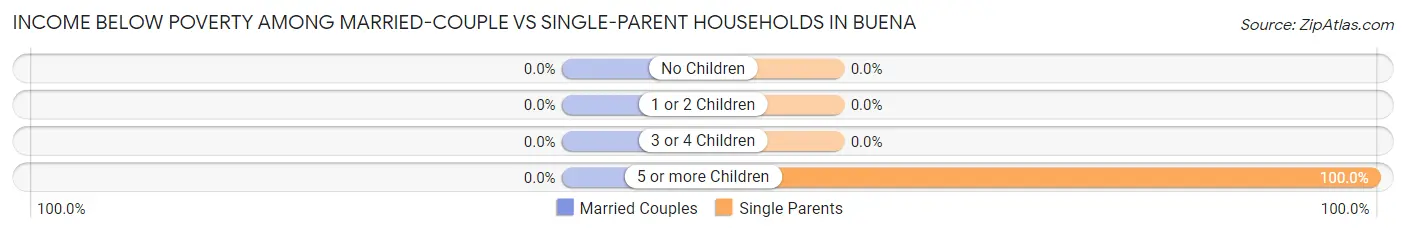
| Children | Married-Couple Families | Single-Parent Households |
| No Children | 0 (0.0%) | 0 (0.0%) |
| 1 or 2 Children | 0 (0.0%) | 0 (0.0%) |
| 3 or 4 Children | 0 (0.0%) | 0 (0.0%) |
| 5 or more Children | 0 (0.0%) | 30 (100.0%) |
| Total | 0 (0.0%) | 30 (100.0%) |
Race in Buena
The most populous races in Buena are White / Caucasian (498 | 91.7%), Hispanic or Latino (255 | 47.0%), and Some other Race (21 | 3.9%).
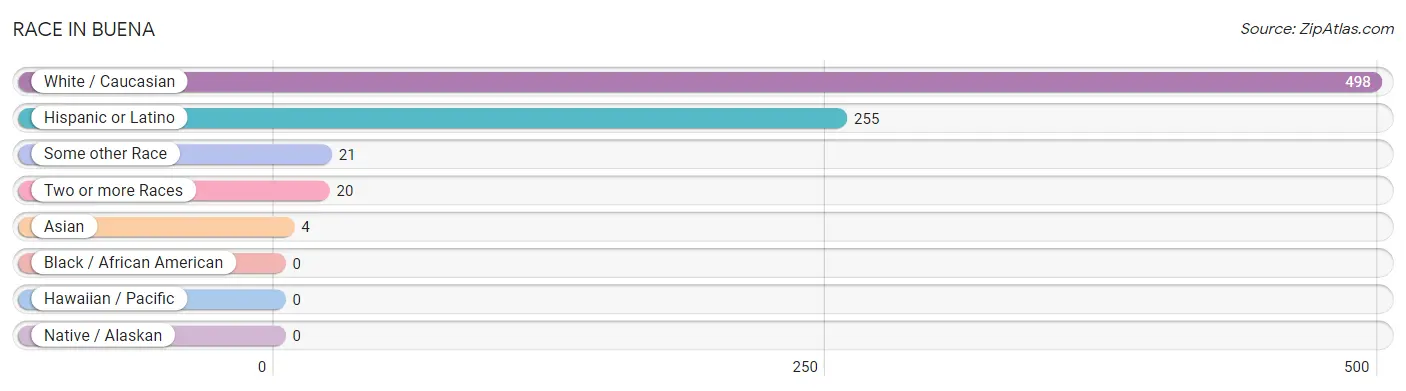
| Race | # Population | % Population |
| Asian | 4 | 0.7% |
| Black / African American | 0 | 0.0% |
| Hawaiian / Pacific | 0 | 0.0% |
| Hispanic or Latino | 255 | 47.0% |
| Native / Alaskan | 0 | 0.0% |
| White / Caucasian | 498 | 91.7% |
| Two or more Races | 20 | 3.7% |
| Some other Race | 21 | 3.9% |
| Total | 543 | 100.0% |
Ancestry in Buena
The most populous ancestries reported in Buena are Mexican (248 | 45.7%), Swedish (21 | 3.9%), German (19 | 3.5%), Canadian (17 | 3.1%), and English (13 | 2.4%), together accounting for 58.6% of all Buena residents.
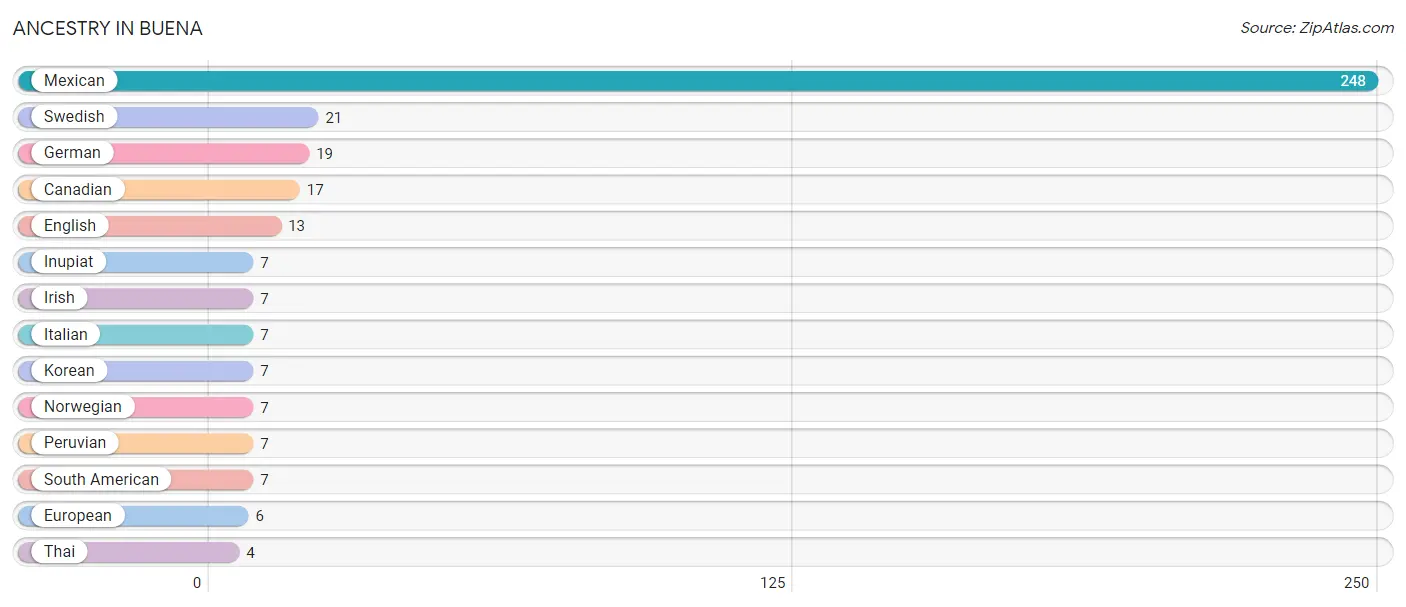
| Ancestry | # Population | % Population |
| Canadian | 17 | 3.1% |
| English | 13 | 2.4% |
| European | 6 | 1.1% |
| German | 19 | 3.5% |
| Inupiat | 7 | 1.3% |
| Irish | 7 | 1.3% |
| Italian | 7 | 1.3% |
| Korean | 7 | 1.3% |
| Mexican | 248 | 45.7% |
| Norwegian | 7 | 1.3% |
| Peruvian | 7 | 1.3% |
| South American | 7 | 1.3% |
| Swedish | 21 | 3.9% |
| Thai | 4 | 0.7% | View All 14 Rows |
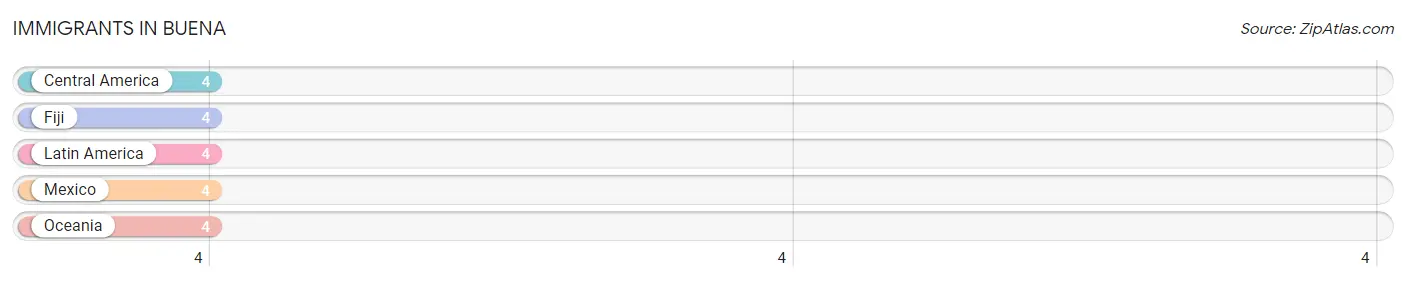
Immigrants in Buena
The most numerous immigrant groups reported in Buena came from Central America (4 | 0.7%), Fiji (4 | 0.7%), Latin America (4 | 0.7%), Mexico (4 | 0.7%), and Oceania (4 | 0.7%), together accounting for 3.7% of all Buena residents.
| Immigration Origin | # Population | % Population |
| Central America | 4 | 0.7% |
| Fiji | 4 | 0.7% |
| Latin America | 4 | 0.7% |
| Mexico | 4 | 0.7% |
| Oceania | 4 | 0.7% | View All 5 Rows |
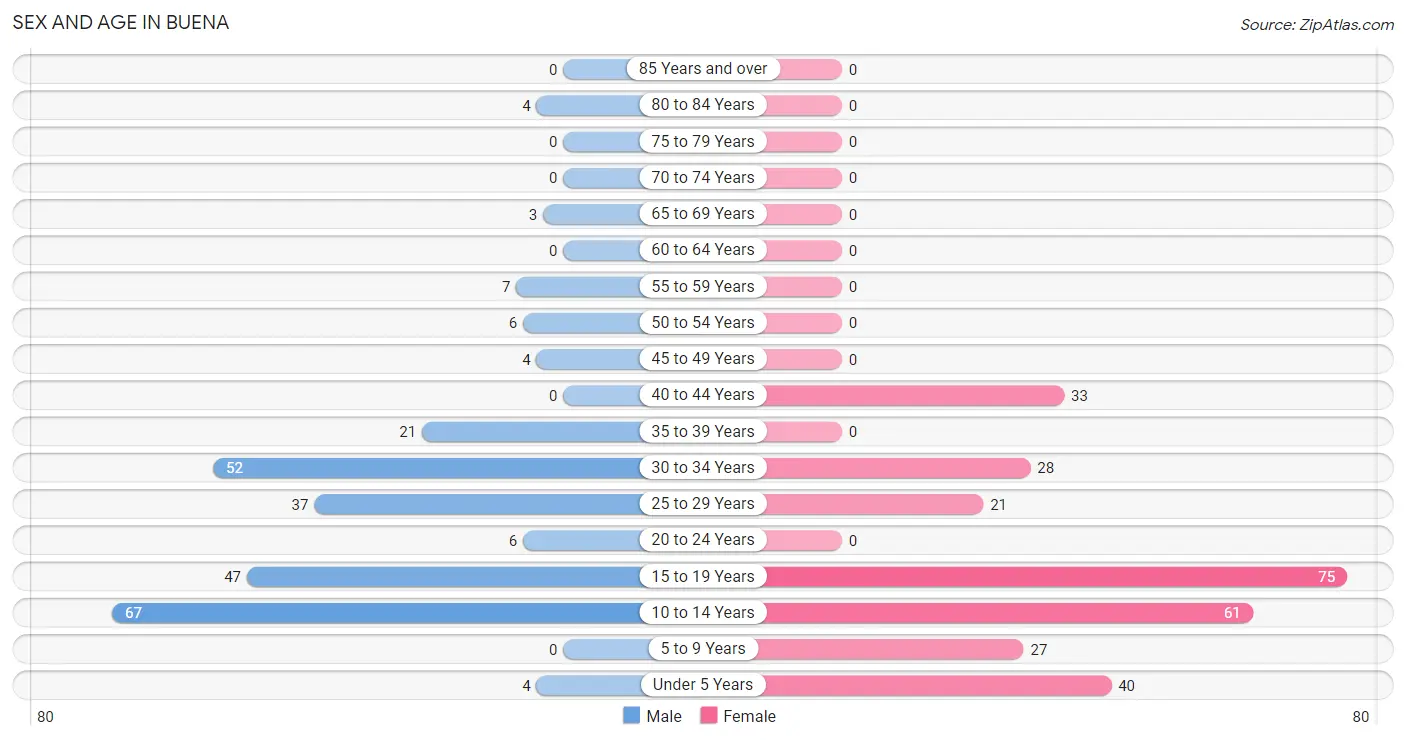
Sex and Age in Buena
Sex and Age in Buena
The most populous age groups in Buena are 10 to 14 Years (67 | 26.0%) for men and 15 to 19 Years (75 | 26.3%) for women.
| Age Bracket | Male | Female |
| Under 5 Years | 4 (1.5%) | 40 (14.0%) |
| 5 to 9 Years | 0 (0.0%) | 27 (9.5%) |
| 10 to 14 Years | 67 (26.0%) | 61 (21.4%) |
| 15 to 19 Years | 47 (18.2%) | 75 (26.3%) |
| 20 to 24 Years | 6 (2.3%) | 0 (0.0%) |
| 25 to 29 Years | 37 (14.3%) | 21 (7.4%) |
| 30 to 34 Years | 52 (20.2%) | 28 (9.8%) |
| 35 to 39 Years | 21 (8.1%) | 0 (0.0%) |
| 40 to 44 Years | 0 (0.0%) | 33 (11.6%) |
| 45 to 49 Years | 4 (1.5%) | 0 (0.0%) |
| 50 to 54 Years | 6 (2.3%) | 0 (0.0%) |
| 55 to 59 Years | 7 (2.7%) | 0 (0.0%) |
| 60 to 64 Years | 0 (0.0%) | 0 (0.0%) |
| 65 to 69 Years | 3 (1.2%) | 0 (0.0%) |
| 70 to 74 Years | 0 (0.0%) | 0 (0.0%) |
| 75 to 79 Years | 0 (0.0%) | 0 (0.0%) |
| 80 to 84 Years | 4 (1.5%) | 0 (0.0%) |
| 85 Years and over | 0 (0.0%) | 0 (0.0%) |
| Total | 258 (100.0%) | 285 (100.0%) |
Families and Households in Buena
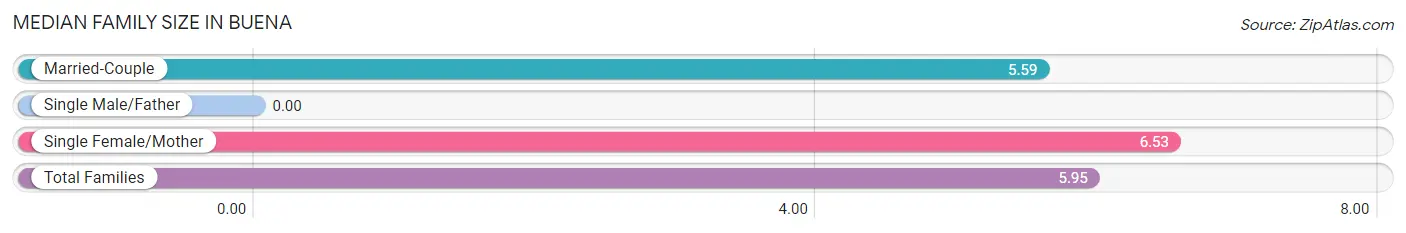
Median Family Size in Buena
| Family Type | # Families | Family Size |
| Married-Couple | 49 (62.0%) | 5.59 |
| Single Male/Father | 0 (0.0%) | - |
| Single Female/Mother | 30 (38.0%) | 6.53 |
| Total Families | 79 (100.0%) | 5.95 |
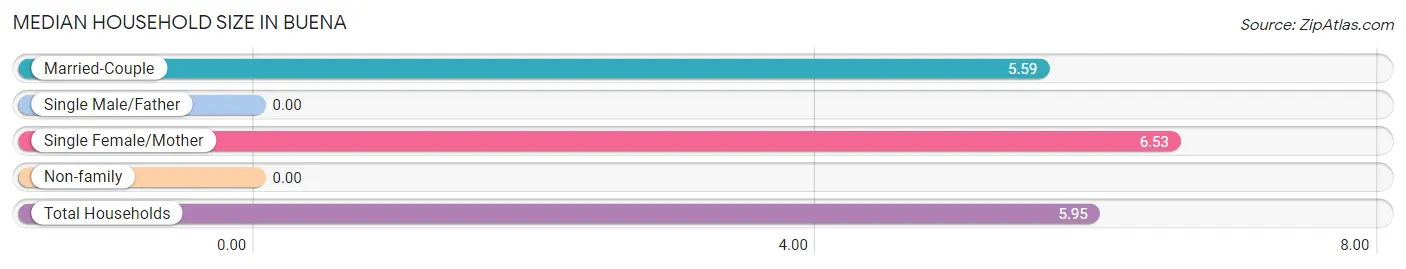
Median Household Size in Buena
| Household Type | # Households | Household Size |
| Married-Couple | 49 (62.0%) | 5.59 |
| Single Male/Father | 0 (0.0%) | - |
| Single Female/Mother | 30 (38.0%) | 6.53 |
| Non-family | 0 (0.0%) | - |
| Total Households | 79 (100.0%) | 5.95 |
Household Size by Marriage Status in Buena
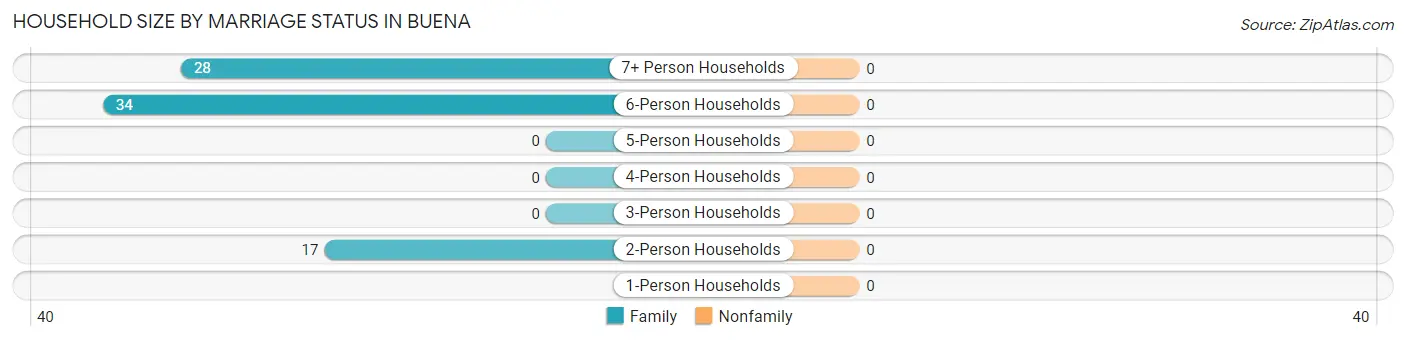
| Household Size | Family Households | Nonfamily Households |
| 1-Person Households | - | 0 (0.0%) |
| 2-Person Households | 17 (21.5%) | 0 (0.0%) |
| 3-Person Households | 0 (0.0%) | 0 (0.0%) |
| 4-Person Households | 0 (0.0%) | 0 (0.0%) |
| 5-Person Households | 0 (0.0%) | 0 (0.0%) |
| 6-Person Households | 34 (43.0%) | 0 (0.0%) |
| 7+ Person Households | 28 (35.4%) | 0 (0.0%) |
| Total | 79 (100.0%) | 0 (0.0%) |
Female Fertility in Buena
Fertility by Age in Buena
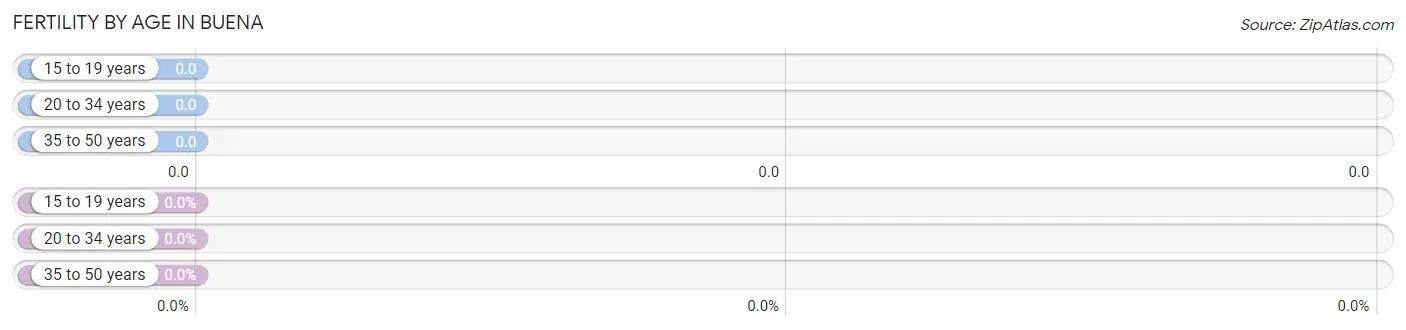
| Age Bracket | Women with Births | Births / 1,000 Women |
| 15 to 19 years | 0 (0.0%) | 0.0 |
| 20 to 34 years | 0 (0.0%) | 0.0 |
| 35 to 50 years | 0 (0.0%) | 0.0 |
| Total | 0 (0.0%) | 0.0 |
Fertility by Age by Marriage Status in Buena
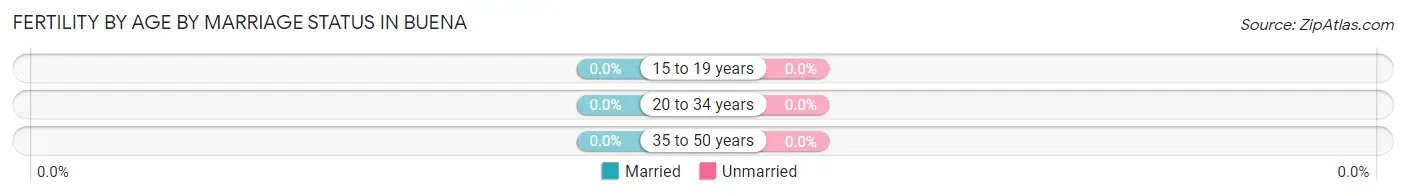
| Age Bracket | Married | Unmarried |
| 15 to 19 years | 0 (0.0%) | 0 (0.0%) |
| 20 to 34 years | 0 (0.0%) | 0 (0.0%) |
| 35 to 50 years | 0 (0.0%) | 0 (0.0%) |
| Total | 0 (0.0%) | 0 (0.0%) |
Fertility by Education in Buena
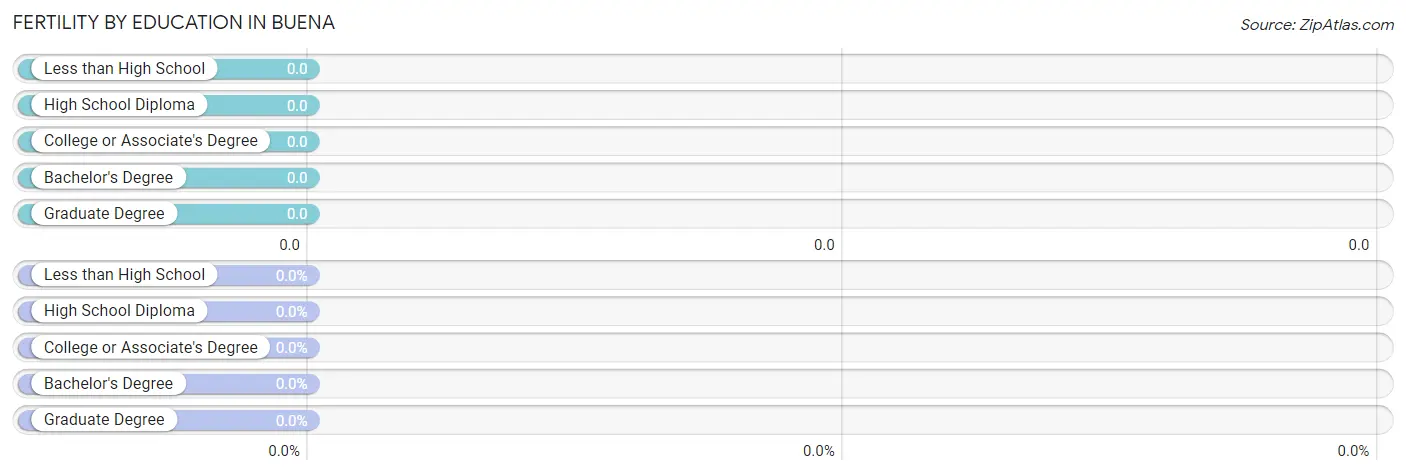
| Educational Attainment | Women with Births | Births / 1,000 Women |
| Less than High School | 0 (0.0%) | 0.0 |
| High School Diploma | 0 (0.0%) | 0.0 |
| College or Associate's Degree | 0 (0.0%) | 0.0 |
| Bachelor's Degree | 0 (0.0%) | 0.0 |
| Graduate Degree | 0 (0.0%) | 0.0 |
| Total | 0 (0.0%) | 0.0 |
Fertility by Education by Marriage Status in Buena
| Educational Attainment | Married | Unmarried |
| Less than High School | 0 (0.0%) | 0 (0.0%) |
| High School Diploma | 0 (0.0%) | 0 (0.0%) |
| College or Associate's Degree | 0 (0.0%) | 0 (0.0%) |
| Bachelor's Degree | 0 (0.0%) | 0 (0.0%) |
| Graduate Degree | 0 (0.0%) | 0 (0.0%) |
| Total | 0 (0.0%) | 0 (0.0%) |
Employment Characteristics in Buena
Employment by Class of Employer in Buena
Among the 178 employed individuals in Buena, private company employees (120 | 67.4%), state government employees (30 | 16.9%), and not-for-profit organizations (28 | 15.7%) make up the most common classes of employment.
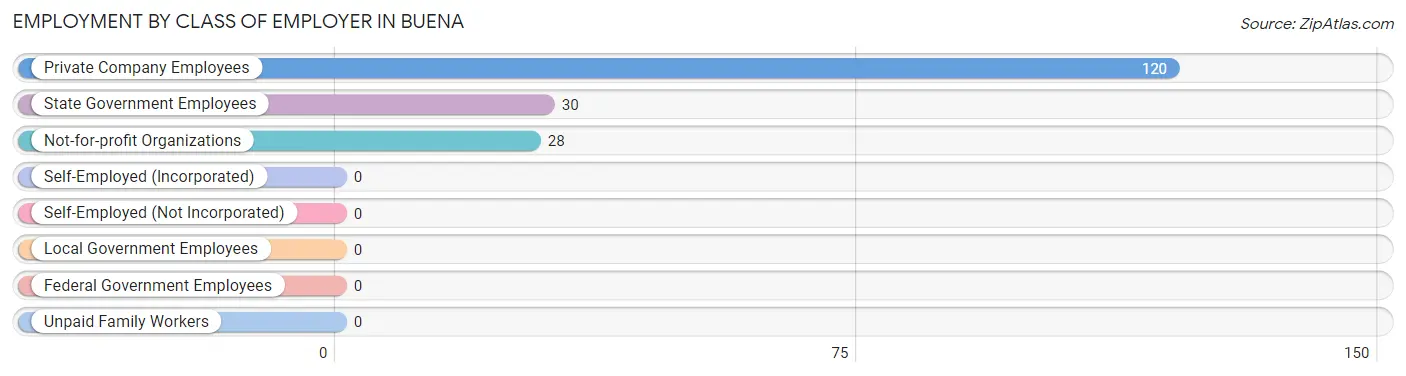
| Employer Class | # Employees | % Employees |
| Private Company Employees | 120 | 67.4% |
| Self-Employed (Incorporated) | 0 | 0.0% |
| Self-Employed (Not Incorporated) | 0 | 0.0% |
| Not-for-profit Organizations | 28 | 15.7% |
| Local Government Employees | 0 | 0.0% |
| State Government Employees | 30 | 16.9% |
| Federal Government Employees | 0 | 0.0% |
| Unpaid Family Workers | 0 | 0.0% |
| Total | 178 | 100.0% |
Employment Status by Age in Buena
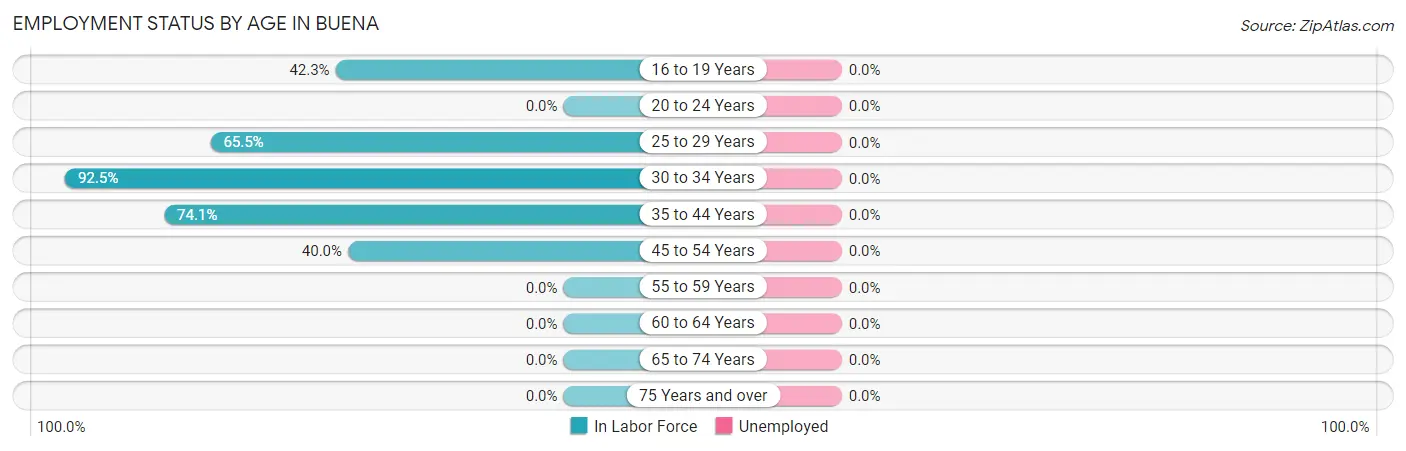
| Age Bracket | In Labor Force | Unemployed |
| 16 to 19 Years | 22 (42.3%) | 0 (0.0%) |
| 20 to 24 Years | 0 (0.0%) | 0 (0.0%) |
| 25 to 29 Years | 38 (65.5%) | 0 (0.0%) |
| 30 to 34 Years | 74 (92.5%) | 0 (0.0%) |
| 35 to 44 Years | 40 (74.1%) | 0 (0.0%) |
| 45 to 54 Years | 4 (40.0%) | 0 (0.0%) |
| 55 to 59 Years | 0 (0.0%) | 0 (0.0%) |
| 60 to 64 Years | 0 (0.0%) | 0 (0.0%) |
| 65 to 74 Years | 0 (0.0%) | 0 (0.0%) |
| 75 Years and over | 0 (0.0%) | 0 (0.0%) |
| Total | 178 (65.0%) | 0 (0.0%) |
Employment Status by Educational Attainment in Buena
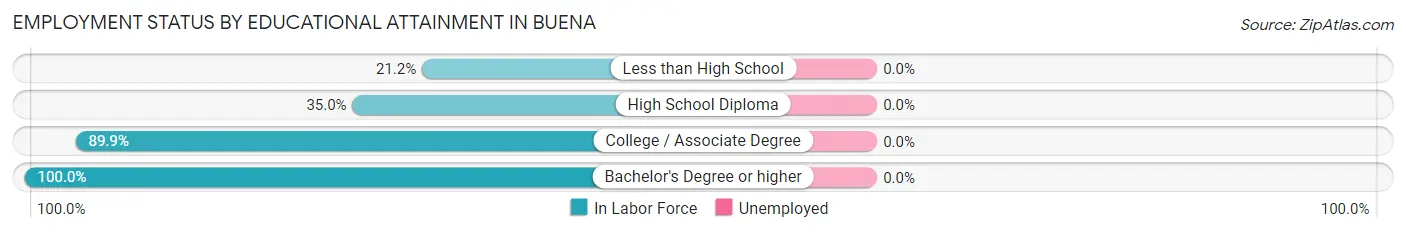
| Educational Attainment | In Labor Force | Unemployed |
| Less than High School | 7 (21.2%) | 0 (0.0%) |
| High School Diploma | 7 (35.0%) | 0 (0.0%) |
| College / Associate Degree | 125 (89.9%) | 0 (0.0%) |
| Bachelor's Degree or higher | 17 (100.0%) | 0 (0.0%) |
| Total | 156 (74.6%) | 0 (0.0%) |
Employment Occupations by Sex in Buena
Management, Business, Science and Arts Occupations
The most common Management, Business, Science and Arts occupations in Buena are Business & Financial (38 | 21.3%), and Management (28 | 15.7%).
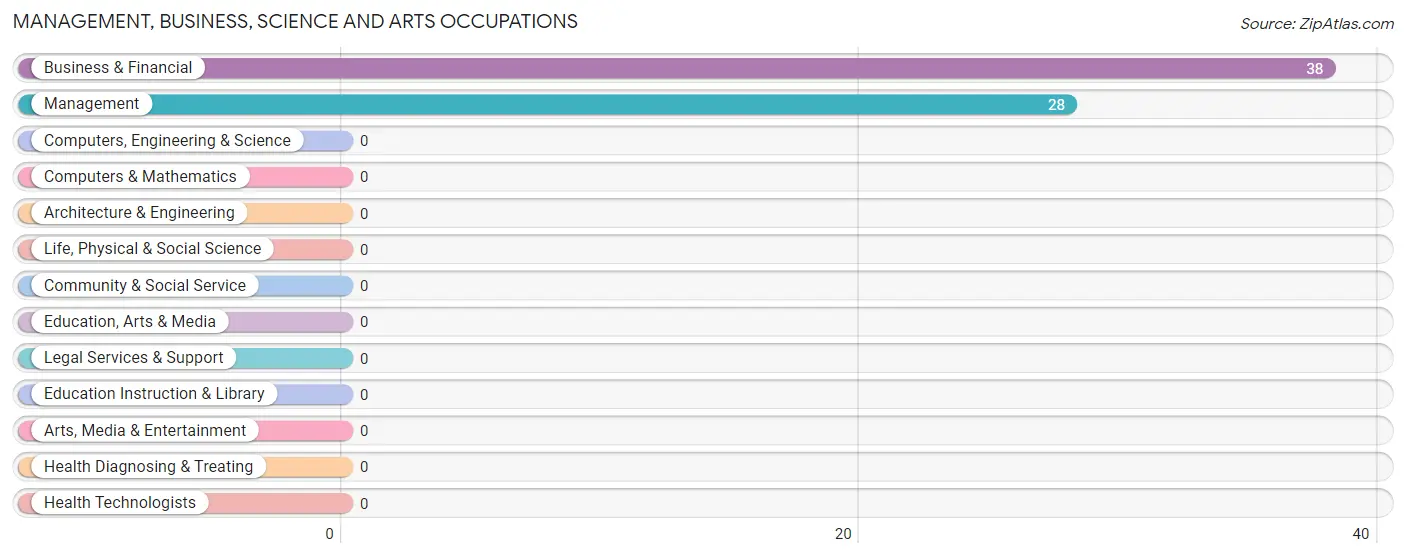
Management, Business, Science and Arts Occupations by Sex
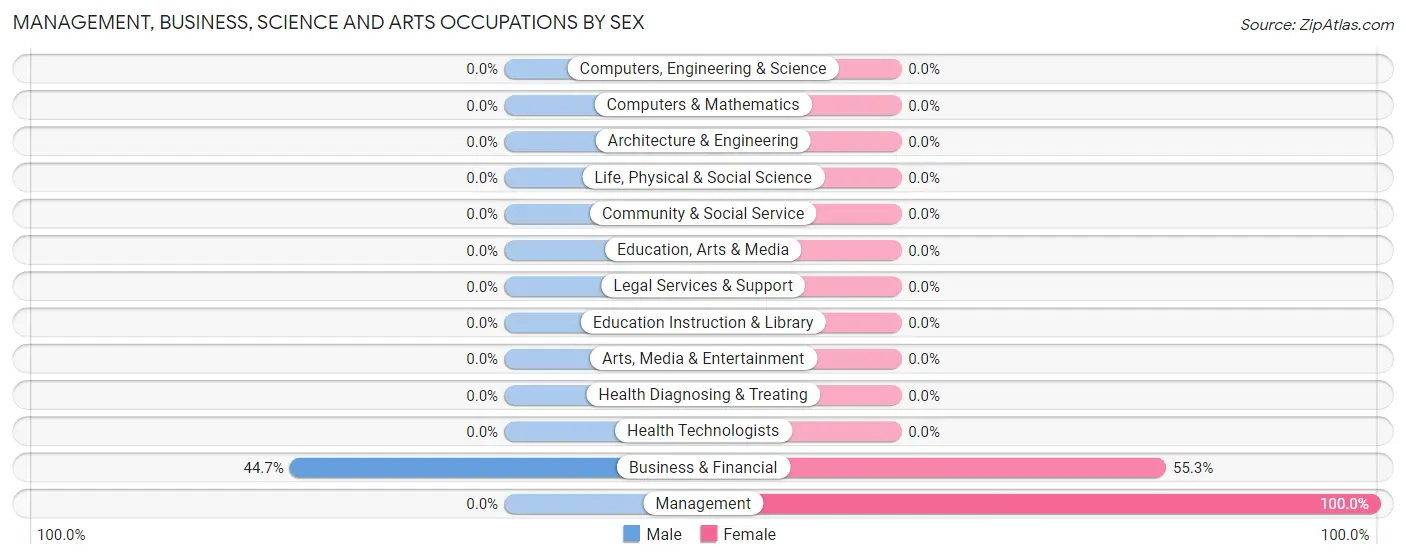
| Occupation | Male | Female |
| Management | 0 (0.0%) | 28 (100.0%) |
| Business & Financial | 17 (44.7%) | 21 (55.3%) |
| Computers, Engineering & Science | 0 (0.0%) | 0 (0.0%) |
| Computers & Mathematics | 0 (0.0%) | 0 (0.0%) |
| Architecture & Engineering | 0 (0.0%) | 0 (0.0%) |
| Life, Physical & Social Science | 0 (0.0%) | 0 (0.0%) |
| Community & Social Service | 0 (0.0%) | 0 (0.0%) |
| Education, Arts & Media | 0 (0.0%) | 0 (0.0%) |
| Legal Services & Support | 0 (0.0%) | 0 (0.0%) |
| Education Instruction & Library | 0 (0.0%) | 0 (0.0%) |
| Arts, Media & Entertainment | 0 (0.0%) | 0 (0.0%) |
| Health Diagnosing & Treating | 0 (0.0%) | 0 (0.0%) |
| Health Technologists | 0 (0.0%) | 0 (0.0%) |
| Total (Category) | 17 (25.8%) | 49 (74.2%) |
| Total (Overall) | 96 (53.9%) | 82 (46.1%) |
Services Occupations
The most common Services occupations in Buena are , and Food Preparation & Serving (5 | 2.8%).
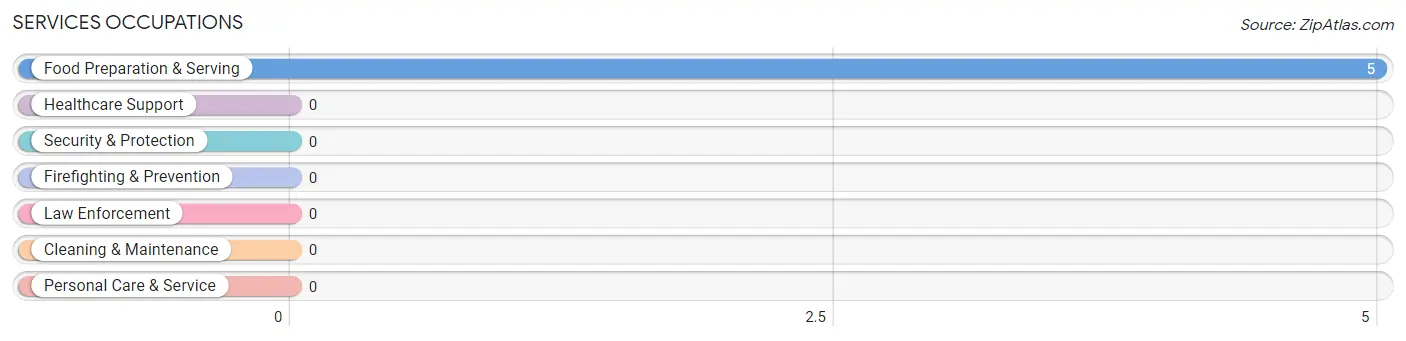
Services Occupations by Sex
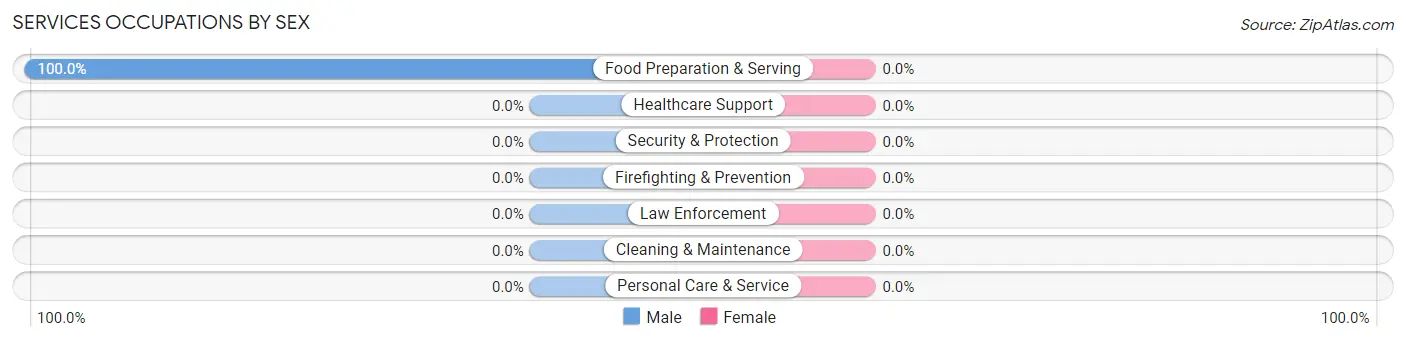
| Occupation | Male | Female |
| Healthcare Support | 0 (0.0%) | 0 (0.0%) |
| Security & Protection | 0 (0.0%) | 0 (0.0%) |
| Firefighting & Prevention | 0 (0.0%) | 0 (0.0%) |
| Law Enforcement | 0 (0.0%) | 0 (0.0%) |
| Food Preparation & Serving | 5 (100.0%) | 0 (0.0%) |
| Cleaning & Maintenance | 0 (0.0%) | 0 (0.0%) |
| Personal Care & Service | 0 (0.0%) | 0 (0.0%) |
| Total (Category) | 5 (100.0%) | 0 (0.0%) |
| Total (Overall) | 96 (53.9%) | 82 (46.1%) |
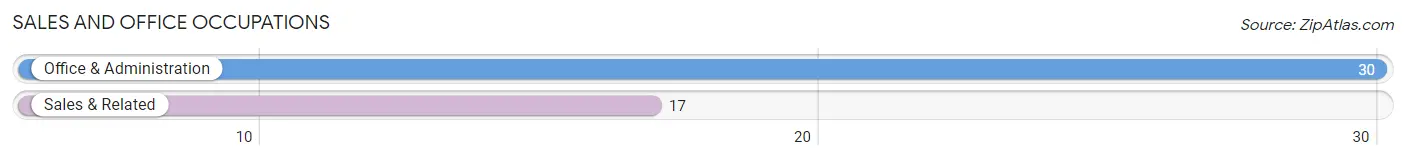
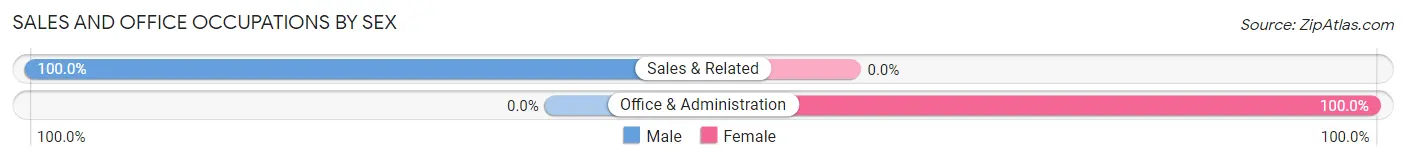
Sales and Office Occupations
The most common Sales and Office occupations in Buena are Office & Administration (30 | 16.9%), and Sales & Related (17 | 9.6%).
Sales and Office Occupations by Sex
| Occupation | Male | Female |
| Sales & Related | 17 (100.0%) | 0 (0.0%) |
| Office & Administration | 0 (0.0%) | 30 (100.0%) |
| Total (Category) | 17 (36.2%) | 30 (63.8%) |
| Total (Overall) | 96 (53.9%) | 82 (46.1%) |
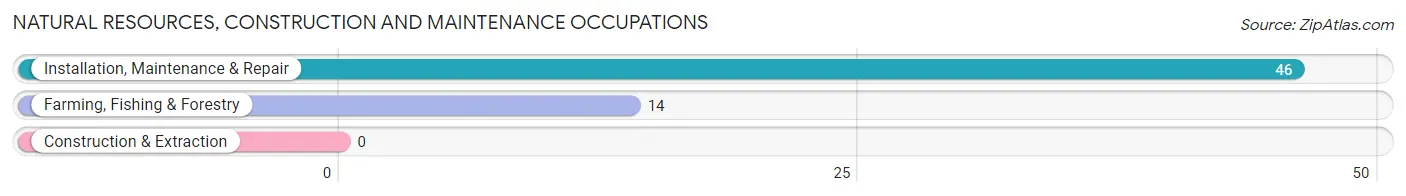
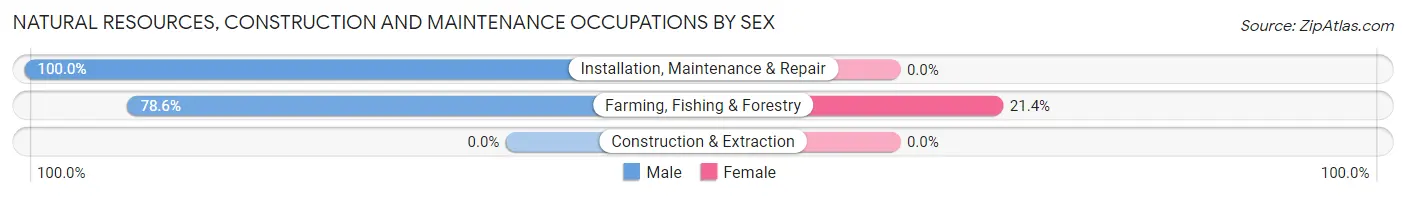
Natural Resources, Construction and Maintenance Occupations
The most common Natural Resources, Construction and Maintenance occupations in Buena are Installation, Maintenance & Repair (46 | 25.8%), and Farming, Fishing & Forestry (14 | 7.9%).
Natural Resources, Construction and Maintenance Occupations by Sex
| Occupation | Male | Female |
| Farming, Fishing & Forestry | 11 (78.6%) | 3 (21.4%) |
| Construction & Extraction | 0 (0.0%) | 0 (0.0%) |
| Installation, Maintenance & Repair | 46 (100.0%) | 0 (0.0%) |
| Total (Category) | 57 (95.0%) | 3 (5.0%) |
| Total (Overall) | 96 (53.9%) | 82 (46.1%) |
Production, Transportation and Moving Occupations
Production, Transportation and Moving Occupations by Sex
| Occupation | Male | Female |
| Production | 0 (0.0%) | 0 (0.0%) |
| Transportation | 0 (0.0%) | 0 (0.0%) |
| Material Moving | 0 (0.0%) | 0 (0.0%) |
| Total (Category) | 0 (0.0%) | 0 (0.0%) |
| Total (Overall) | 96 (53.9%) | 82 (46.1%) |
Employment Industries by Sex in Buena
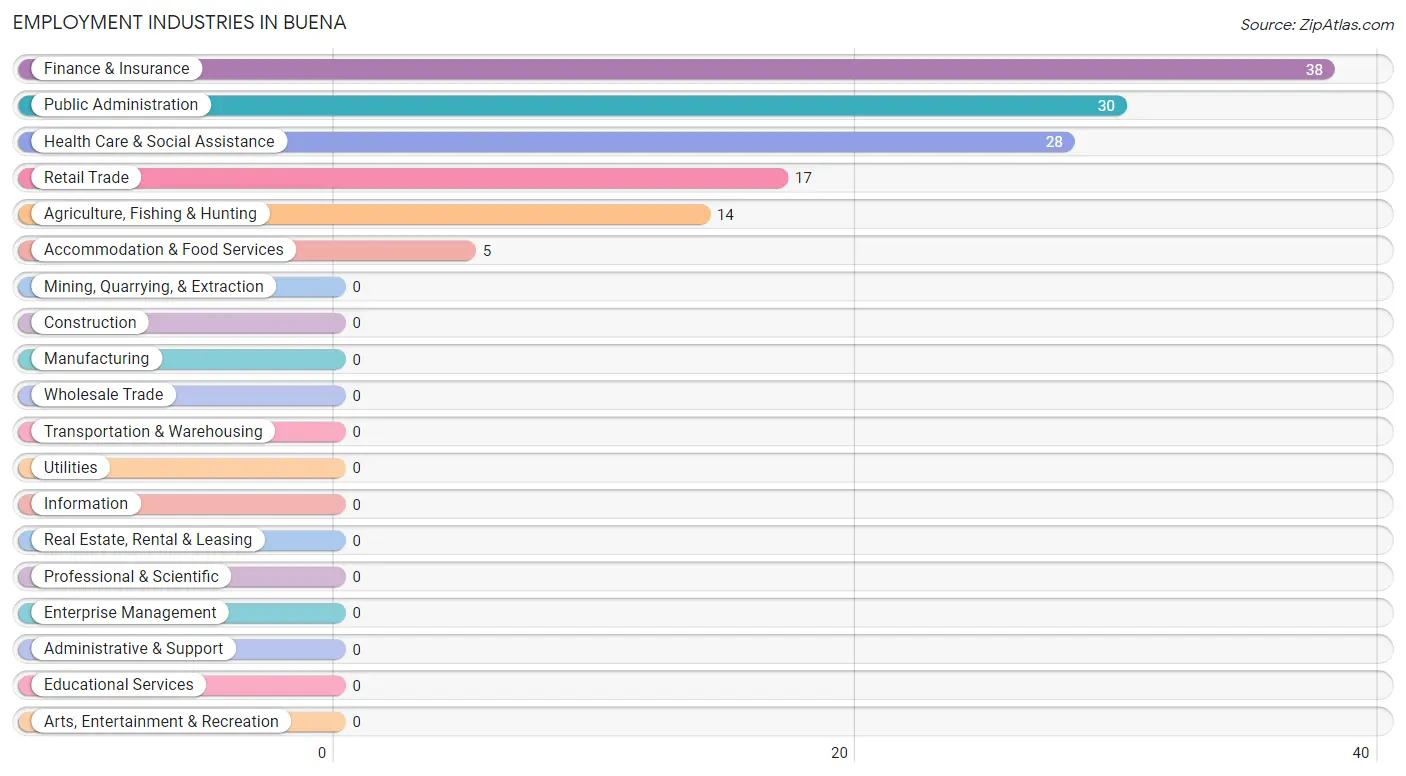
Employment Industries in Buena
The major employment industries in Buena include Finance & Insurance (38 | 21.3%), Public Administration (30 | 16.9%), Health Care & Social Assistance (28 | 15.7%), Retail Trade (17 | 9.6%), and Agriculture, Fishing & Hunting (14 | 7.9%).
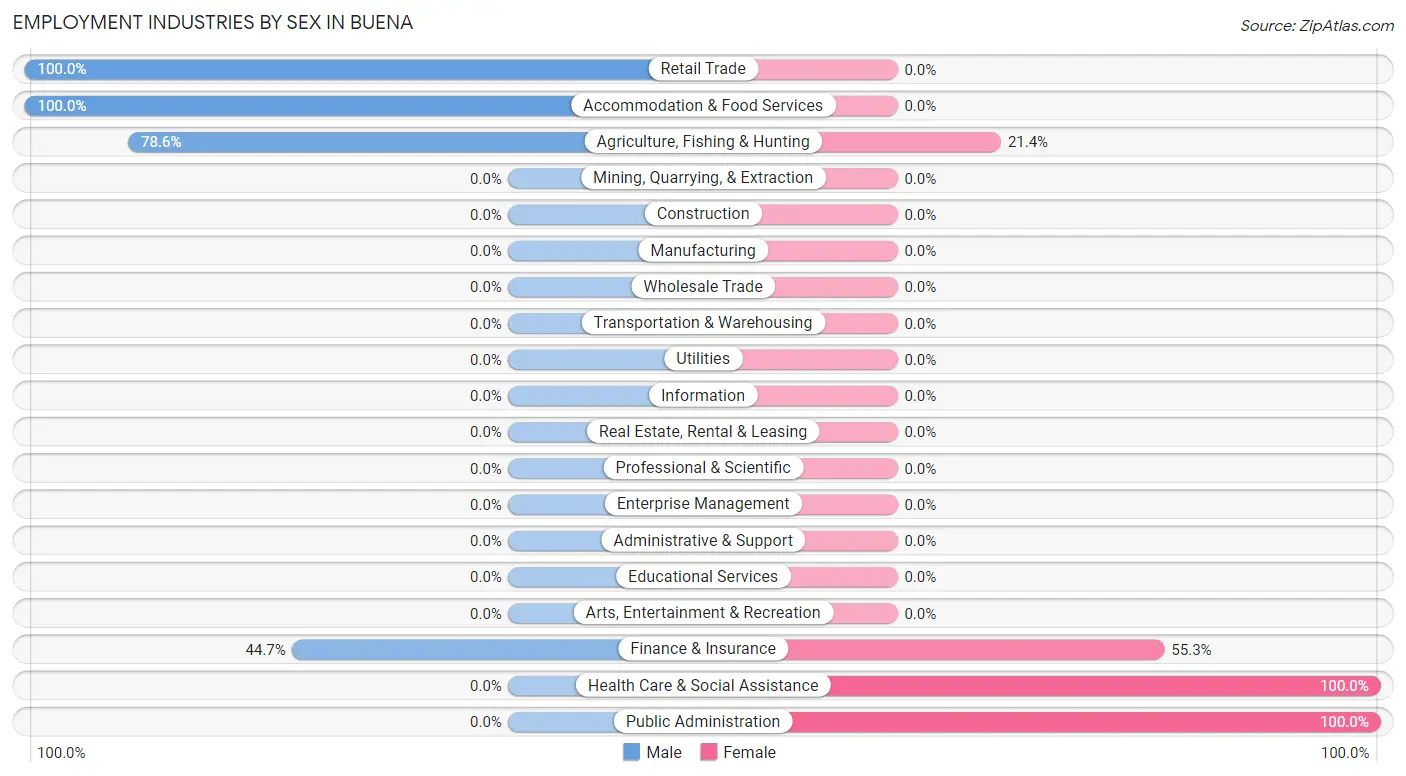
Employment Industries by Sex in Buena
The Buena industries that see more men than women are Retail Trade (100.0%), Accommodation & Food Services (100.0%), and Agriculture, Fishing & Hunting (78.6%), whereas the industries that tend to have a higher number of women are Health Care & Social Assistance (100.0%), Public Administration (100.0%), and Finance & Insurance (55.3%).
| Industry | Male | Female |
| Agriculture, Fishing & Hunting | 11 (78.6%) | 3 (21.4%) |
| Mining, Quarrying, & Extraction | 0 (0.0%) | 0 (0.0%) |
| Construction | 0 (0.0%) | 0 (0.0%) |
| Manufacturing | 0 (0.0%) | 0 (0.0%) |
| Wholesale Trade | 0 (0.0%) | 0 (0.0%) |
| Retail Trade | 17 (100.0%) | 0 (0.0%) |
| Transportation & Warehousing | 0 (0.0%) | 0 (0.0%) |
| Utilities | 0 (0.0%) | 0 (0.0%) |
| Information | 0 (0.0%) | 0 (0.0%) |
| Finance & Insurance | 17 (44.7%) | 21 (55.3%) |
| Real Estate, Rental & Leasing | 0 (0.0%) | 0 (0.0%) |
| Professional & Scientific | 0 (0.0%) | 0 (0.0%) |
| Enterprise Management | 0 (0.0%) | 0 (0.0%) |
| Administrative & Support | 0 (0.0%) | 0 (0.0%) |
| Educational Services | 0 (0.0%) | 0 (0.0%) |
| Health Care & Social Assistance | 0 (0.0%) | 28 (100.0%) |
| Arts, Entertainment & Recreation | 0 (0.0%) | 0 (0.0%) |
| Accommodation & Food Services | 5 (100.0%) | 0 (0.0%) |
| Public Administration | 0 (0.0%) | 30 (100.0%) |
| Total | 96 (53.9%) | 82 (46.1%) |
Education in Buena
School Enrollment in Buena
The most common levels of schooling among the 233 students in Buena are high school (146 | 62.7%), elementary school (58 | 24.9%), and middle school (29 | 12.4%).
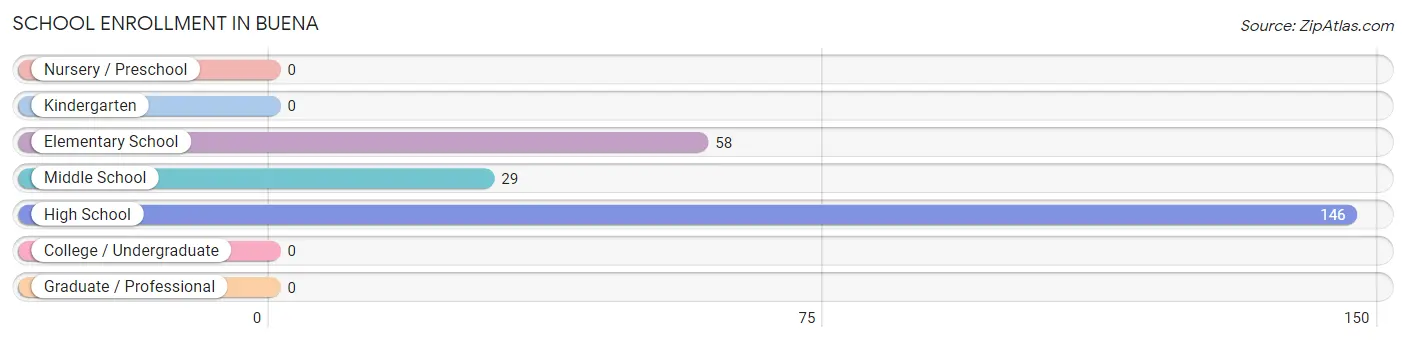
| School Level | # Students | % Students |
| Nursery / Preschool | 0 | 0.0% |
| Kindergarten | 0 | 0.0% |
| Elementary School | 58 | 24.9% |
| Middle School | 29 | 12.4% |
| High School | 146 | 62.7% |
| College / Undergraduate | 0 | 0.0% |
| Graduate / Professional | 0 | 0.0% |
| Total | 233 | 100.0% |
School Enrollment by Age by Funding Source in Buena
Out of a total of 233 students who are enrolled in schools in Buena, 39 (16.7%) attend a private institution, while the remaining 194 (83.3%) are enrolled in public schools. The age group of 15 to 17 year olds has the highest likelihood of being enrolled in private schools, with 39 (34.8% in the age bracket) enrolled. Conversely, the age group of 5 to 9 year old has the lowest likelihood of being enrolled in a private school, with 27 (100.0% in the age bracket) attending a public institution.
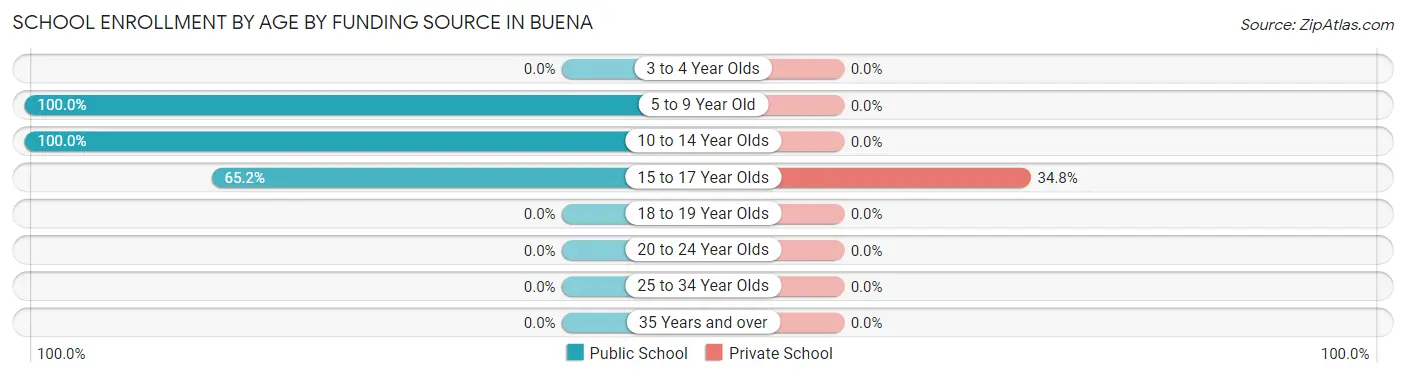
| Age Bracket | Public School | Private School |
| 3 to 4 Year Olds | 0 (0.0%) | 0 (0.0%) |
| 5 to 9 Year Old | 27 (100.0%) | 0 (0.0%) |
| 10 to 14 Year Olds | 94 (100.0%) | 0 (0.0%) |
| 15 to 17 Year Olds | 73 (65.2%) | 39 (34.8%) |
| 18 to 19 Year Olds | 0 (0.0%) | 0 (0.0%) |
| 20 to 24 Year Olds | 0 (0.0%) | 0 (0.0%) |
| 25 to 34 Year Olds | 0 (0.0%) | 0 (0.0%) |
| 35 Years and over | 0 (0.0%) | 0 (0.0%) |
| Total | 194 (83.3%) | 39 (16.7%) |
Educational Attainment by Field of Study in Buena
, and business (17 | 100.0%) are the most common fields of study among 17 individuals in Buena who have obtained a bachelor's degree or higher.
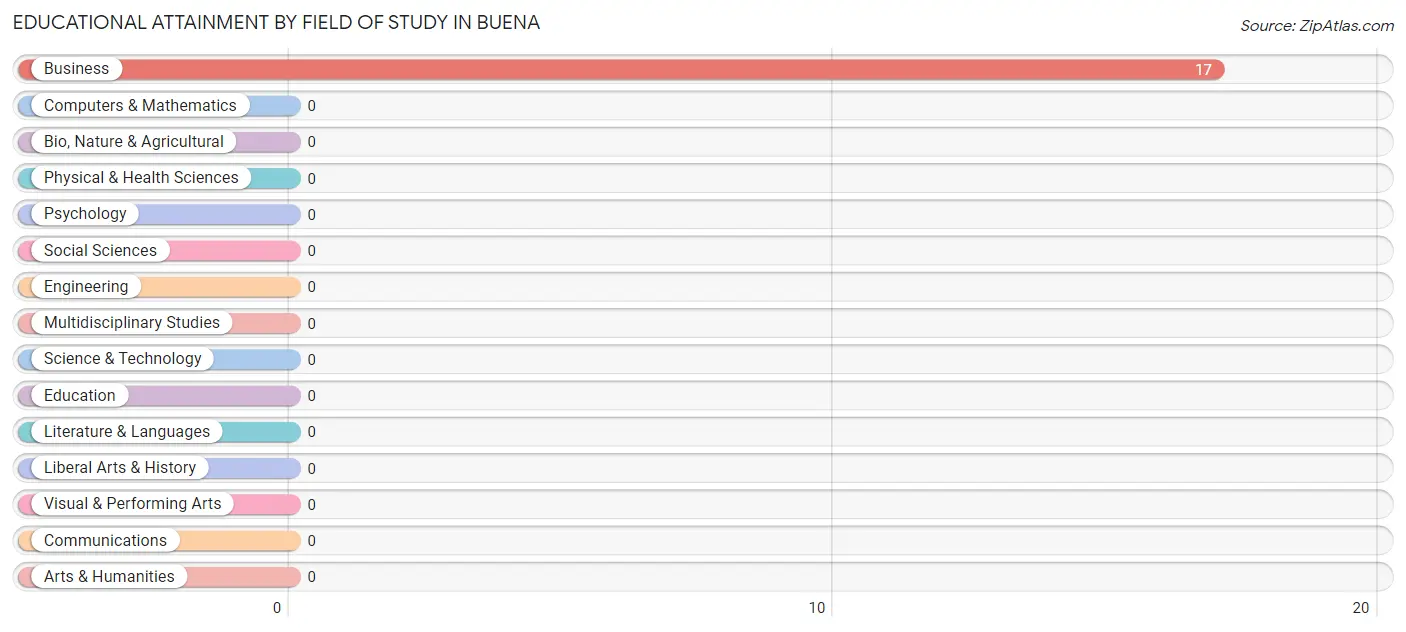
| Field of Study | # Graduates | % Graduates |
| Computers & Mathematics | 0 | 0.0% |
| Bio, Nature & Agricultural | 0 | 0.0% |
| Physical & Health Sciences | 0 | 0.0% |
| Psychology | 0 | 0.0% |
| Social Sciences | 0 | 0.0% |
| Engineering | 0 | 0.0% |
| Multidisciplinary Studies | 0 | 0.0% |
| Science & Technology | 0 | 0.0% |
| Business | 17 | 100.0% |
| Education | 0 | 0.0% |
| Literature & Languages | 0 | 0.0% |
| Liberal Arts & History | 0 | 0.0% |
| Visual & Performing Arts | 0 | 0.0% |
| Communications | 0 | 0.0% |
| Arts & Humanities | 0 | 0.0% |
| Total | 17 | 100.0% |
Transportation & Commute in Buena
Vehicle Availability by Sex in Buena
The most prevalent vehicle ownership categories in Buena are males with 2 vehicles (63, accounting for 70.8%) and females with 2 vehicles (28, making up 76.8%).
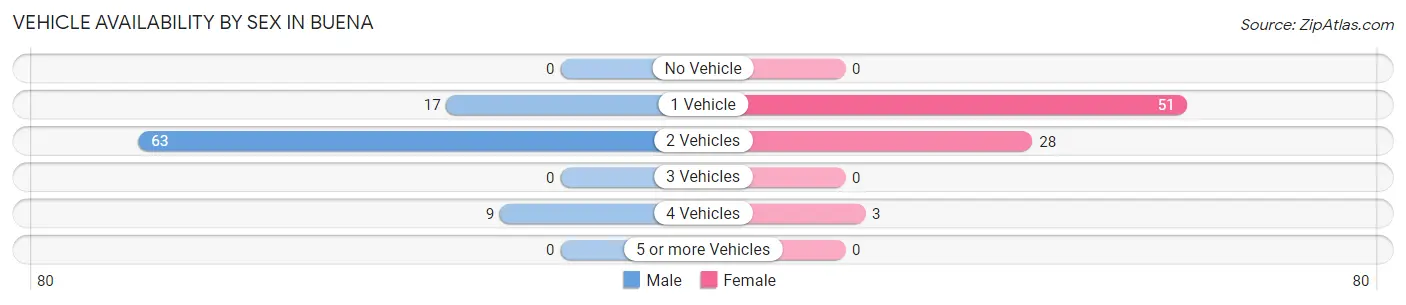
| Vehicles Available | Male | Female |
| No Vehicle | 0 (0.0%) | 0 (0.0%) |
| 1 Vehicle | 17 (19.1%) | 51 (62.2%) |
| 2 Vehicles | 63 (70.8%) | 28 (34.2%) |
| 3 Vehicles | 0 (0.0%) | 0 (0.0%) |
| 4 Vehicles | 9 (10.1%) | 3 (3.7%) |
| 5 or more Vehicles | 0 (0.0%) | 0 (0.0%) |
| Total | 89 (100.0%) | 82 (100.0%) |
Commute Time in Buena
The most frequently occuring commute durations in Buena are 30 to 34 minutes (61 commuters, 34.3%), 15 to 19 minutes (46 commuters, 25.8%), and less than 5 minutes (28 commuters, 15.7%).
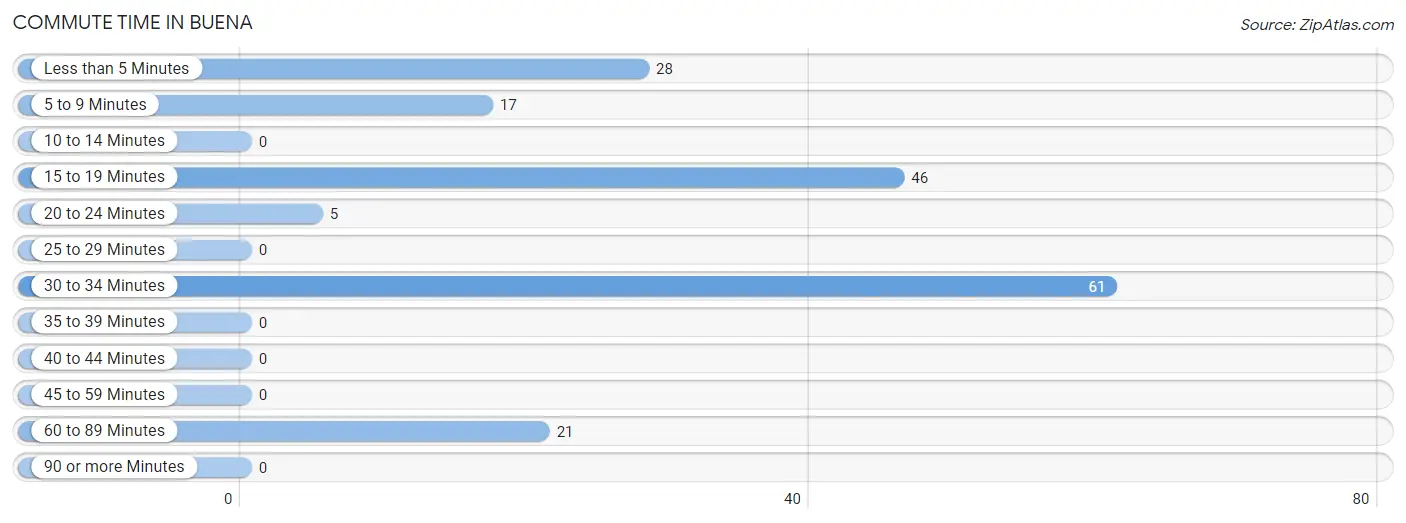
| Commute Time | # Commuters | % Commuters |
| Less than 5 Minutes | 28 | 15.7% |
| 5 to 9 Minutes | 17 | 9.6% |
| 10 to 14 Minutes | 0 | 0.0% |
| 15 to 19 Minutes | 46 | 25.8% |
| 20 to 24 Minutes | 5 | 2.8% |
| 25 to 29 Minutes | 0 | 0.0% |
| 30 to 34 Minutes | 61 | 34.3% |
| 35 to 39 Minutes | 0 | 0.0% |
| 40 to 44 Minutes | 0 | 0.0% |
| 45 to 59 Minutes | 0 | 0.0% |
| 60 to 89 Minutes | 21 | 11.8% |
| 90 or more Minutes | 0 | 0.0% |
Commute Time by Sex in Buena
The most common commute times in Buena are 15 to 19 minutes (46 commuters, 47.9%) for males and 30 to 34 minutes (33 commuters, 40.2%) for females.
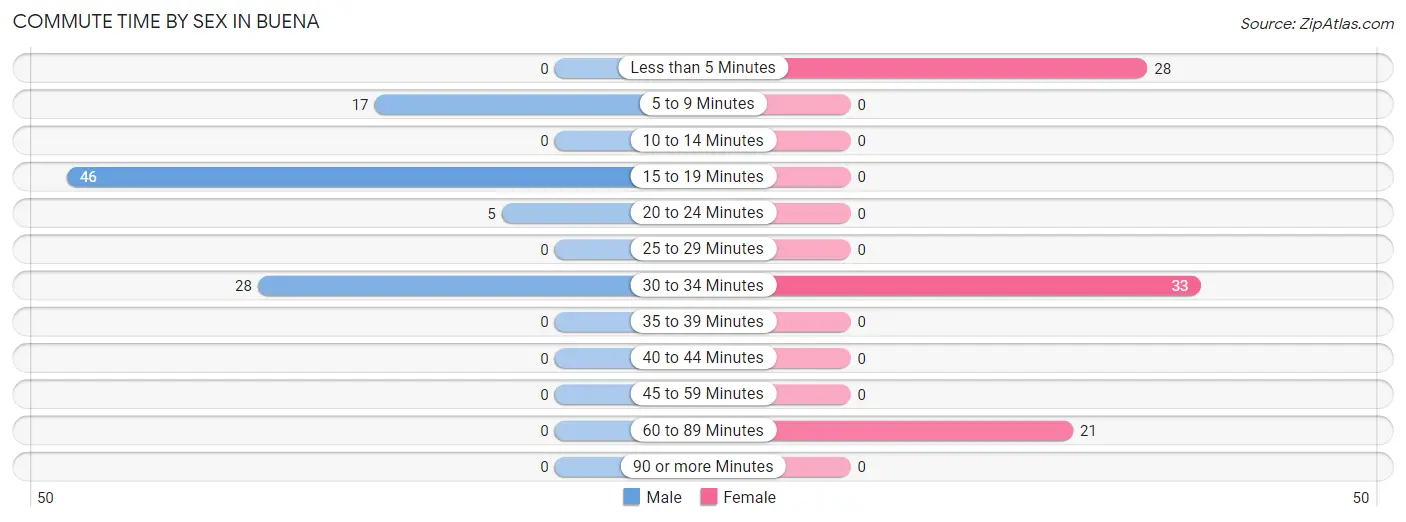
| Commute Time | Male | Female |
| Less than 5 Minutes | 0 (0.0%) | 28 (34.2%) |
| 5 to 9 Minutes | 17 (17.7%) | 0 (0.0%) |
| 10 to 14 Minutes | 0 (0.0%) | 0 (0.0%) |
| 15 to 19 Minutes | 46 (47.9%) | 0 (0.0%) |
| 20 to 24 Minutes | 5 (5.2%) | 0 (0.0%) |
| 25 to 29 Minutes | 0 (0.0%) | 0 (0.0%) |
| 30 to 34 Minutes | 28 (29.2%) | 33 (40.2%) |
| 35 to 39 Minutes | 0 (0.0%) | 0 (0.0%) |
| 40 to 44 Minutes | 0 (0.0%) | 0 (0.0%) |
| 45 to 59 Minutes | 0 (0.0%) | 0 (0.0%) |
| 60 to 89 Minutes | 0 (0.0%) | 21 (25.6%) |
| 90 or more Minutes | 0 (0.0%) | 0 (0.0%) |
Time of Departure to Work by Sex in Buena
The most frequent times of departure to work in Buena are 12:00 AM to 4:59 AM (46, 47.9%) for males and 7:00 AM to 7:29 AM (58, 70.7%) for females.
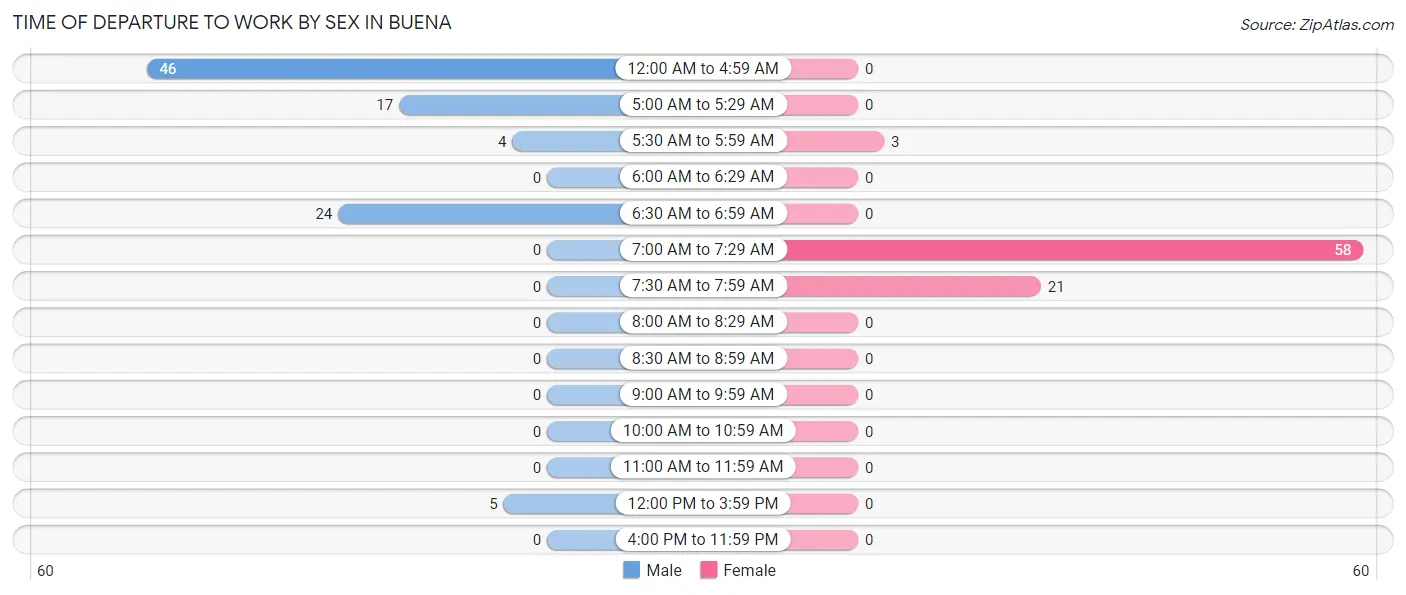
| Time of Departure | Male | Female |
| 12:00 AM to 4:59 AM | 46 (47.9%) | 0 (0.0%) |
| 5:00 AM to 5:29 AM | 17 (17.7%) | 0 (0.0%) |
| 5:30 AM to 5:59 AM | 4 (4.2%) | 3 (3.7%) |
| 6:00 AM to 6:29 AM | 0 (0.0%) | 0 (0.0%) |
| 6:30 AM to 6:59 AM | 24 (25.0%) | 0 (0.0%) |
| 7:00 AM to 7:29 AM | 0 (0.0%) | 58 (70.7%) |
| 7:30 AM to 7:59 AM | 0 (0.0%) | 21 (25.6%) |
| 8:00 AM to 8:29 AM | 0 (0.0%) | 0 (0.0%) |
| 8:30 AM to 8:59 AM | 0 (0.0%) | 0 (0.0%) |
| 9:00 AM to 9:59 AM | 0 (0.0%) | 0 (0.0%) |
| 10:00 AM to 10:59 AM | 0 (0.0%) | 0 (0.0%) |
| 11:00 AM to 11:59 AM | 0 (0.0%) | 0 (0.0%) |
| 12:00 PM to 3:59 PM | 5 (5.2%) | 0 (0.0%) |
| 4:00 PM to 11:59 PM | 0 (0.0%) | 0 (0.0%) |
| Total | 96 (100.0%) | 82 (100.0%) |
Housing Occupancy in Buena
Occupancy by Ownership in Buena
Of the total 79 dwellings in Buena, owner-occupied units account for 62 (78.5%), while renter-occupied units make up 17 (21.5%).
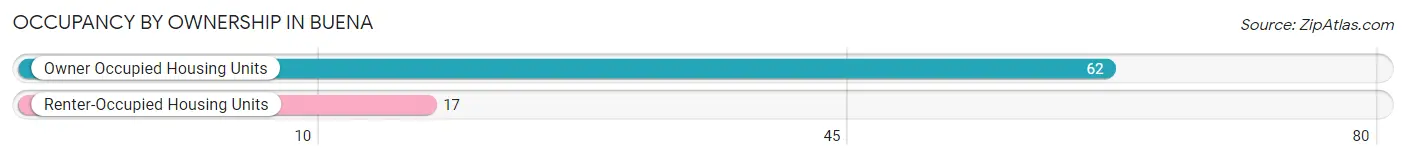
| Occupancy | # Housing Units | % Housing Units |
| Owner Occupied Housing Units | 62 | 78.5% |
| Renter-Occupied Housing Units | 17 | 21.5% |
| Total Occupied Housing Units | 79 | 100.0% |
Occupancy by Household Size in Buena
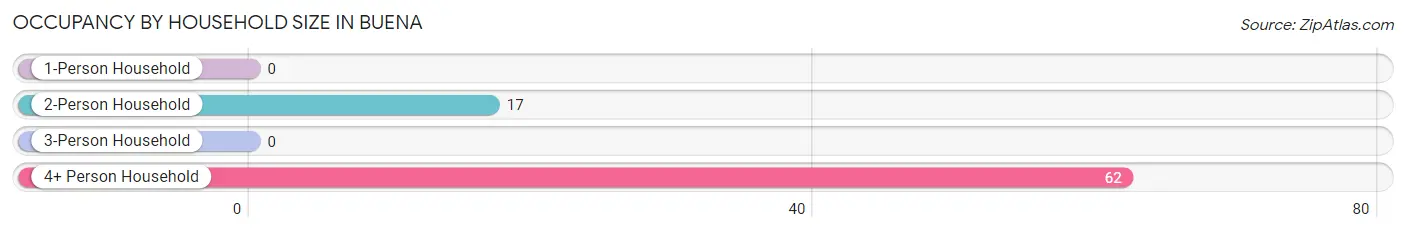
| Household Size | # Housing Units | % Housing Units |
| 1-Person Household | 0 | 0.0% |
| 2-Person Household | 17 | 21.5% |
| 3-Person Household | 0 | 0.0% |
| 4+ Person Household | 62 | 78.5% |
| Total Housing Units | 79 | 100.0% |
Occupancy by Ownership by Household Size in Buena
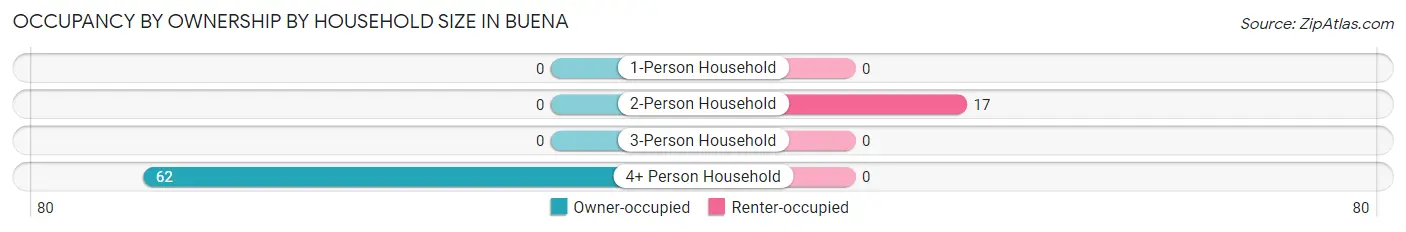
| Household Size | Owner-occupied | Renter-occupied |
| 1-Person Household | 0 (0.0%) | 0 (0.0%) |
| 2-Person Household | 0 (0.0%) | 17 (100.0%) |
| 3-Person Household | 0 (0.0%) | 0 (0.0%) |
| 4+ Person Household | 62 (100.0%) | 0 (0.0%) |
| Total Housing Units | 62 (78.5%) | 17 (21.5%) |
Occupancy by Educational Attainment in Buena
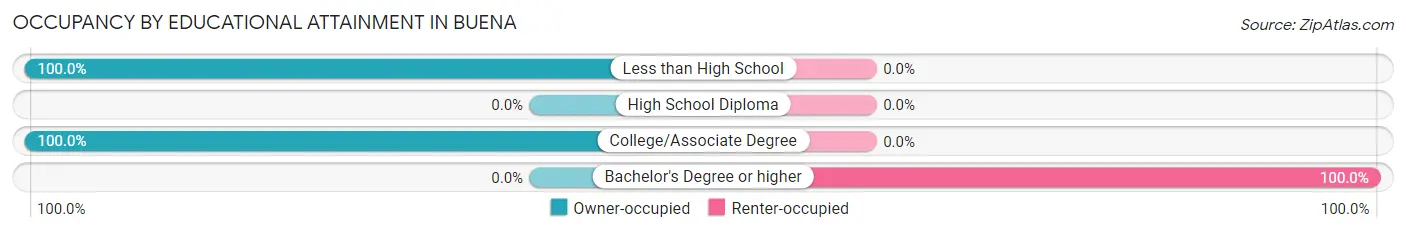
| Household Size | Owner-occupied | Renter-occupied |
| Less than High School | 4 (100.0%) | 0 (0.0%) |
| High School Diploma | 0 (0.0%) | 0 (0.0%) |
| College/Associate Degree | 58 (100.0%) | 0 (0.0%) |
| Bachelor's Degree or higher | 0 (0.0%) | 17 (100.0%) |
Occupancy by Age of Householder in Buena
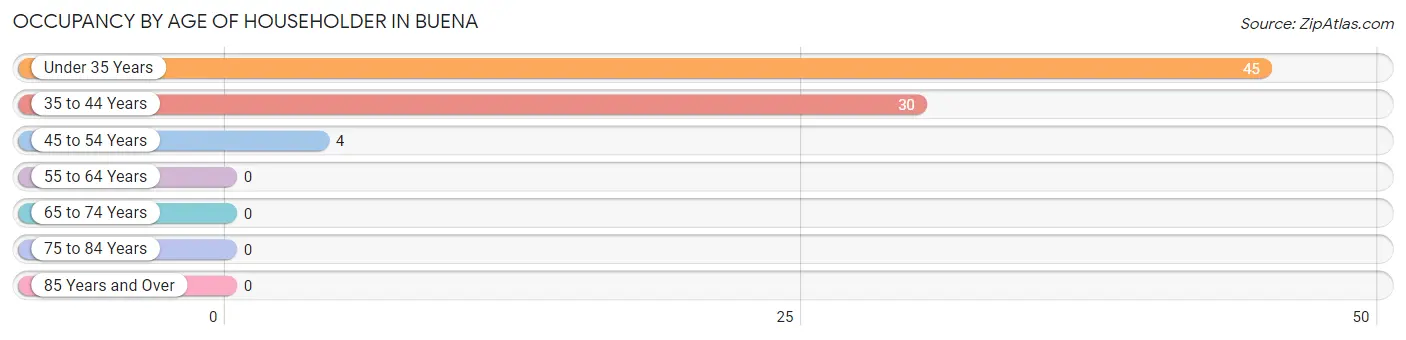
| Age Bracket | # Households | % Households |
| Under 35 Years | 45 | 57.0% |
| 35 to 44 Years | 30 | 38.0% |
| 45 to 54 Years | 4 | 5.1% |
| 55 to 64 Years | 0 | 0.0% |
| 65 to 74 Years | 0 | 0.0% |
| 75 to 84 Years | 0 | 0.0% |
| 85 Years and Over | 0 | 0.0% |
| Total | 79 | 100.0% |
Housing Finances in Buena
Median Income by Occupancy in Buena
| Occupancy Type | # Households | Median Income |
| Owner-Occupied | 62 (78.5%) | $0 |
| Renter-Occupied | 17 (21.5%) | $0 |
| Average | 79 (100.0%) | $0 |
Occupancy by Householder Income Bracket in Buena
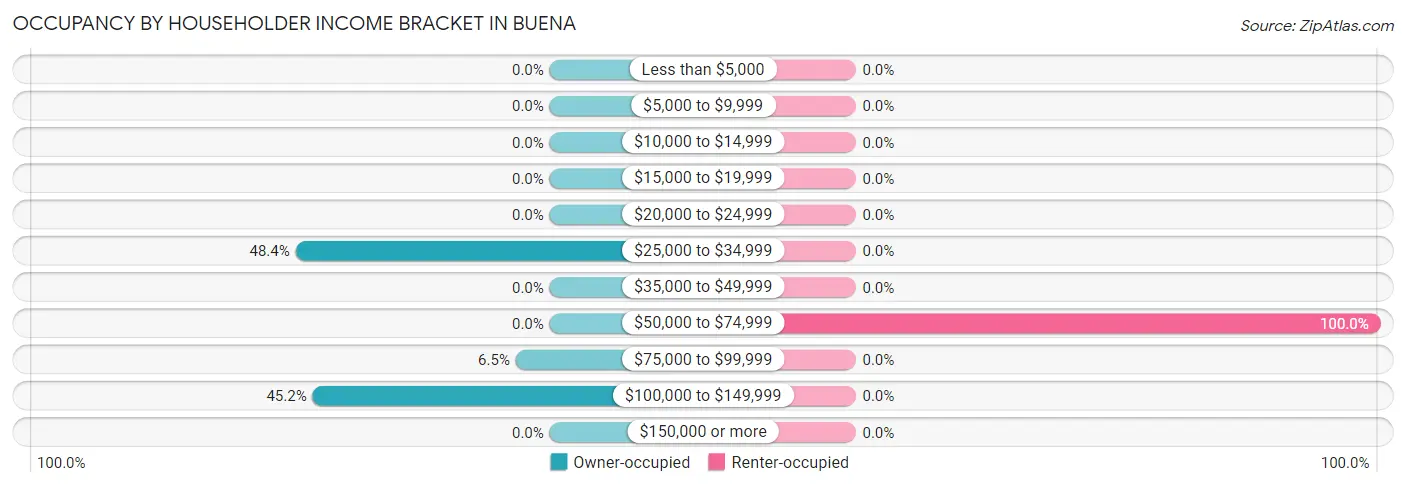
| Income Bracket | Owner-occupied | Renter-occupied |
| Less than $5,000 | 0 (0.0%) | 0 (0.0%) |
| $5,000 to $9,999 | 0 (0.0%) | 0 (0.0%) |
| $10,000 to $14,999 | 0 (0.0%) | 0 (0.0%) |
| $15,000 to $19,999 | 0 (0.0%) | 0 (0.0%) |
| $20,000 to $24,999 | 0 (0.0%) | 0 (0.0%) |
| $25,000 to $34,999 | 30 (48.4%) | 0 (0.0%) |
| $35,000 to $49,999 | 0 (0.0%) | 0 (0.0%) |
| $50,000 to $74,999 | 0 (0.0%) | 17 (100.0%) |
| $75,000 to $99,999 | 4 (6.5%) | 0 (0.0%) |
| $100,000 to $149,999 | 28 (45.2%) | 0 (0.0%) |
| $150,000 or more | 0 (0.0%) | 0 (0.0%) |
| Total | 62 (100.0%) | 17 (100.0%) |
Monthly Housing Cost Tiers in Buena
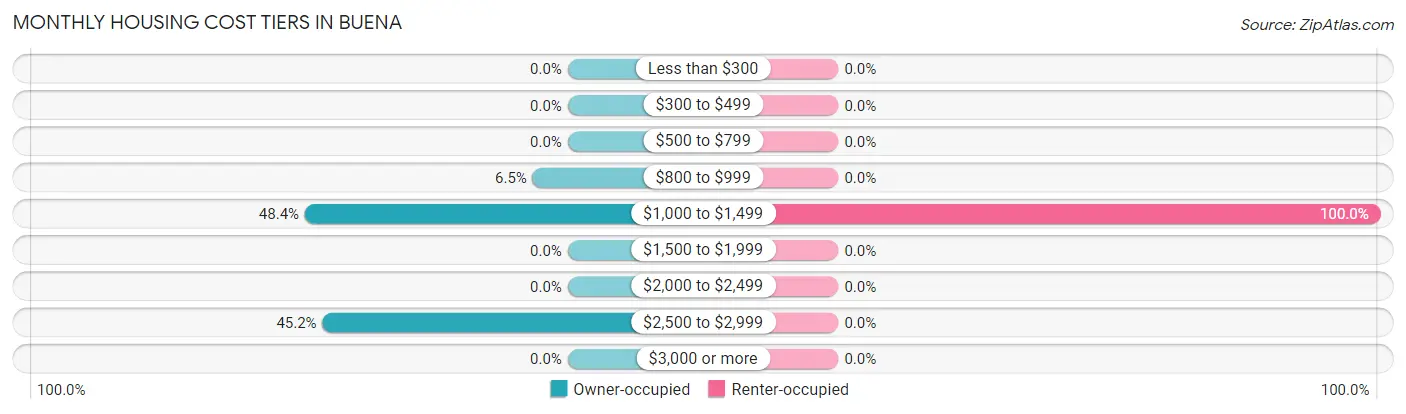
| Monthly Cost | Owner-occupied | Renter-occupied |
| Less than $300 | 0 (0.0%) | 0 (0.0%) |
| $300 to $499 | 0 (0.0%) | 0 (0.0%) |
| $500 to $799 | 0 (0.0%) | 0 (0.0%) |
| $800 to $999 | 4 (6.5%) | 0 (0.0%) |
| $1,000 to $1,499 | 30 (48.4%) | 17 (100.0%) |
| $1,500 to $1,999 | 0 (0.0%) | 0 (0.0%) |
| $2,000 to $2,499 | 0 (0.0%) | 0 (0.0%) |
| $2,500 to $2,999 | 28 (45.2%) | 0 (0.0%) |
| $3,000 or more | 0 (0.0%) | 0 (0.0%) |
| Total | 62 (100.0%) | 17 (100.0%) |
Physical Housing Characteristics in Buena
Housing Structures in Buena
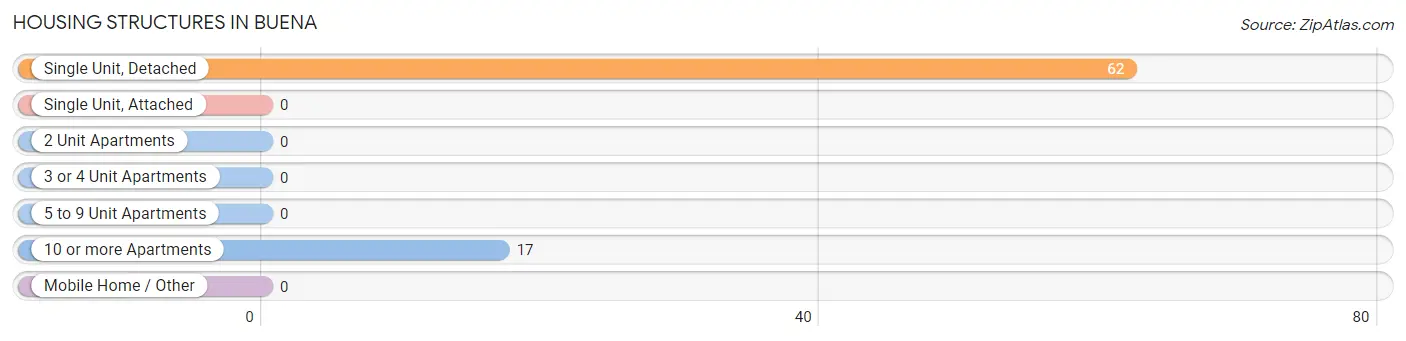
| Structure Type | # Housing Units | % Housing Units |
| Single Unit, Detached | 62 | 78.5% |
| Single Unit, Attached | 0 | 0.0% |
| 2 Unit Apartments | 0 | 0.0% |
| 3 or 4 Unit Apartments | 0 | 0.0% |
| 5 to 9 Unit Apartments | 0 | 0.0% |
| 10 or more Apartments | 17 | 21.5% |
| Mobile Home / Other | 0 | 0.0% |
| Total | 79 | 100.0% |
Housing Structures by Occupancy in Buena
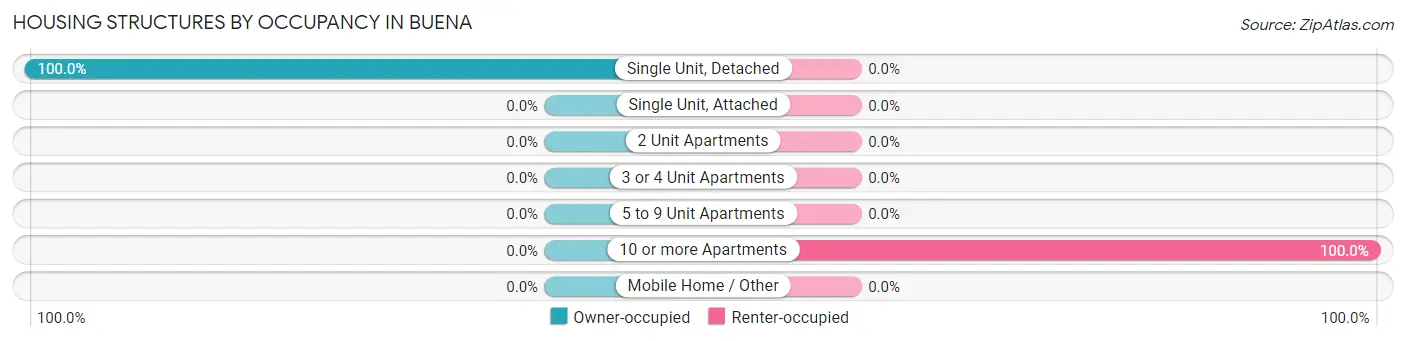
| Structure Type | Owner-occupied | Renter-occupied |
| Single Unit, Detached | 62 (100.0%) | 0 (0.0%) |
| Single Unit, Attached | 0 (0.0%) | 0 (0.0%) |
| 2 Unit Apartments | 0 (0.0%) | 0 (0.0%) |
| 3 or 4 Unit Apartments | 0 (0.0%) | 0 (0.0%) |
| 5 to 9 Unit Apartments | 0 (0.0%) | 0 (0.0%) |
| 10 or more Apartments | 0 (0.0%) | 17 (100.0%) |
| Mobile Home / Other | 0 (0.0%) | 0 (0.0%) |
| Total | 62 (78.5%) | 17 (21.5%) |
Housing Structures by Number of Rooms in Buena
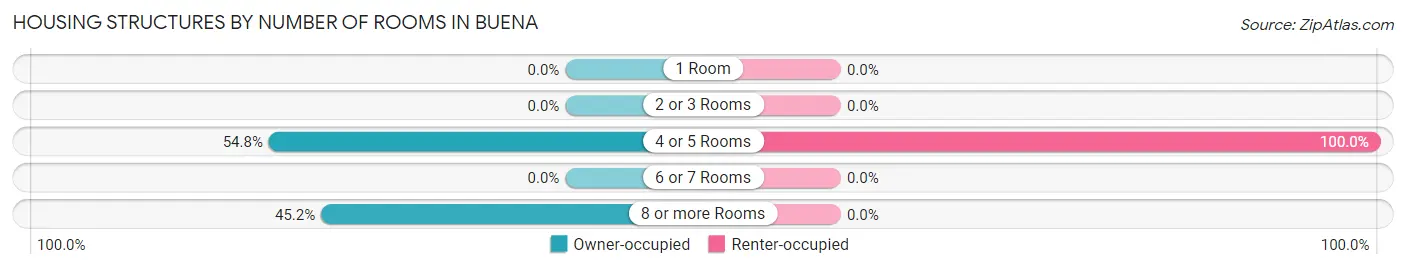
| Number of Rooms | Owner-occupied | Renter-occupied |
| 1 Room | 0 (0.0%) | 0 (0.0%) |
| 2 or 3 Rooms | 0 (0.0%) | 0 (0.0%) |
| 4 or 5 Rooms | 34 (54.8%) | 17 (100.0%) |
| 6 or 7 Rooms | 0 (0.0%) | 0 (0.0%) |
| 8 or more Rooms | 28 (45.2%) | 0 (0.0%) |
| Total | 62 (100.0%) | 17 (100.0%) |
Housing Structure by Heating Type in Buena
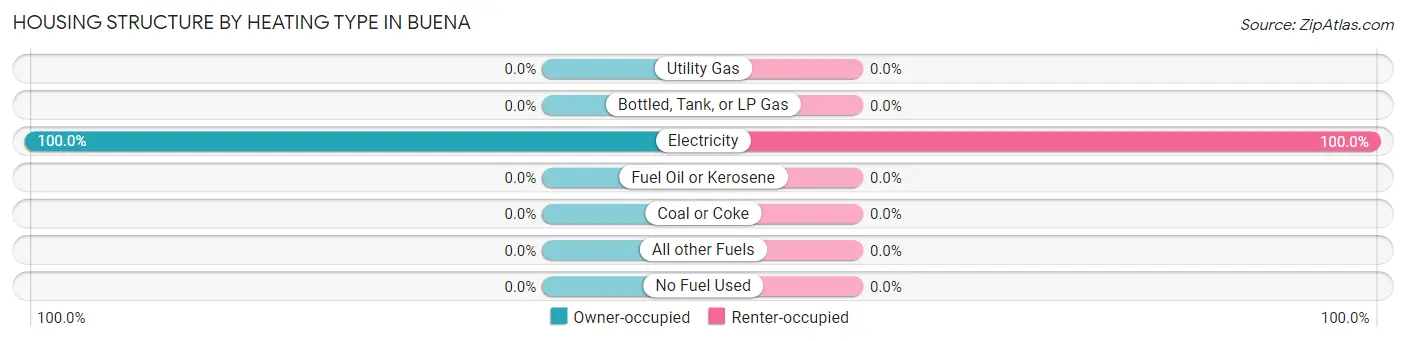
| Heating Type | Owner-occupied | Renter-occupied |
| Utility Gas | 0 (0.0%) | 0 (0.0%) |
| Bottled, Tank, or LP Gas | 0 (0.0%) | 0 (0.0%) |
| Electricity | 62 (100.0%) | 17 (100.0%) |
| Fuel Oil or Kerosene | 0 (0.0%) | 0 (0.0%) |
| Coal or Coke | 0 (0.0%) | 0 (0.0%) |
| All other Fuels | 0 (0.0%) | 0 (0.0%) |
| No Fuel Used | 0 (0.0%) | 0 (0.0%) |
| Total | 62 (100.0%) | 17 (100.0%) |
Household Vehicle Usage in Buena
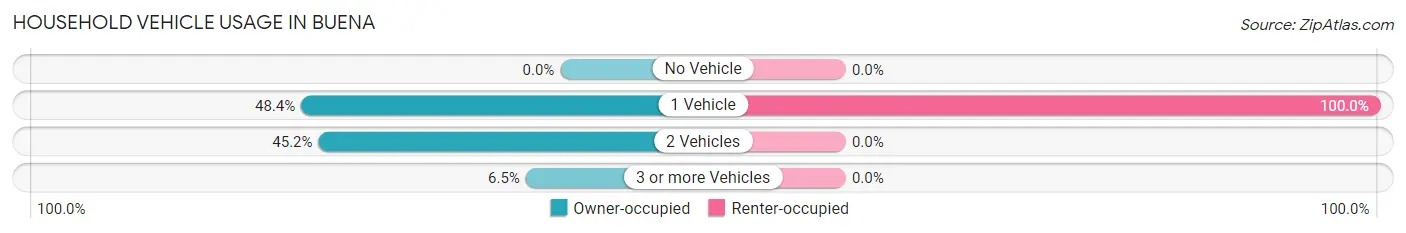
| Vehicles per Household | Owner-occupied | Renter-occupied |
| No Vehicle | 0 (0.0%) | 0 (0.0%) |
| 1 Vehicle | 30 (48.4%) | 17 (100.0%) |
| 2 Vehicles | 28 (45.2%) | 0 (0.0%) |
| 3 or more Vehicles | 4 (6.5%) | 0 (0.0%) |
| Total | 62 (100.0%) | 17 (100.0%) |
Real Estate & Mortgages in Buena
Real Estate and Mortgage Overview in Buena
| Characteristic | Without Mortgage | With Mortgage |
| Housing Units | 0 | 62 |
| Median Property Value | - | - |
| Median Household Income | - | - |
| Monthly Housing Costs | - | - |
| Real Estate Taxes | - | - |
Property Value by Mortgage Status in Buena
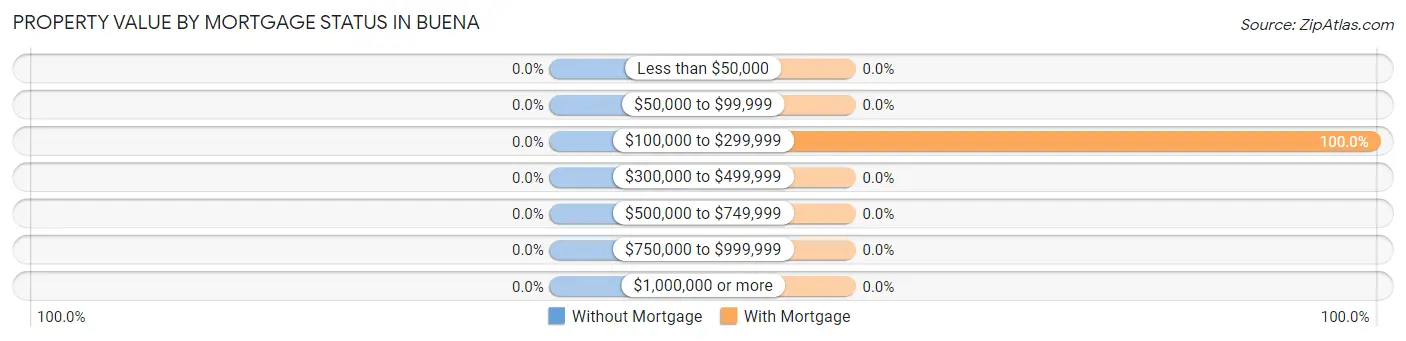
| Property Value | Without Mortgage | With Mortgage |
| Less than $50,000 | 0 (0.0%) | 0 (0.0%) |
| $50,000 to $99,999 | 0 (0.0%) | 0 (0.0%) |
| $100,000 to $299,999 | 0 (0.0%) | 62 (100.0%) |
| $300,000 to $499,999 | 0 (0.0%) | 0 (0.0%) |
| $500,000 to $749,999 | 0 (0.0%) | 0 (0.0%) |
| $750,000 to $999,999 | 0 (0.0%) | 0 (0.0%) |
| $1,000,000 or more | 0 (0.0%) | 0 (0.0%) |
| Total | 0 (0.0%) | 62 (100.0%) |
Household Income by Mortgage Status in Buena
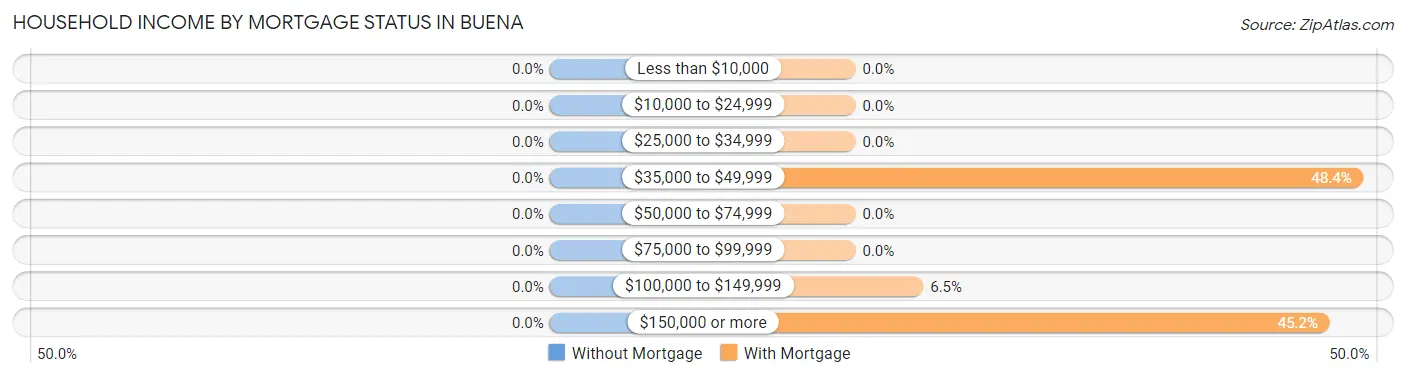
| Household Income | Without Mortgage | With Mortgage |
| Less than $10,000 | 0 (0.0%) | 0 (0.0%) |
| $10,000 to $24,999 | 0 (0.0%) | 0 (0.0%) |
| $25,000 to $34,999 | 0 (0.0%) | 0 (0.0%) |
| $35,000 to $49,999 | 0 (0.0%) | 30 (48.4%) |
| $50,000 to $74,999 | 0 (0.0%) | 0 (0.0%) |
| $75,000 to $99,999 | 0 (0.0%) | 0 (0.0%) |
| $100,000 to $149,999 | 0 (0.0%) | 4 (6.5%) |
| $150,000 or more | 0 (0.0%) | 28 (45.2%) |
| Total | 0 (0.0%) | 62 (100.0%) |
Property Value to Household Income Ratio in Buena
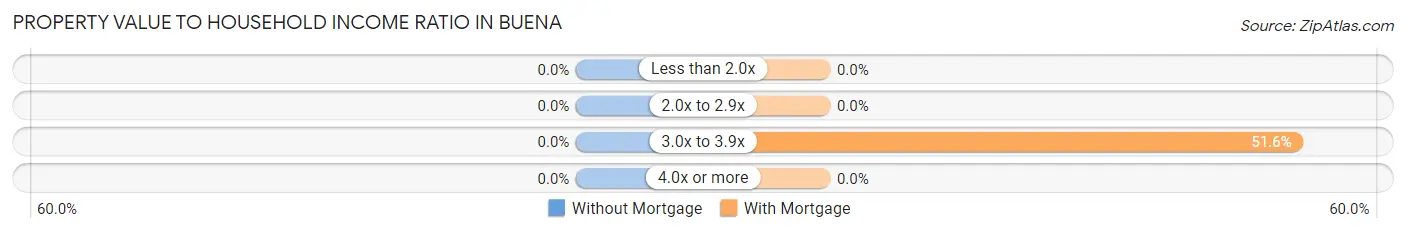
| Value-to-Income Ratio | Without Mortgage | With Mortgage |
| Less than 2.0x | 0 (0.0%) | 0 (0.0%) |
| 2.0x to 2.9x | 0 (0.0%) | 0 (0.0%) |
| 3.0x to 3.9x | 0 (0.0%) | 32 (51.6%) |
| 4.0x or more | 0 (0.0%) | 0 (0.0%) |
| Total | 0 (0.0%) | 62 (100.0%) |
Real Estate Taxes by Mortgage Status in Buena
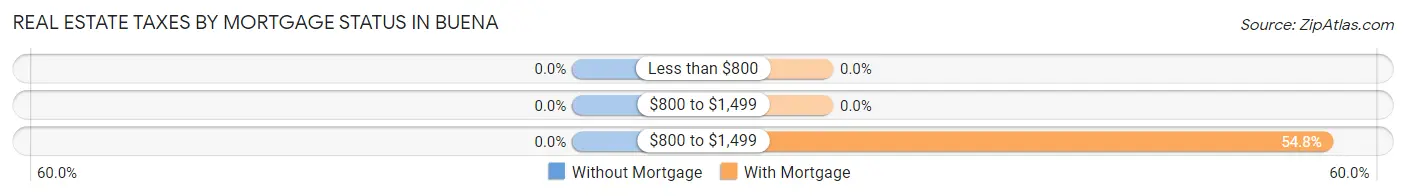
| Property Taxes | Without Mortgage | With Mortgage |
| Less than $800 | 0 (0.0%) | 0 (0.0%) |
| $800 to $1,499 | 0 (0.0%) | 0 (0.0%) |
| $800 to $1,499 | 0 (0.0%) | 34 (54.8%) |
| Total | 0 (0.0%) | 62 (100.0%) |
Health & Disability in Buena
Health Insurance Coverage by Age in Buena
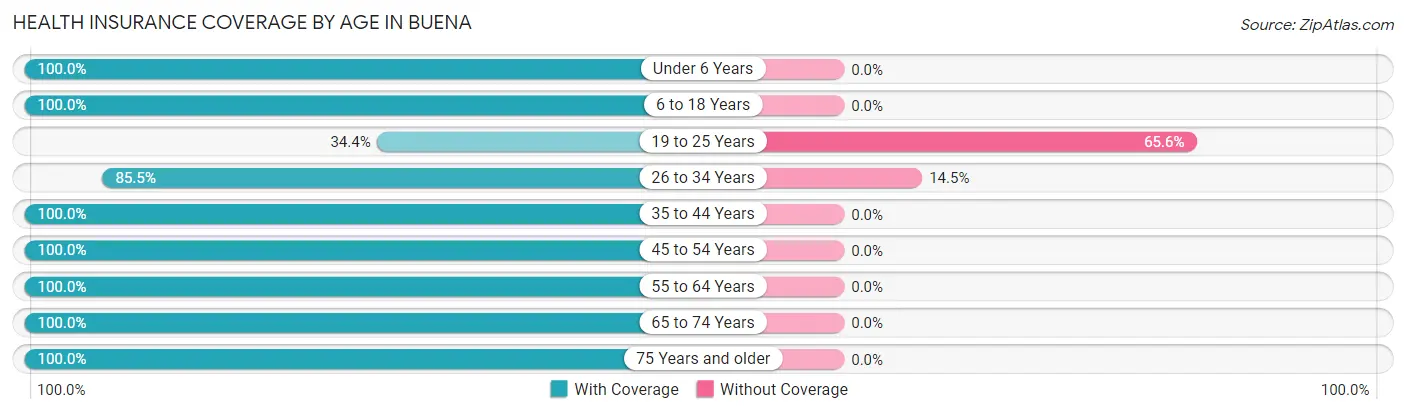
| Age Bracket | With Coverage | Without Coverage |
| Under 6 Years | 44 (100.0%) | 0 (0.0%) |
| 6 to 18 Years | 272 (100.0%) | 0 (0.0%) |
| 19 to 25 Years | 11 (34.4%) | 21 (65.6%) |
| 26 to 34 Years | 100 (85.5%) | 17 (14.5%) |
| 35 to 44 Years | 54 (100.0%) | 0 (0.0%) |
| 45 to 54 Years | 10 (100.0%) | 0 (0.0%) |
| 55 to 64 Years | 7 (100.0%) | 0 (0.0%) |
| 65 to 74 Years | 3 (100.0%) | 0 (0.0%) |
| 75 Years and older | 4 (100.0%) | 0 (0.0%) |
| Total | 505 (93.0%) | 38 (7.0%) |
Health Insurance Coverage by Citizenship Status in Buena
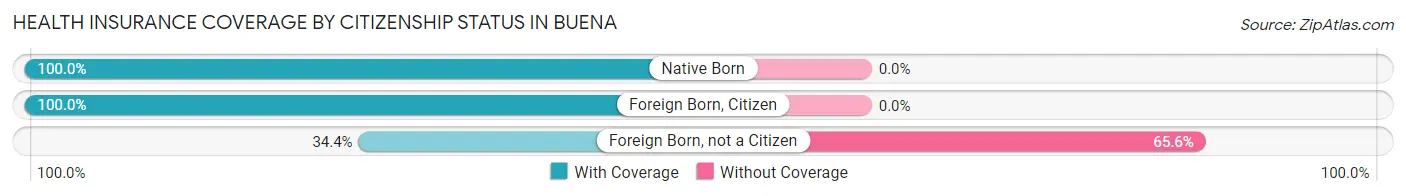
| Citizenship Status | With Coverage | Without Coverage |
| Native Born | 44 (100.0%) | 0 (0.0%) |
| Foreign Born, Citizen | 272 (100.0%) | 0 (0.0%) |
| Foreign Born, not a Citizen | 11 (34.4%) | 21 (65.6%) |
Health Insurance Coverage by Household Income in Buena
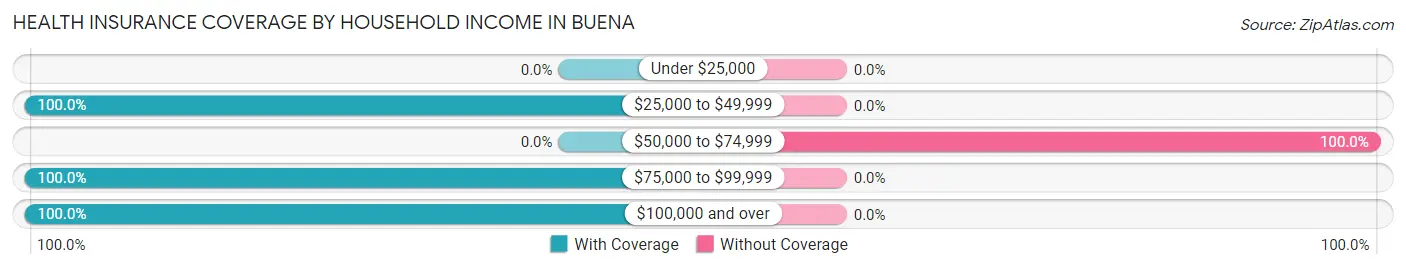
| Household Income | With Coverage | Without Coverage |
| Under $25,000 | 0 (0.0%) | 0 (0.0%) |
| $25,000 to $49,999 | 196 (100.0%) | 0 (0.0%) |
| $50,000 to $74,999 | 0 (0.0%) | 38 (100.0%) |
| $75,000 to $99,999 | 25 (100.0%) | 0 (0.0%) |
| $100,000 and over | 211 (100.0%) | 0 (0.0%) |
Public vs Private Health Insurance Coverage by Age in Buena
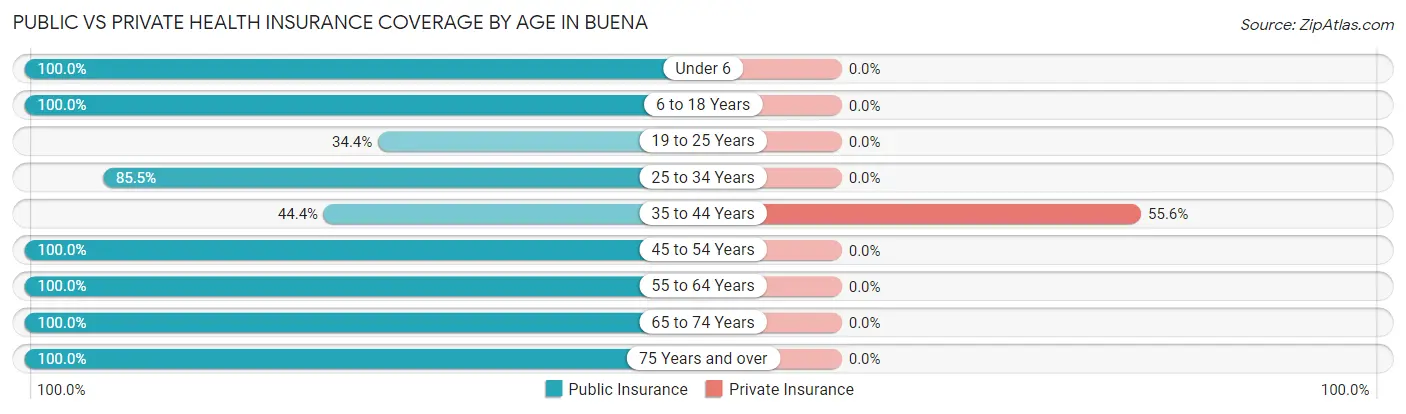
| Age Bracket | Public Insurance | Private Insurance |
| Under 6 | 44 (100.0%) | 0 (0.0%) |
| 6 to 18 Years | 272 (100.0%) | 0 (0.0%) |
| 19 to 25 Years | 11 (34.4%) | 0 (0.0%) |
| 25 to 34 Years | 100 (85.5%) | 0 (0.0%) |
| 35 to 44 Years | 24 (44.4%) | 30 (55.6%) |
| 45 to 54 Years | 10 (100.0%) | 0 (0.0%) |
| 55 to 64 Years | 7 (100.0%) | 0 (0.0%) |
| 65 to 74 Years | 3 (100.0%) | 0 (0.0%) |
| 75 Years and over | 4 (100.0%) | 0 (0.0%) |
| Total | 475 (87.5%) | 30 (5.5%) |
Disability Status by Sex by Age in Buena
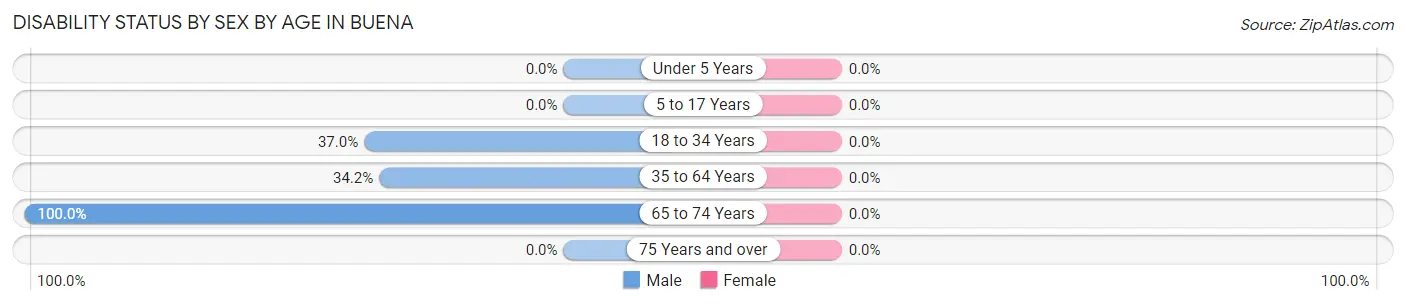
| Age Bracket | Male | Female |
| Under 5 Years | 0 (0.0%) | 0 (0.0%) |
| 5 to 17 Years | 0 (0.0%) | 0 (0.0%) |
| 18 to 34 Years | 37 (37.0%) | 0 (0.0%) |
| 35 to 64 Years | 13 (34.2%) | 0 (0.0%) |
| 65 to 74 Years | 3 (100.0%) | 0 (0.0%) |
| 75 Years and over | 0 (0.0%) | 0 (0.0%) |
Disability Class by Sex by Age in Buena
Disability Class: Hearing Difficulty
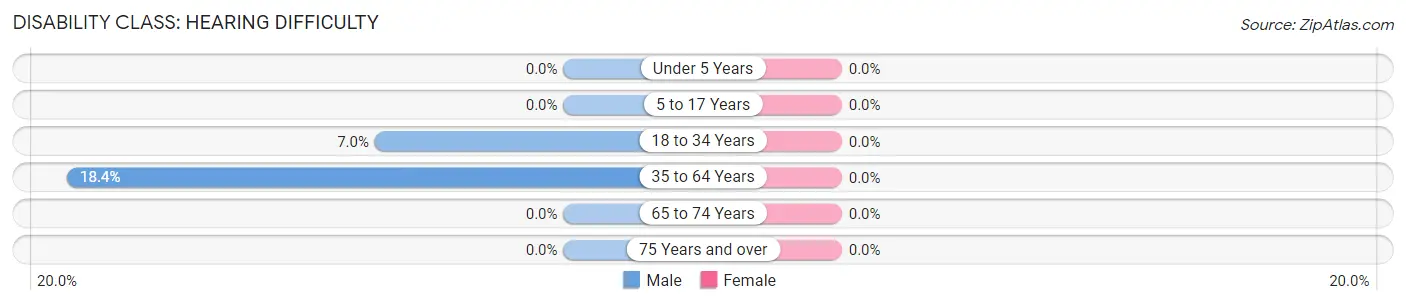
| Age Bracket | Male | Female |
| Under 5 Years | 0 (0.0%) | 0 (0.0%) |
| 5 to 17 Years | 0 (0.0%) | 0 (0.0%) |
| 18 to 34 Years | 7 (7.0%) | 0 (0.0%) |
| 35 to 64 Years | 7 (18.4%) | 0 (0.0%) |
| 65 to 74 Years | 0 (0.0%) | 0 (0.0%) |
| 75 Years and over | 0 (0.0%) | 0 (0.0%) |
Disability Class: Vision Difficulty
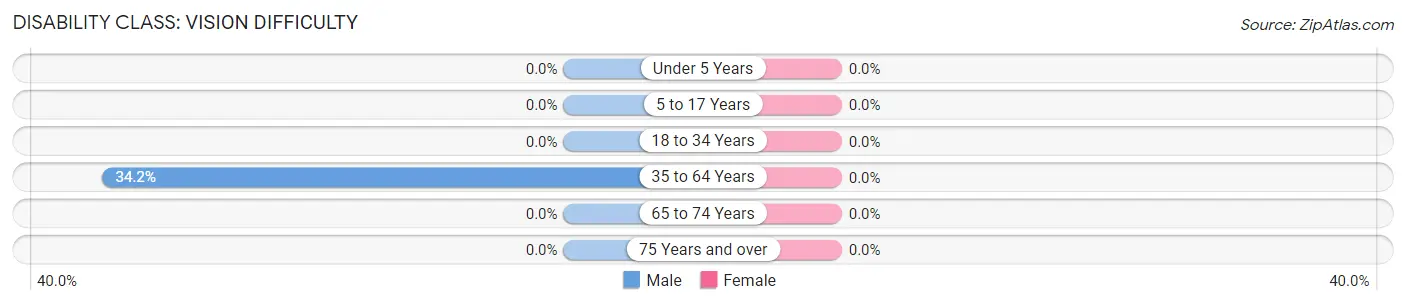
| Age Bracket | Male | Female |
| Under 5 Years | 0 (0.0%) | 0 (0.0%) |
| 5 to 17 Years | 0 (0.0%) | 0 (0.0%) |
| 18 to 34 Years | 0 (0.0%) | 0 (0.0%) |
| 35 to 64 Years | 13 (34.2%) | 0 (0.0%) |
| 65 to 74 Years | 0 (0.0%) | 0 (0.0%) |
| 75 Years and over | 0 (0.0%) | 0 (0.0%) |
Disability Class: Cognitive Difficulty
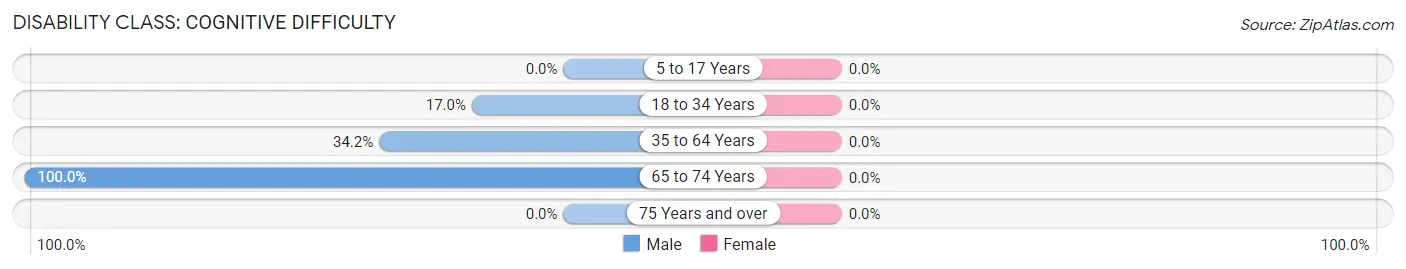
| Age Bracket | Male | Female |
| 5 to 17 Years | 0 (0.0%) | 0 (0.0%) |
| 18 to 34 Years | 17 (17.0%) | 0 (0.0%) |
| 35 to 64 Years | 13 (34.2%) | 0 (0.0%) |
| 65 to 74 Years | 3 (100.0%) | 0 (0.0%) |
| 75 Years and over | 0 (0.0%) | 0 (0.0%) |
Disability Class: Ambulatory Difficulty
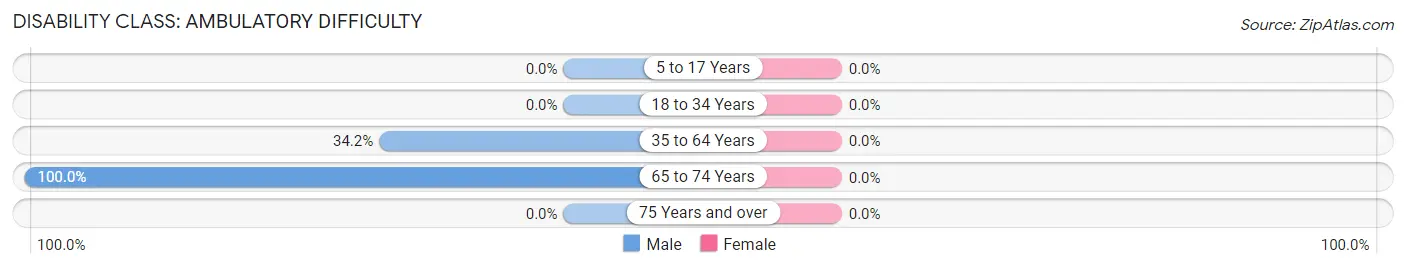
| Age Bracket | Male | Female |
| 5 to 17 Years | 0 (0.0%) | 0 (0.0%) |
| 18 to 34 Years | 0 (0.0%) | 0 (0.0%) |
| 35 to 64 Years | 13 (34.2%) | 0 (0.0%) |
| 65 to 74 Years | 3 (100.0%) | 0 (0.0%) |
| 75 Years and over | 0 (0.0%) | 0 (0.0%) |
Disability Class: Self-Care Difficulty
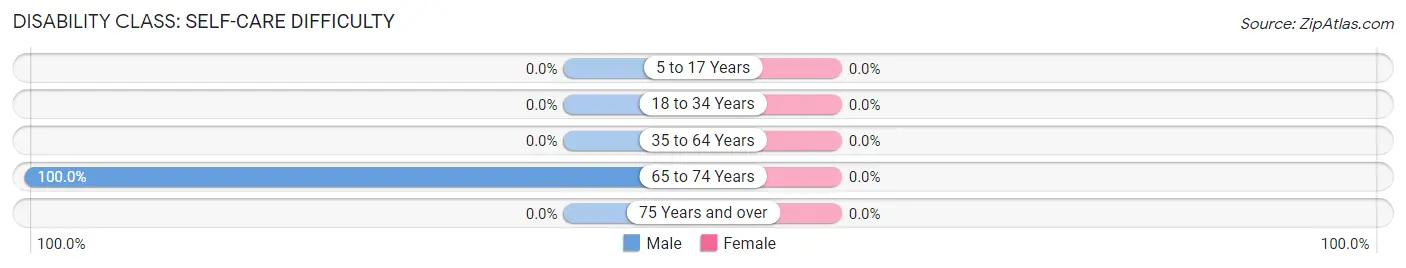
| Age Bracket | Male | Female |
| 5 to 17 Years | 0 (0.0%) | 0 (0.0%) |
| 18 to 34 Years | 0 (0.0%) | 0 (0.0%) |
| 35 to 64 Years | 0 (0.0%) | 0 (0.0%) |
| 65 to 74 Years | 3 (100.0%) | 0 (0.0%) |
| 75 Years and over | 0 (0.0%) | 0 (0.0%) |
Technology Access in Buena
Computing Device Access in Buena
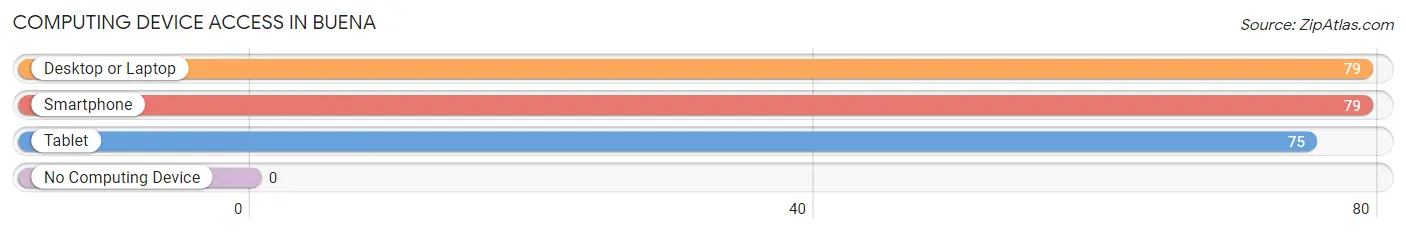
| Device Type | # Households | % Households |
| Desktop or Laptop | 79 | 100.0% |
| Smartphone | 79 | 100.0% |
| Tablet | 75 | 94.9% |
| No Computing Device | 0 | 0.0% |
| Total | 79 | 100.0% |
Internet Access in Buena
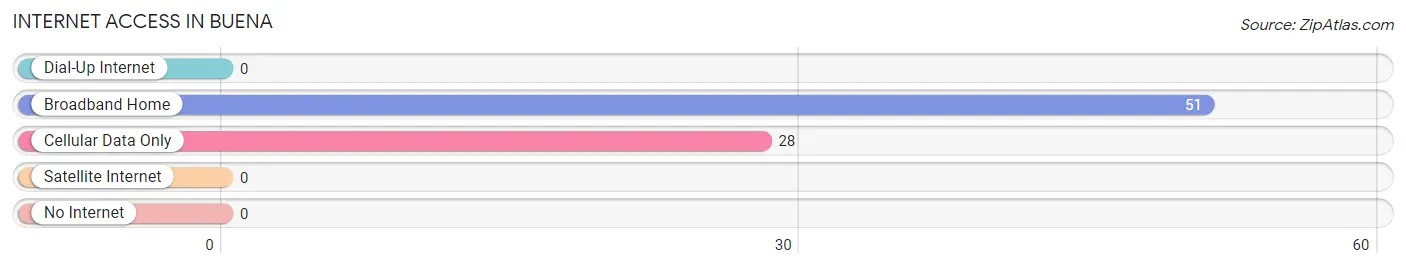
| Internet Type | # Households | % Households |
| Dial-Up Internet | 0 | 0.0% |
| Broadband Home | 51 | 64.6% |
| Cellular Data Only | 28 | 35.4% |
| Satellite Internet | 0 | 0.0% |
| No Internet | 0 | 0.0% |
| Total | 79 | 100.0% |
Buena Summary
Buena is a small unincorporated community located in the foothills of the Cascade Mountains in Snohomish County, Washington. It is situated about 25 miles northeast of Seattle and is part of the Seattle metropolitan area. The population of Buena was estimated to be around 1,000 in 2020.
History
The area that is now Buena was first settled in the late 1800s by homesteaders who were drawn to the area by its abundant natural resources. The first post office in the area was established in 1891 and the town was officially incorporated in 1909. The town was named after the nearby Buena Creek, which was named by early settlers for its clear, cold water.
The town grew slowly over the years, but it was not until the 1950s that it began to experience significant growth. This was due to the construction of the nearby Stevens Pass ski resort, which brought an influx of tourists and new residents to the area.
Geography
Buena is located in the foothills of the Cascade Mountains in Snohomish County, Washington. It is situated about 25 miles northeast of Seattle and is part of the Seattle metropolitan area. The town is surrounded by lush forests and is home to several small lakes and streams. The nearby Stevens Pass ski resort is a popular destination for outdoor recreation.
The climate in Buena is mild and temperate, with warm summers and cool winters. The average annual temperature is around 50 degrees Fahrenheit. The area receives an average of 40 inches of precipitation per year, with most of it falling in the form of snow during the winter months.
Economy
The economy of Buena is largely based on tourism and outdoor recreation. The nearby Stevens Pass ski resort is a major draw for visitors, as are the many hiking and biking trails in the area. The town is also home to several small businesses, including restaurants, shops, and lodging.
The town is also home to several small farms, which produce a variety of fruits and vegetables. These products are sold at local farmers markets and to local restaurants.
Demographics
The population of Buena was estimated to be around 1,000 in 2020. The town is predominantly white, with a small Hispanic population. The median household income is around $50,000, and the median home value is around $400,000. The town has a low unemployment rate and a high rate of homeownership.
Buena is a small, close-knit community with a strong sense of community and pride. The town is home to several churches, a library, and a community center. The town also hosts several annual events, including a Fourth of July parade and a Christmas tree lighting ceremony.
Common Questions
What is Per Capita Income in Buena?
Per Capita income in Buena is $12,421.
What is Inequality or Gini Index in Buena?
Inequality or Gini Index in Buena is 0.28.
What is the Total Population of Buena?
Total Population of Buena is 543.
What is the Total Male Population of Buena?
Total Male Population of Buena is 258.
What is the Total Female Population of Buena?
Total Female Population of Buena is 285.
What is the Ratio of Males per 100 Females in Buena?
There are 90.53 Males per 100 Females in Buena.
What is the Ratio of Females per 100 Males in Buena?
There are 110.47 Females per 100 Males in Buena.
What is the Median Population Age in Buena?
Median Population Age in Buena is 16.1 Years.
What is the Average Family Size in Buena
Average Family Size in Buena is 6.0 People.
What is the Average Household Size in Buena
Average Household Size in Buena is 6.0 People.
How Large is the Labor Force in Buena?
There are 178 People in the Labor Forcein in Buena.
What is the Percentage of People in the Labor Force in Buena?
65.0% of People are in the Labor Force in Buena.