Zip Codes with the Highest Percentage of Population Employed in Installation, Maintenance & Repair in Bellingham, WA
RELATED REPORTS & OPTIONS
Installation, Maintenance & Repair
Bellingham
Compare Zip Codes
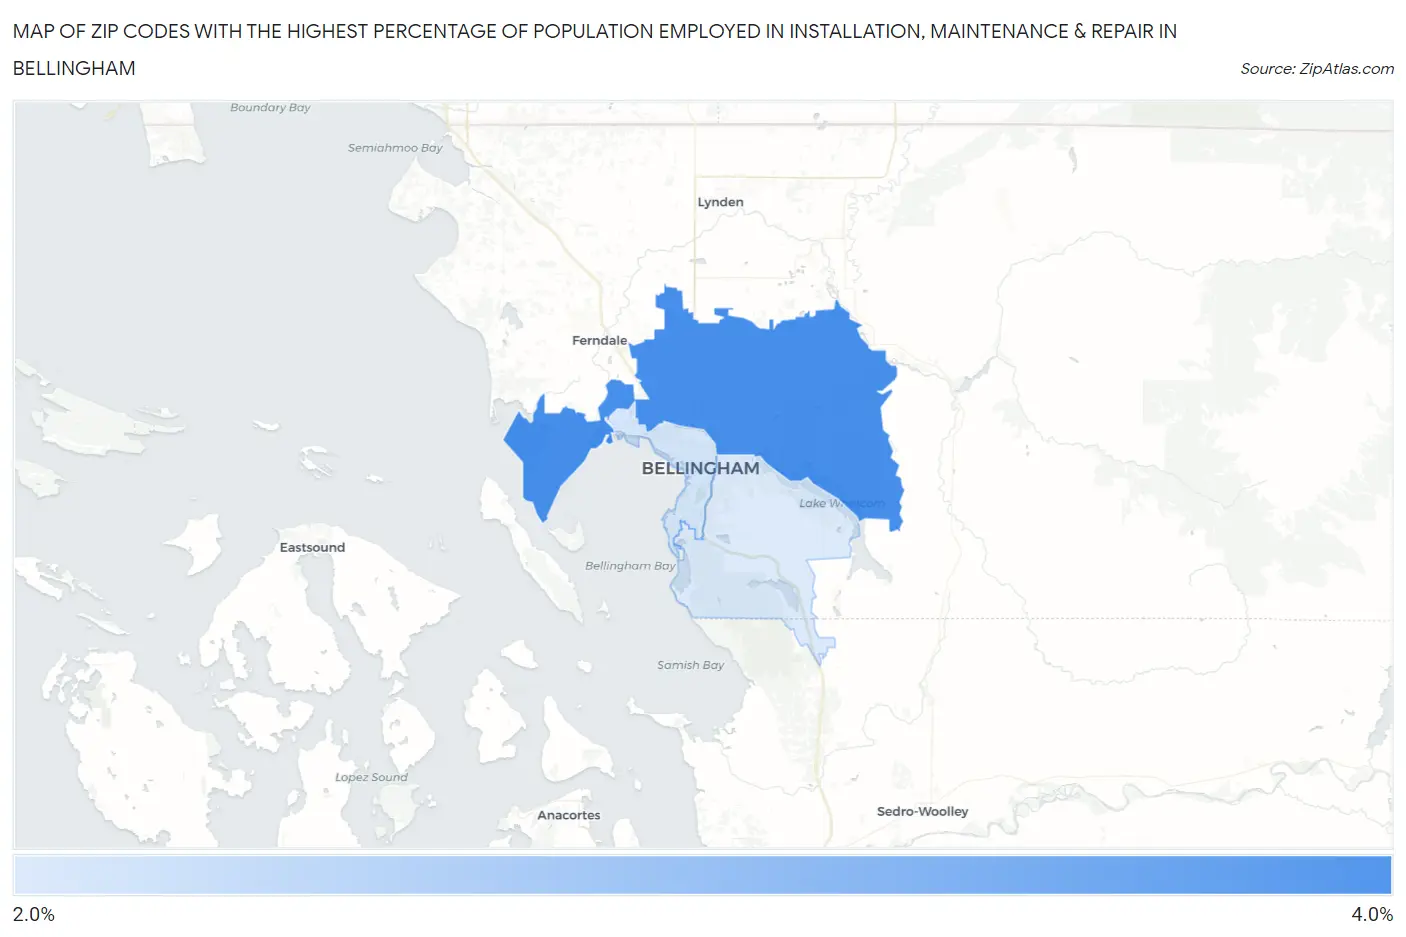
Map of Zip Codes with the Highest Percentage of Population Employed in Installation, Maintenance & Repair in Bellingham
2.3%
3.3%
Zip Codes with the Highest Percentage of Population Employed in Installation, Maintenance & Repair in Bellingham, WA
| Zip Code | % Employed | vs State | vs National | |
| 1. | 98226 | 3.3% | 2.9%(+0.367)#249 | 3.1%(+0.228)#15,567 |
| 2. | 98225 | 2.3% | 2.9%(-0.588)#340 | 3.1%(-0.727)#20,365 |
| 3. | 98229 | 2.3% | 2.9%(-0.653)#347 | 3.1%(-0.792)#20,697 |
1
Common Questions
What are the Top Zip Codes with the Highest Percentage of Population Employed in Installation, Maintenance & Repair in Bellingham, WA?
Top Zip Codes with the Highest Percentage of Population Employed in Installation, Maintenance & Repair in Bellingham, WA are:
What zip code has the Highest Percentage of Population Employed in Installation, Maintenance & Repair in Bellingham, WA?
98226 has the Highest Percentage of Population Employed in Installation, Maintenance & Repair in Bellingham, WA with 3.3%.
What is the Percentage of Population Employed in Installation, Maintenance & Repair in Bellingham, WA?
Percentage of Population Employed in Installation, Maintenance & Repair in Bellingham is 2.2%.
What is the Percentage of Population Employed in Installation, Maintenance & Repair in Washington?
Percentage of Population Employed in Installation, Maintenance & Repair in Washington is 2.9%.
What is the Percentage of Population Employed in Installation, Maintenance & Repair in the United States?
Percentage of Population Employed in Installation, Maintenance & Repair in the United States is 3.1%.