Zip Codes with the Highest Percentage of Population Employed in Installation, Maintenance & Repair in Tacoma, WA
RELATED REPORTS & OPTIONS
Installation, Maintenance & Repair
Tacoma
Compare Zip Codes
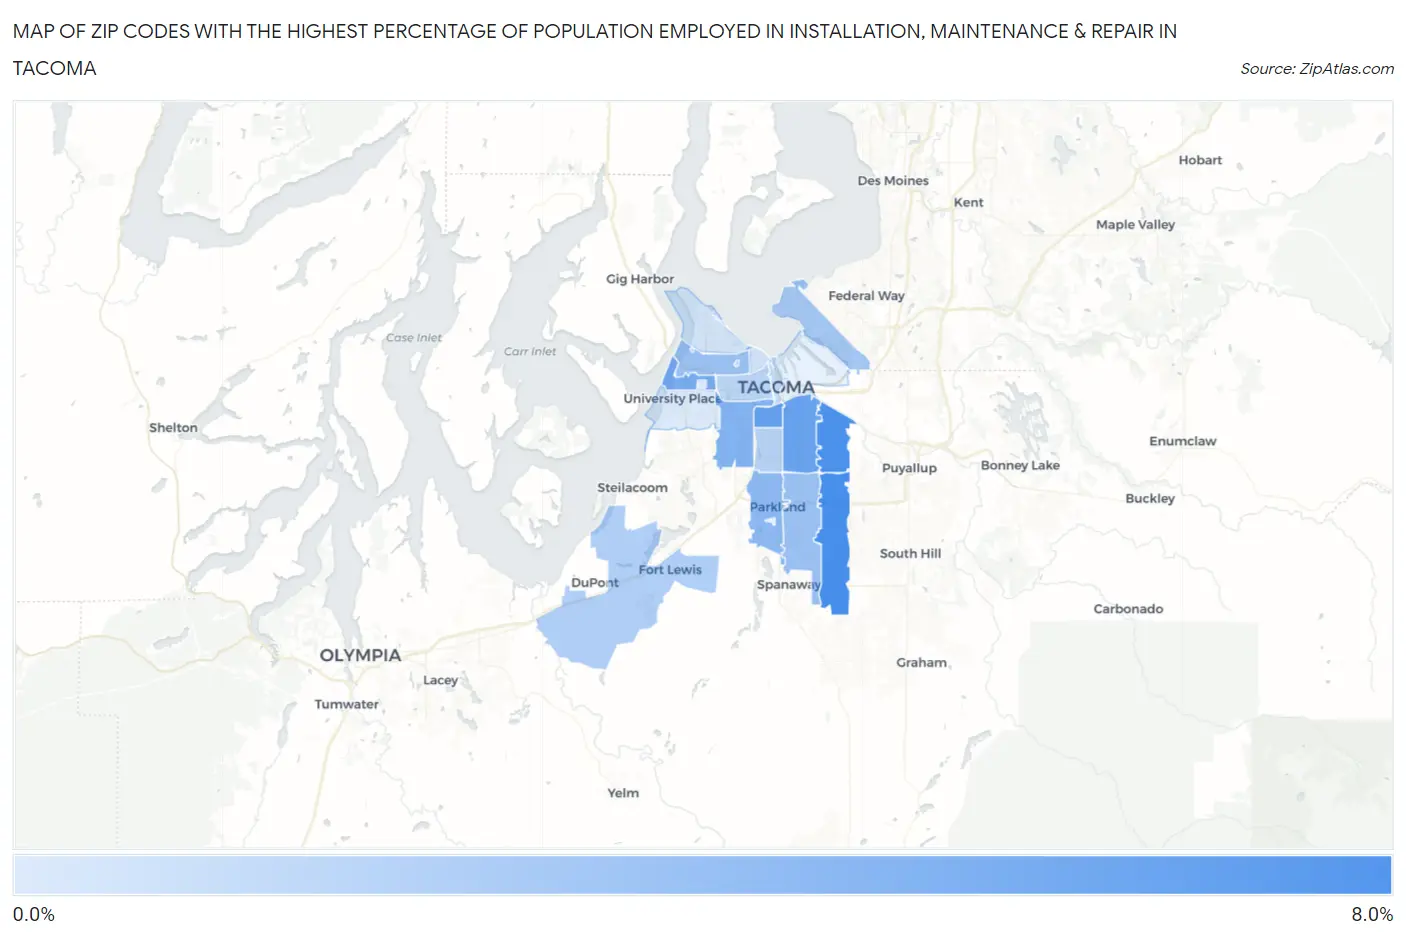
Map of Zip Codes with the Highest Percentage of Population Employed in Installation, Maintenance & Repair in Tacoma
1.4%
6.3%
Zip Codes with the Highest Percentage of Population Employed in Installation, Maintenance & Repair in Tacoma, WA
| Zip Code | % Employed | vs State | vs National | |
| 1. | 98446 | 6.3% | 2.9%(+3.33)#87 | 3.1%(+3.19)#5,624 |
| 2. | 98443 | 6.1% | 2.9%(+3.16)#90 | 3.1%(+3.02)#5,935 |
| 3. | 98418 | 5.3% | 2.9%(+2.38)#121 | 3.1%(+2.24)#7,765 |
| 4. | 98404 | 5.1% | 2.9%(+2.14)#130 | 3.1%(+2.00)#8,506 |
| 5. | 98465 | 4.6% | 2.9%(+1.63)#159 | 3.1%(+1.49)#10,198 |
| 6. | 98409 | 4.3% | 2.9%(+1.33)#177 | 3.1%(+1.20)#11,284 |
| 7. | 98444 | 3.9% | 2.9%(+0.988)#200 | 3.1%(+0.849)#12,727 |
| 8. | 98406 | 3.5% | 2.9%(+0.544)#232 | 3.1%(+0.405)#14,747 |
| 9. | 98445 | 3.5% | 2.9%(+0.543)#233 | 3.1%(+0.404)#14,752 |
| 10. | 98422 | 3.1% | 2.9%(+0.181)#269 | 3.1%(+0.042)#16,475 |
| 11. | 98433 | 2.8% | 2.9%(-0.168)#302 | 3.1%(-0.307)#18,208 |
| 12. | 98408 | 2.5% | 2.9%(-0.409)#322 | 3.1%(-0.548)#19,451 |
| 13. | 98405 | 2.4% | 2.9%(-0.559)#336 | 3.1%(-0.698)#20,215 |
| 14. | 98402 | 2.2% | 2.9%(-0.753)#358 | 3.1%(-0.892)#21,199 |
| 15. | 98416 | 1.9% | 2.9%(-1.00)#385 | 3.1%(-1.14)#22,341 |
| 16. | 98407 | 1.7% | 2.9%(-1.26)#404 | 3.1%(-1.40)#23,479 |
| 17. | 98403 | 1.7% | 2.9%(-1.27)#405 | 3.1%(-1.40)#23,511 |
| 18. | 98466 | 1.4% | 2.9%(-1.57)#428 | 3.1%(-1.71)#24,712 |
1
Common Questions
What are the Top 10 Zip Codes with the Highest Percentage of Population Employed in Installation, Maintenance & Repair in Tacoma, WA?
Top 10 Zip Codes with the Highest Percentage of Population Employed in Installation, Maintenance & Repair in Tacoma, WA are:
What zip code has the Highest Percentage of Population Employed in Installation, Maintenance & Repair in Tacoma, WA?
98446 has the Highest Percentage of Population Employed in Installation, Maintenance & Repair in Tacoma, WA with 6.3%.
What is the Percentage of Population Employed in Installation, Maintenance & Repair in Tacoma, WA?
Percentage of Population Employed in Installation, Maintenance & Repair in Tacoma is 3.5%.
What is the Percentage of Population Employed in Installation, Maintenance & Repair in Washington?
Percentage of Population Employed in Installation, Maintenance & Repair in Washington is 2.9%.
What is the Percentage of Population Employed in Installation, Maintenance & Repair in the United States?
Percentage of Population Employed in Installation, Maintenance & Repair in the United States is 3.1%.