Zip Codes with the Highest Percentage of Population Employed in Installation, Maintenance & Repair in Kent, WA
RELATED REPORTS & OPTIONS
Installation, Maintenance & Repair
Kent
Compare Zip Codes
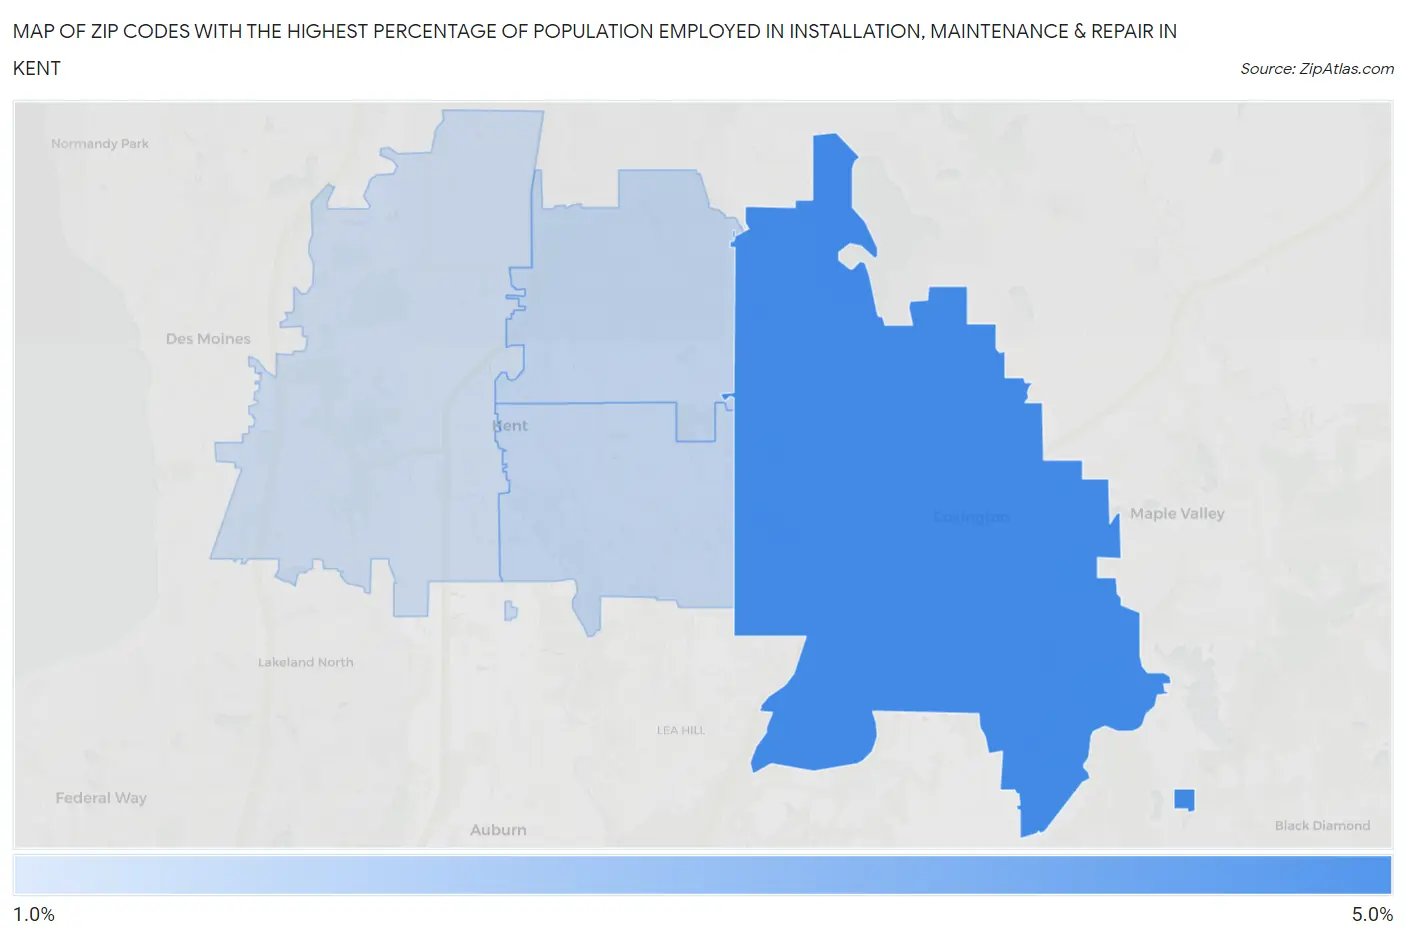
Map of Zip Codes with the Highest Percentage of Population Employed in Installation, Maintenance & Repair in Kent
2.0%
4.3%
Zip Codes with the Highest Percentage of Population Employed in Installation, Maintenance & Repair in Kent, WA
| Zip Code | % Employed | vs State | vs National | |
| 1. | 98042 | 4.3% | 2.9%(+1.37)#176 | 3.1%(+1.23)#11,166 |
| 2. | 98031 | 2.1% | 2.9%(-0.782)#363 | 3.1%(-0.921)#21,319 |
| 3. | 98030 | 2.1% | 2.9%(-0.791)#365 | 3.1%(-0.930)#21,361 |
| 4. | 98032 | 2.0% | 2.9%(-0.971)#379 | 3.1%(-1.11)#22,212 |
1
Common Questions
What are the Top 3 Zip Codes with the Highest Percentage of Population Employed in Installation, Maintenance & Repair in Kent, WA?
Top 3 Zip Codes with the Highest Percentage of Population Employed in Installation, Maintenance & Repair in Kent, WA are:
What zip code has the Highest Percentage of Population Employed in Installation, Maintenance & Repair in Kent, WA?
98042 has the Highest Percentage of Population Employed in Installation, Maintenance & Repair in Kent, WA with 4.3%.
What is the Percentage of Population Employed in Installation, Maintenance & Repair in Kent, WA?
Percentage of Population Employed in Installation, Maintenance & Repair in Kent is 2.0%.
What is the Percentage of Population Employed in Installation, Maintenance & Repair in Washington?
Percentage of Population Employed in Installation, Maintenance & Repair in Washington is 2.9%.
What is the Percentage of Population Employed in Installation, Maintenance & Repair in the United States?
Percentage of Population Employed in Installation, Maintenance & Repair in the United States is 3.1%.