Gibbsboro borough, NJ Map & Demographics
Gibbsboro borough Overview
$41,960
PER CAPITA INCOME
$106,458
AVG FAMILY INCOME
$93,103
AVG HOUSEHOLD INCOME
4.0%
WAGE / INCOME GAP [ % ]
96.0¢/ $1
WAGE / INCOME GAP [ $ ]
0.41
INEQUALITY / GINI INDEX
2,278
TOTAL POPULATION
1,166
MALE POPULATION
1,112
FEMALE POPULATION
104.86
MALES / 100 FEMALES
95.37
FEMALES / 100 MALES
41.3
MEDIAN AGE
3.4
AVG FAMILY SIZE
2.9
AVG HOUSEHOLD SIZE
1,008
LABOR FORCE [ PEOPLE ]
55.7%
PERCENT IN LABOR FORCE
8.7%
UNEMPLOYMENT RATE
Income in Gibbsboro borough
Income Overview in Gibbsboro borough
Per Capita Income in Gibbsboro borough is $41,960, while median incomes of families and households are $106,458 and $93,103 respectively.
| Characteristic | Number | Measure |
| Per Capita Income | 2,278 | $41,960 |
| Median Family Income | 597 | $106,458 |
| Mean Family Income | 597 | $133,772 |
| Median Household Income | 782 | $93,103 |
| Mean Household Income | 782 | $120,867 |
| Income Deficit | 597 | $0 |
| Wage / Income Gap (%) | 2,278 | 4.05% |
| Wage / Income Gap ($) | 2,278 | 95.95¢ per $1 |
| Gini / Inequality Index | 2,278 | 0.41 |
Earnings by Sex in Gibbsboro borough
Average Earnings in Gibbsboro borough are $54,702, $56,016 for men and $53,750 for women, a difference of 4.1%.
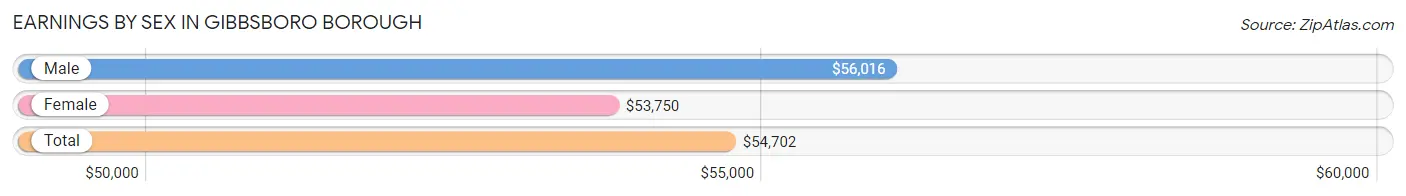
| Sex | Number | Average Earnings |
| Male | 569 (53.3%) | $56,016 |
| Female | 498 (46.7%) | $53,750 |
| Total | 1,067 (100.0%) | $54,702 |
Earnings by Sex by Income Bracket in Gibbsboro borough
The most common earnings brackets in Gibbsboro borough are $100,000+ for men (107 | 18.8%) and $100,000+ for women (85 | 17.1%).
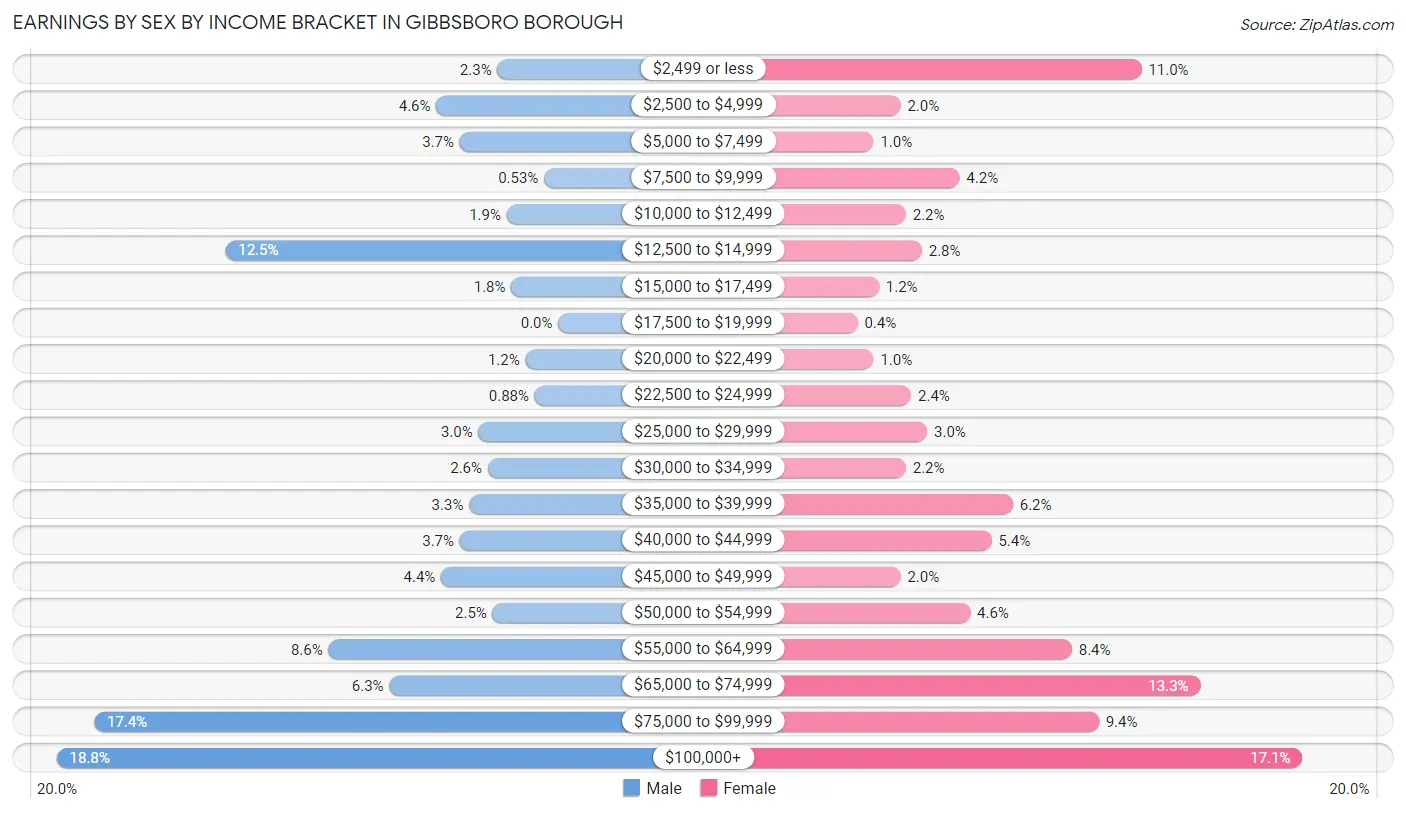
| Income | Male | Female |
| $2,499 or less | 13 (2.3%) | 55 (11.0%) |
| $2,500 to $4,999 | 26 (4.6%) | 10 (2.0%) |
| $5,000 to $7,499 | 21 (3.7%) | 5 (1.0%) |
| $7,500 to $9,999 | 3 (0.5%) | 21 (4.2%) |
| $10,000 to $12,499 | 11 (1.9%) | 11 (2.2%) |
| $12,500 to $14,999 | 71 (12.5%) | 14 (2.8%) |
| $15,000 to $17,499 | 10 (1.8%) | 6 (1.2%) |
| $17,500 to $19,999 | 0 (0.0%) | 2 (0.4%) |
| $20,000 to $22,499 | 7 (1.2%) | 5 (1.0%) |
| $22,500 to $24,999 | 5 (0.9%) | 12 (2.4%) |
| $25,000 to $29,999 | 17 (3.0%) | 15 (3.0%) |
| $30,000 to $34,999 | 15 (2.6%) | 11 (2.2%) |
| $35,000 to $39,999 | 19 (3.3%) | 31 (6.2%) |
| $40,000 to $44,999 | 21 (3.7%) | 27 (5.4%) |
| $45,000 to $49,999 | 25 (4.4%) | 10 (2.0%) |
| $50,000 to $54,999 | 14 (2.5%) | 23 (4.6%) |
| $55,000 to $64,999 | 49 (8.6%) | 42 (8.4%) |
| $65,000 to $74,999 | 36 (6.3%) | 66 (13.3%) |
| $75,000 to $99,999 | 99 (17.4%) | 47 (9.4%) |
| $100,000+ | 107 (18.8%) | 85 (17.1%) |
| Total | 569 (100.0%) | 498 (100.0%) |
Earnings by Sex by Educational Attainment in Gibbsboro borough
Average earnings in Gibbsboro borough are $63,859 for men and $63,355 for women, a difference of 0.8%. Men with an educational attainment of graduate degree enjoy the highest average annual earnings of $127,083, while those with high school diploma education earn the least with $54,583. Women with an educational attainment of graduate degree earn the most with the average annual earnings of $87,813, while those with high school diploma education have the smallest earnings of $35,417.
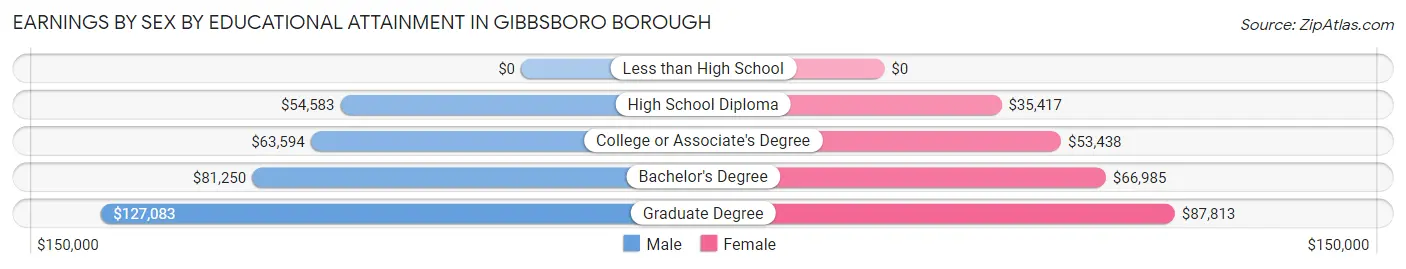
| Educational Attainment | Male Income | Female Income |
| Less than High School | - | - |
| High School Diploma | $54,583 | $35,417 |
| College or Associate's Degree | $63,594 | $53,438 |
| Bachelor's Degree | $81,250 | $66,985 |
| Graduate Degree | $127,083 | $87,813 |
| Total | $63,859 | $63,355 |
Family Income in Gibbsboro borough
Family Income Brackets in Gibbsboro borough
According to the Gibbsboro borough family income data, there are 150 families falling into the $50,000 to $74,999 income range, which is the most common income bracket and makes up 25.1% of all families.
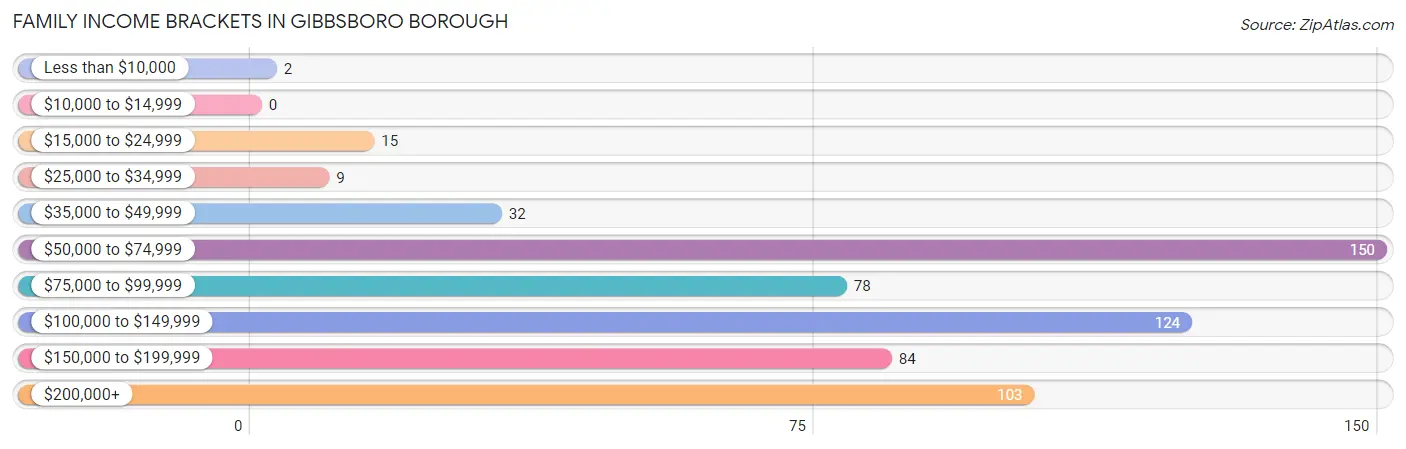
| Income Bracket | # Families | % Families |
| Less than $10,000 | 2 | 0.3% |
| $10,000 to $14,999 | 0 | 0.0% |
| $15,000 to $24,999 | 15 | 2.5% |
| $25,000 to $34,999 | 9 | 1.5% |
| $35,000 to $49,999 | 32 | 5.4% |
| $50,000 to $74,999 | 150 | 25.1% |
| $75,000 to $99,999 | 78 | 13.1% |
| $100,000 to $149,999 | 124 | 20.8% |
| $150,000 to $199,999 | 84 | 14.1% |
| $200,000+ | 103 | 17.3% |
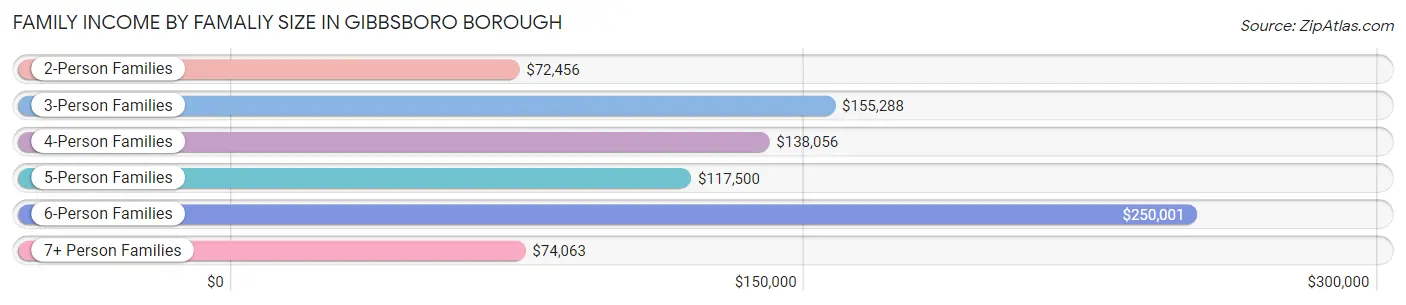
Family Income by Famaliy Size in Gibbsboro borough
6-person families (15 | 2.5%) account for the highest median family income in Gibbsboro borough with $250,001 per family, while 3-person families (131 | 21.9%) have the highest median income of $51,763 per family member.
| Income Bracket | # Families | Median Income |
| 2-Person Families | 254 (42.5%) | $72,456 |
| 3-Person Families | 131 (21.9%) | $155,288 |
| 4-Person Families | 118 (19.8%) | $138,056 |
| 5-Person Families | 50 (8.4%) | $117,500 |
| 6-Person Families | 15 (2.5%) | $250,001 |
| 7+ Person Families | 29 (4.9%) | $74,063 |
| Total | 597 (100.0%) | $106,458 |
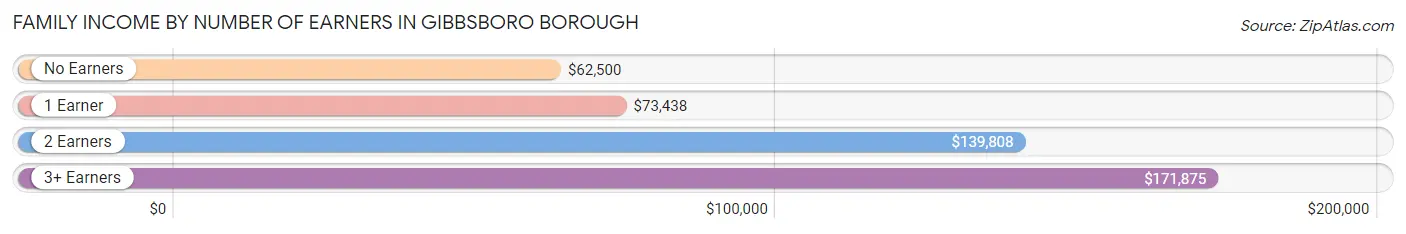
Family Income by Number of Earners in Gibbsboro borough
The median family income in Gibbsboro borough is $106,458, with families comprising 3+ earners (80) having the highest median family income of $171,875, while families with no earners (94) have the lowest median family income of $62,500, accounting for 13.4% and 15.8% of families, respectively.
| Number of Earners | # Families | Median Income |
| No Earners | 94 (15.8%) | $62,500 |
| 1 Earner | 233 (39.0%) | $73,438 |
| 2 Earners | 190 (31.8%) | $139,808 |
| 3+ Earners | 80 (13.4%) | $171,875 |
| Total | 597 (100.0%) | $106,458 |
Household Income in Gibbsboro borough
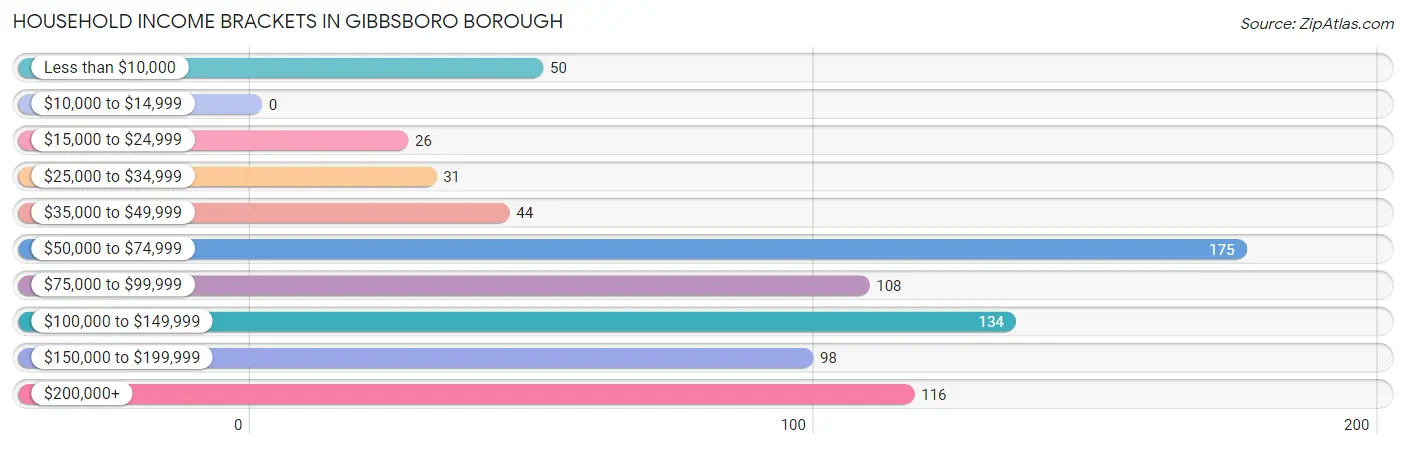
Household Income Brackets in Gibbsboro borough
With 175 households falling in the category, the $50,000 to $74,999 income range is the most frequent in Gibbsboro borough, accounting for 22.4% of all households.
| Income Bracket | # Households | % Households |
| Less than $10,000 | 50 | 6.4% |
| $10,000 to $14,999 | 0 | 0.0% |
| $15,000 to $24,999 | 26 | 3.3% |
| $25,000 to $34,999 | 31 | 4.0% |
| $35,000 to $49,999 | 44 | 5.6% |
| $50,000 to $74,999 | 175 | 22.4% |
| $75,000 to $99,999 | 108 | 13.8% |
| $100,000 to $149,999 | 134 | 17.1% |
| $150,000 to $199,999 | 98 | 12.5% |
| $200,000+ | 116 | 14.8% |
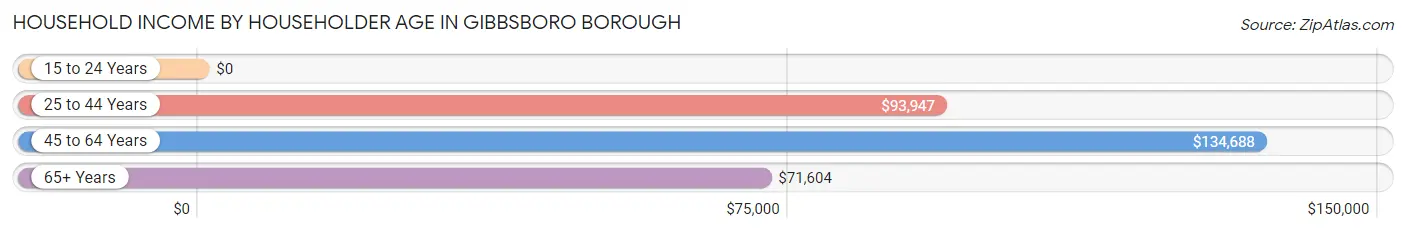
Household Income by Householder Age in Gibbsboro borough
The median household income in Gibbsboro borough is $93,103, with the highest median household income of $134,688 found in the 45 to 64 years age bracket for the primary householder. A total of 295 households (37.7%) fall into this category.
| Income Bracket | # Households | Median Income |
| 15 to 24 Years | 0 (0.0%) | $0 |
| 25 to 44 Years | 208 (26.6%) | $93,947 |
| 45 to 64 Years | 295 (37.7%) | $134,688 |
| 65+ Years | 279 (35.7%) | $71,604 |
| Total | 782 (100.0%) | $93,103 |
Poverty in Gibbsboro borough
Income Below Poverty by Sex and Age in Gibbsboro borough
With 3.9% poverty level for males and 3.2% for females among the residents of Gibbsboro borough, 35 to 44 year old males and 75 year old and over females are the most vulnerable to poverty, with 41 males (26.5%) and 13 females (12.1%) in their respective age groups living below the poverty level.
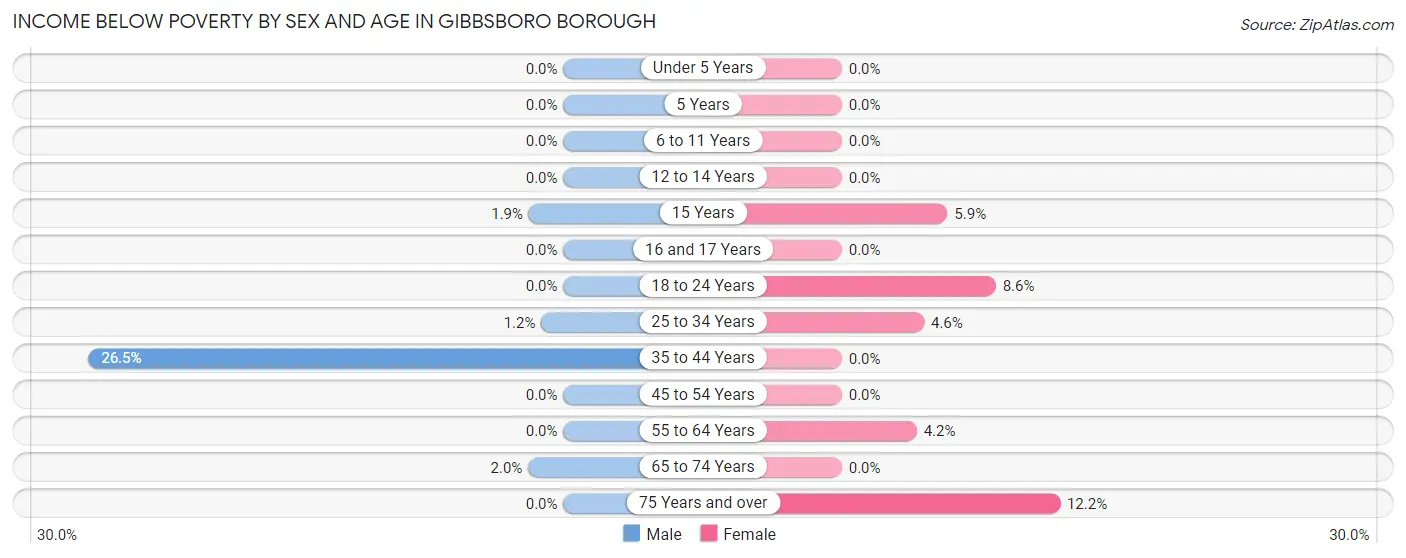
| Age Bracket | Male | Female |
| Under 5 Years | 0 (0.0%) | 0 (0.0%) |
| 5 Years | 0 (0.0%) | 0 (0.0%) |
| 6 to 11 Years | 0 (0.0%) | 0 (0.0%) |
| 12 to 14 Years | 0 (0.0%) | 0 (0.0%) |
| 15 Years | 1 (1.9%) | 3 (5.9%) |
| 16 and 17 Years | 0 (0.0%) | 0 (0.0%) |
| 18 to 24 Years | 0 (0.0%) | 6 (8.6%) |
| 25 to 34 Years | 1 (1.2%) | 6 (4.6%) |
| 35 to 44 Years | 41 (26.5%) | 0 (0.0%) |
| 45 to 54 Years | 0 (0.0%) | 0 (0.0%) |
| 55 to 64 Years | 0 (0.0%) | 7 (4.2%) |
| 65 to 74 Years | 2 (2.0%) | 0 (0.0%) |
| 75 Years and over | 0 (0.0%) | 13 (12.1%) |
| Total | 45 (3.9%) | 35 (3.2%) |
Income Above Poverty by Sex and Age in Gibbsboro borough
According to the poverty statistics in Gibbsboro borough, males aged under 5 years and females aged under 5 years are the age groups that are most secure financially, with 100.0% of males and 100.0% of females in these age groups living above the poverty line.
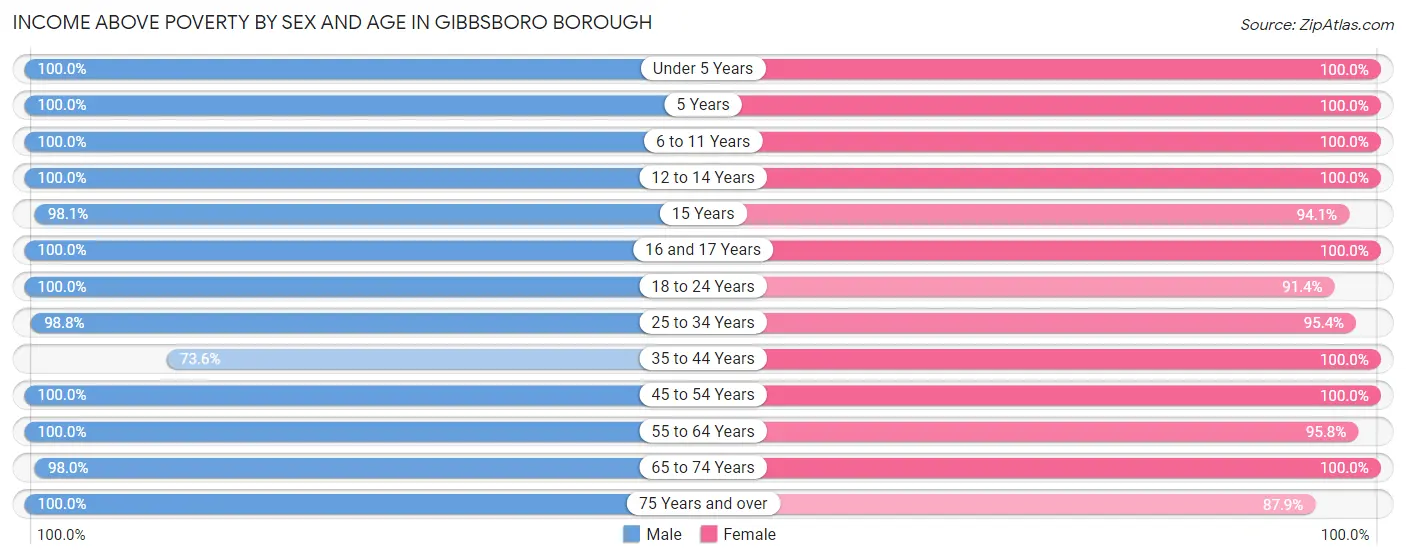
| Age Bracket | Male | Female |
| Under 5 Years | 69 (100.0%) | 59 (100.0%) |
| 5 Years | 36 (100.0%) | 8 (100.0%) |
| 6 to 11 Years | 72 (100.0%) | 51 (100.0%) |
| 12 to 14 Years | 27 (100.0%) | 44 (100.0%) |
| 15 Years | 51 (98.1%) | 48 (94.1%) |
| 16 and 17 Years | 12 (100.0%) | 67 (100.0%) |
| 18 to 24 Years | 74 (100.0%) | 64 (91.4%) |
| 25 to 34 Years | 80 (98.8%) | 125 (95.4%) |
| 35 to 44 Years | 114 (73.6%) | 137 (100.0%) |
| 45 to 54 Years | 173 (100.0%) | 104 (100.0%) |
| 55 to 64 Years | 167 (100.0%) | 161 (95.8%) |
| 65 to 74 Years | 100 (98.0%) | 115 (100.0%) |
| 75 Years and over | 146 (100.0%) | 94 (87.8%) |
| Total | 1,121 (96.1%) | 1,077 (96.9%) |
Income Below Poverty Among Married-Couple Families in Gibbsboro borough
The poverty statistics for married-couple families in Gibbsboro borough show that 0.4% or 2 of the total 443 families live below the poverty line. Families with no children have the highest poverty rate of 0.9%, comprising of 2 families. On the other hand, families with 1 or 2 children have the lowest poverty rate of 0.0%, which includes 0 families.
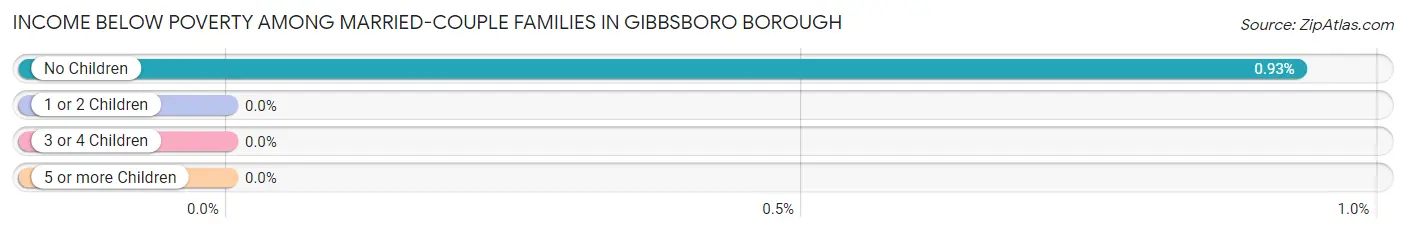
| Children | Above Poverty | Below Poverty |
| No Children | 214 (99.1%) | 2 (0.9%) |
| 1 or 2 Children | 184 (100.0%) | 0 (0.0%) |
| 3 or 4 Children | 43 (100.0%) | 0 (0.0%) |
| 5 or more Children | 0 (0.0%) | 0 (0.0%) |
| Total | 441 (99.6%) | 2 (0.4%) |
Income Below Poverty Among Single-Parent Households in Gibbsboro borough
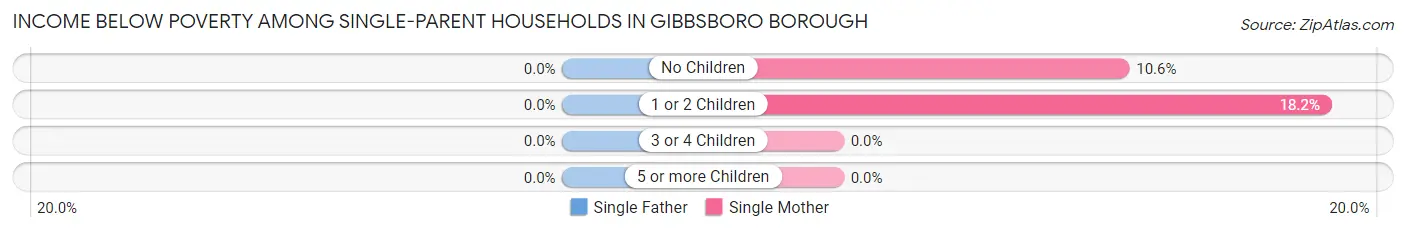
| Children | Single Father | Single Mother |
| No Children | 0 (0.0%) | 5 (10.6%) |
| 1 or 2 Children | 0 (0.0%) | 2 (18.2%) |
| 3 or 4 Children | 0 (0.0%) | 0 (0.0%) |
| 5 or more Children | 0 (0.0%) | 0 (0.0%) |
| Total | 0 (0.0%) | 7 (10.0%) |
Income Below Poverty Among Married-Couple vs Single-Parent Households in Gibbsboro borough
The poverty data for Gibbsboro borough shows that 2 of the married-couple family households (0.4%) and 7 of the single-parent households (4.5%) are living below the poverty level. Within the married-couple family households, those with no children have the highest poverty rate, with 2 households (0.9%) falling below the poverty line. Among the single-parent households, those with 1 or 2 children have the highest poverty rate, with 2 household (5.9%) living below poverty.
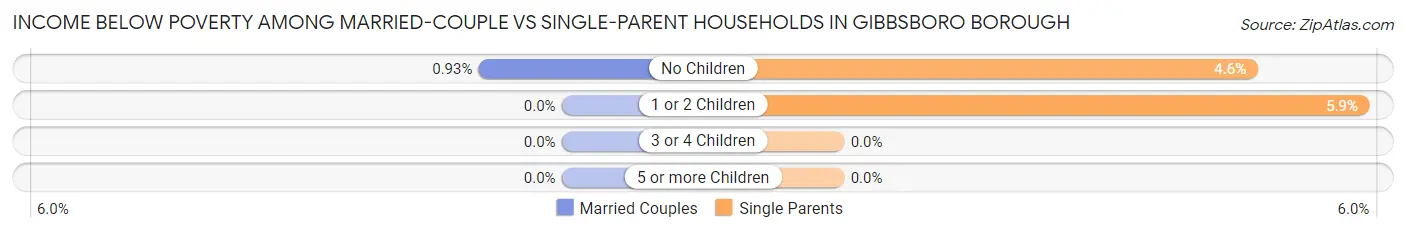
| Children | Married-Couple Families | Single-Parent Households |
| No Children | 2 (0.9%) | 5 (4.6%) |
| 1 or 2 Children | 0 (0.0%) | 2 (5.9%) |
| 3 or 4 Children | 0 (0.0%) | 0 (0.0%) |
| 5 or more Children | 0 (0.0%) | 0 (0.0%) |
| Total | 2 (0.4%) | 7 (4.5%) |
Race in Gibbsboro borough
The most populous races in Gibbsboro borough are White / Caucasian (1,884 | 82.7%), Hispanic or Latino (218 | 9.6%), and Two or more Races (149 | 6.5%).
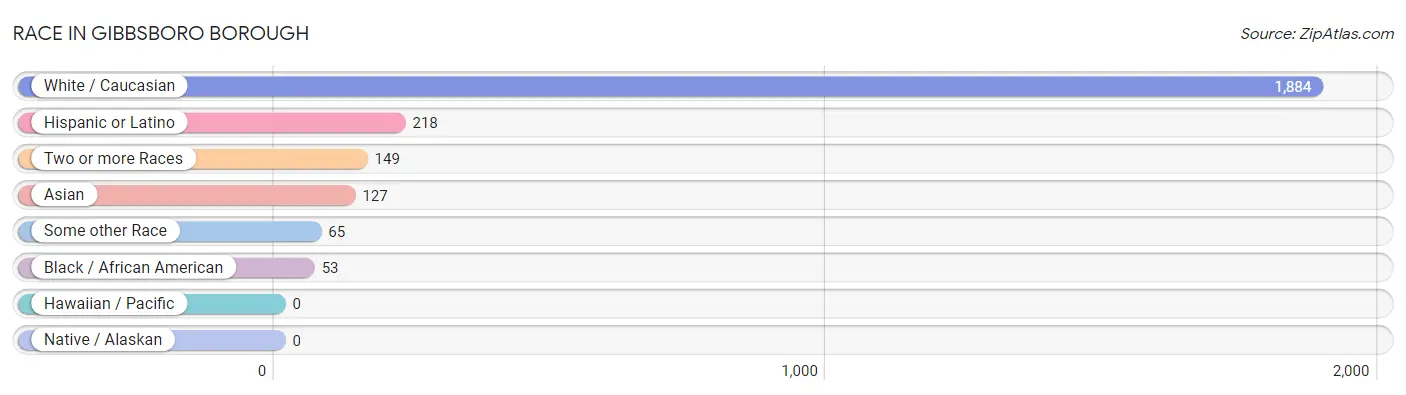
| Race | # Population | % Population |
| Asian | 127 | 5.6% |
| Black / African American | 53 | 2.3% |
| Hawaiian / Pacific | 0 | 0.0% |
| Hispanic or Latino | 218 | 9.6% |
| Native / Alaskan | 0 | 0.0% |
| White / Caucasian | 1,884 | 82.7% |
| Two or more Races | 149 | 6.5% |
| Some other Race | 65 | 2.9% |
| Total | 2,278 | 100.0% |
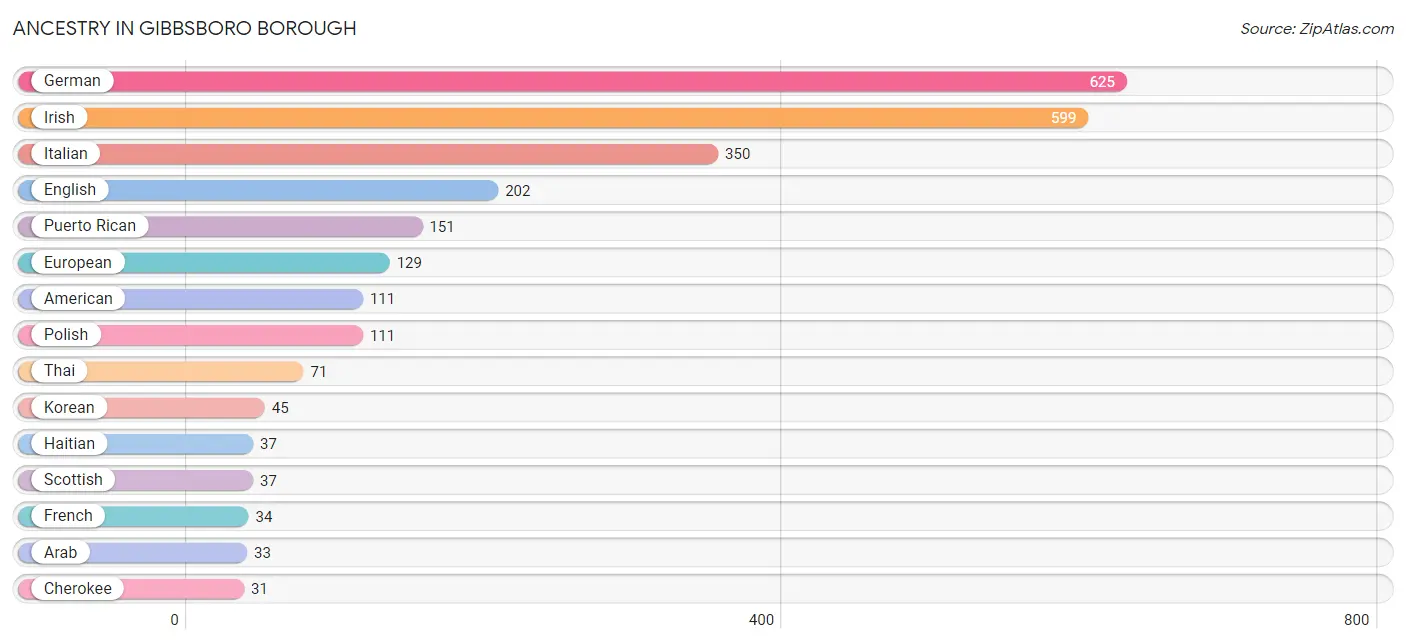
Ancestry in Gibbsboro borough
The most populous ancestries reported in Gibbsboro borough are German (625 | 27.4%), Irish (599 | 26.3%), Italian (350 | 15.4%), English (202 | 8.9%), and Puerto Rican (151 | 6.6%), together accounting for 84.6% of all Gibbsboro borough residents.
| Ancestry | # Population | % Population |
| American | 111 | 4.9% |
| Arab | 33 | 1.5% |
| Armenian | 9 | 0.4% |
| Bhutanese | 2 | 0.1% |
| British | 2 | 0.1% |
| Central American | 8 | 0.4% |
| Cherokee | 31 | 1.4% |
| Colombian | 15 | 0.7% |
| Cuban | 6 | 0.3% |
| Czech | 2 | 0.1% |
| Danish | 2 | 0.1% |
| Dominican | 7 | 0.3% |
| Dutch | 7 | 0.3% |
| English | 202 | 8.9% |
| European | 129 | 5.7% |
| Finnish | 3 | 0.1% |
| French | 34 | 1.5% |
| German | 625 | 27.4% |
| Greek | 2 | 0.1% |
| Haitian | 37 | 1.6% |
| Hungarian | 11 | 0.5% |
| Indian (Asian) | 23 | 1.0% |
| Irish | 599 | 26.3% |
| Italian | 350 | 15.4% |
| Korean | 45 | 2.0% |
| Lebanese | 29 | 1.3% |
| Lithuanian | 22 | 1.0% |
| Mexican | 22 | 1.0% |
| Moroccan | 4 | 0.2% |
| Nicaraguan | 7 | 0.3% |
| Polish | 111 | 4.9% |
| Portuguese | 8 | 0.4% |
| Puerto Rican | 151 | 6.6% |
| Romanian | 2 | 0.1% |
| Russian | 25 | 1.1% |
| Salvadoran | 1 | 0.0% |
| Scandinavian | 6 | 0.3% |
| Scotch-Irish | 8 | 0.4% |
| Scottish | 37 | 1.6% |
| Serbian | 19 | 0.8% |
| Slovene | 11 | 0.5% |
| South American | 15 | 0.7% |
| Spaniard | 8 | 0.4% |
| Spanish | 1 | 0.0% |
| Swedish | 7 | 0.3% |
| Swiss | 3 | 0.1% |
| Thai | 71 | 3.1% |
| Ukrainian | 6 | 0.3% |
| Welsh | 2 | 0.1% | View All 49 Rows |
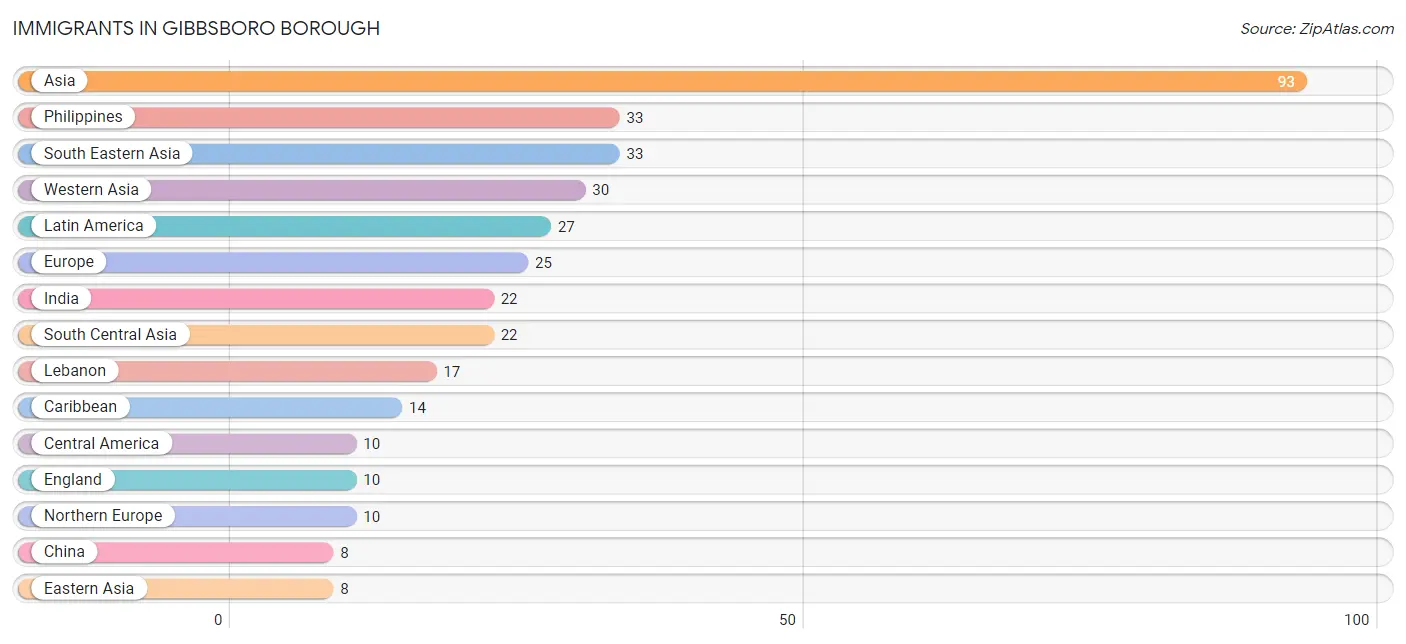
Immigrants in Gibbsboro borough
The most numerous immigrant groups reported in Gibbsboro borough came from Asia (93 | 4.1%), Philippines (33 | 1.5%), South Eastern Asia (33 | 1.5%), Western Asia (30 | 1.3%), and Latin America (27 | 1.2%), together accounting for 9.5% of all Gibbsboro borough residents.
| Immigration Origin | # Population | % Population |
| Africa | 4 | 0.2% |
| Asia | 93 | 4.1% |
| Caribbean | 14 | 0.6% |
| Central America | 10 | 0.4% |
| China | 8 | 0.4% |
| Colombia | 3 | 0.1% |
| Dominican Republic | 7 | 0.3% |
| Eastern Asia | 8 | 0.4% |
| Eastern Europe | 5 | 0.2% |
| England | 10 | 0.4% |
| Europe | 25 | 1.1% |
| Germany | 5 | 0.2% |
| India | 22 | 1.0% |
| Israel | 4 | 0.2% |
| Italy | 3 | 0.1% |
| Jamaica | 7 | 0.3% |
| Latin America | 27 | 1.2% |
| Lebanon | 17 | 0.7% |
| Mexico | 3 | 0.1% |
| Morocco | 4 | 0.2% |
| Nicaragua | 7 | 0.3% |
| Northern Africa | 4 | 0.2% |
| Northern Europe | 10 | 0.4% |
| Philippines | 33 | 1.5% |
| Poland | 5 | 0.2% |
| Portugal | 2 | 0.1% |
| South America | 3 | 0.1% |
| South Central Asia | 22 | 1.0% |
| South Eastern Asia | 33 | 1.5% |
| Southern Europe | 5 | 0.2% |
| Western Asia | 30 | 1.3% |
| Western Europe | 5 | 0.2% | View All 32 Rows |
Sex and Age in Gibbsboro borough
Sex and Age in Gibbsboro borough
The most populous age groups in Gibbsboro borough are 35 to 39 Years (131 | 11.2%) for men and 15 to 19 Years (123 | 11.1%) for women.
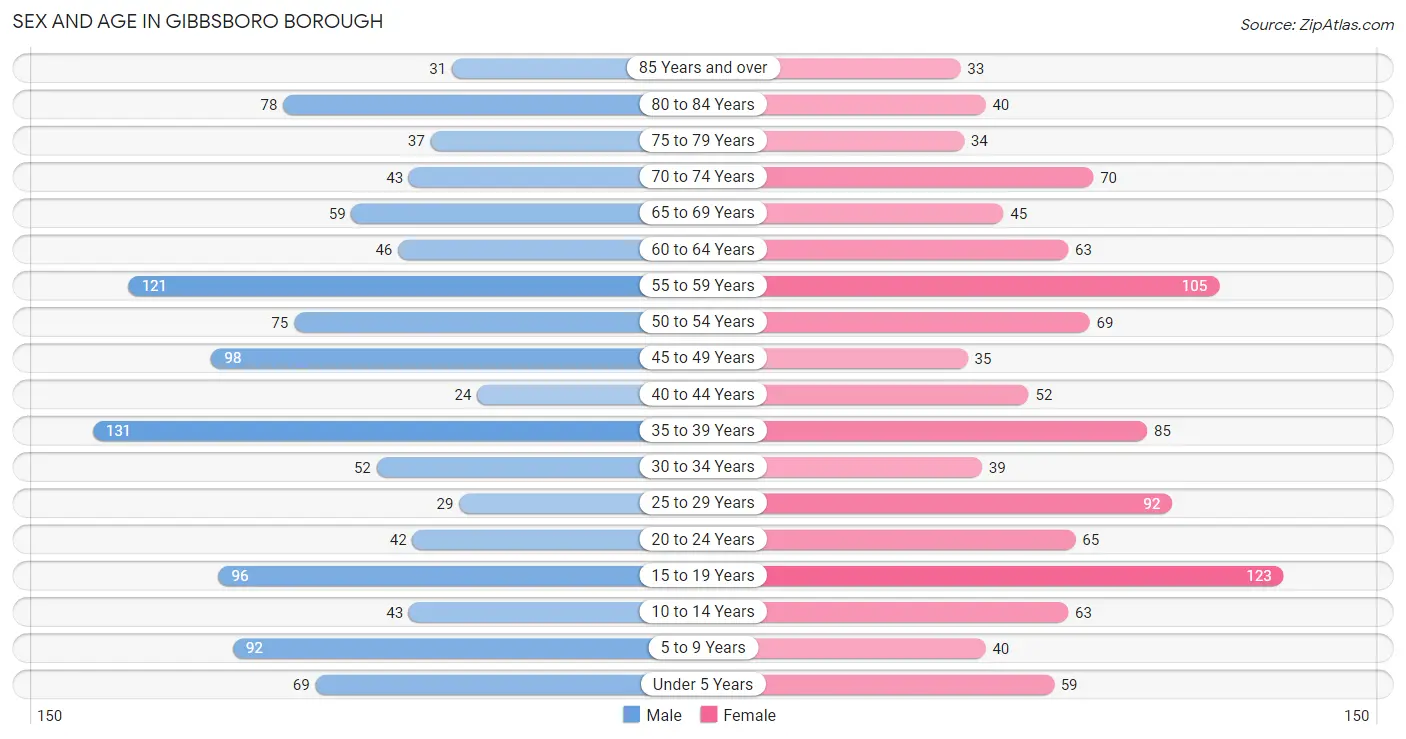
| Age Bracket | Male | Female |
| Under 5 Years | 69 (5.9%) | 59 (5.3%) |
| 5 to 9 Years | 92 (7.9%) | 40 (3.6%) |
| 10 to 14 Years | 43 (3.7%) | 63 (5.7%) |
| 15 to 19 Years | 96 (8.2%) | 123 (11.1%) |
| 20 to 24 Years | 42 (3.6%) | 65 (5.9%) |
| 25 to 29 Years | 29 (2.5%) | 92 (8.3%) |
| 30 to 34 Years | 52 (4.5%) | 39 (3.5%) |
| 35 to 39 Years | 131 (11.2%) | 85 (7.6%) |
| 40 to 44 Years | 24 (2.1%) | 52 (4.7%) |
| 45 to 49 Years | 98 (8.4%) | 35 (3.2%) |
| 50 to 54 Years | 75 (6.4%) | 69 (6.2%) |
| 55 to 59 Years | 121 (10.4%) | 105 (9.4%) |
| 60 to 64 Years | 46 (4.0%) | 63 (5.7%) |
| 65 to 69 Years | 59 (5.1%) | 45 (4.1%) |
| 70 to 74 Years | 43 (3.7%) | 70 (6.3%) |
| 75 to 79 Years | 37 (3.2%) | 34 (3.1%) |
| 80 to 84 Years | 78 (6.7%) | 40 (3.6%) |
| 85 Years and over | 31 (2.7%) | 33 (3.0%) |
| Total | 1,166 (100.0%) | 1,112 (100.0%) |
Families and Households in Gibbsboro borough
Median Family Size in Gibbsboro borough
The median family size in Gibbsboro borough is 3.37 persons per family, with married-couple families (443 | 74.2%) accounting for the largest median family size of 3.69 persons per family. On the other hand, single male/father families (84 | 14.1%) represent the smallest median family size with 2.18 persons per family.
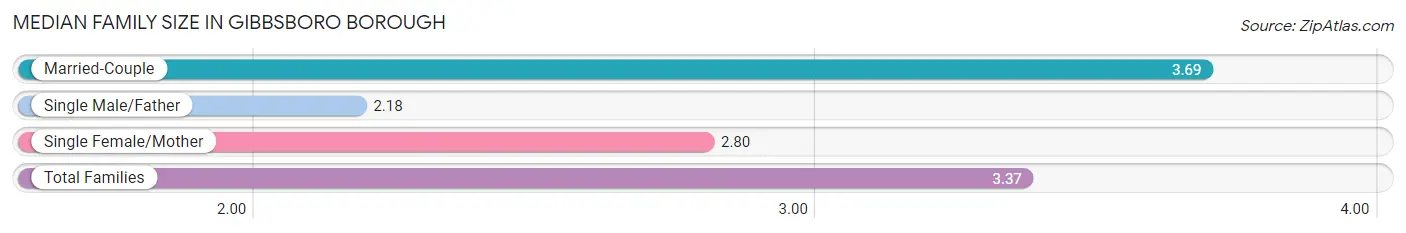
| Family Type | # Families | Family Size |
| Married-Couple | 443 (74.2%) | 3.69 |
| Single Male/Father | 84 (14.1%) | 2.18 |
| Single Female/Mother | 70 (11.7%) | 2.80 |
| Total Families | 597 (100.0%) | 3.37 |
Median Household Size in Gibbsboro borough
The median household size in Gibbsboro borough is 2.91 persons per household, with married-couple households (443 | 56.7%) accounting for the largest median household size of 3.71 persons per household. non-family households (185 | 23.7%) represent the smallest median household size with 1.26 persons per household.
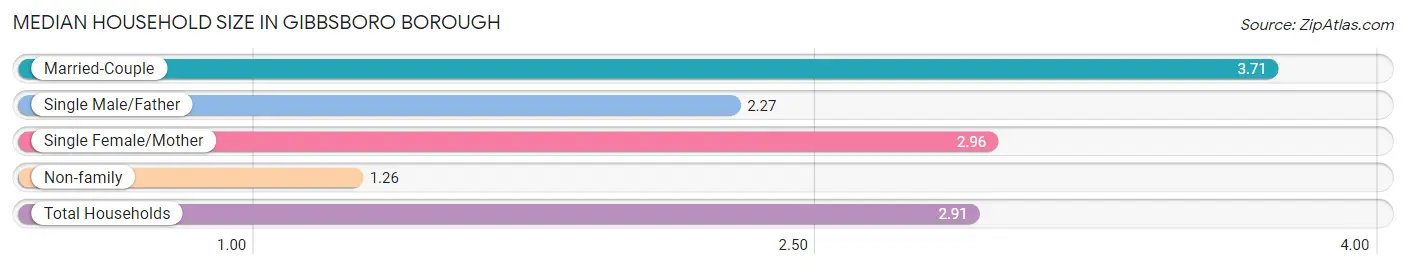
| Household Type | # Households | Household Size |
| Married-Couple | 443 (56.7%) | 3.71 |
| Single Male/Father | 84 (10.7%) | 2.27 |
| Single Female/Mother | 70 (8.9%) | 2.96 |
| Non-family | 185 (23.7%) | 1.26 |
| Total Households | 782 (100.0%) | 2.91 |
Household Size by Marriage Status in Gibbsboro borough
Out of a total of 782 households in Gibbsboro borough, 597 (76.3%) are family households, while 185 (23.7%) are nonfamily households. The most numerous type of family households are 2-person households, comprising 242, and the most common type of nonfamily households are 1-person households, comprising 142.
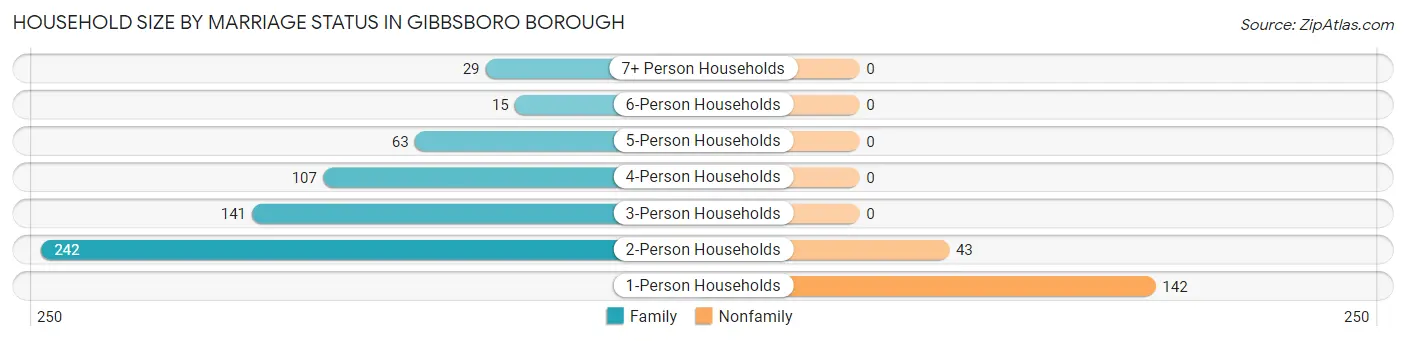
| Household Size | Family Households | Nonfamily Households |
| 1-Person Households | - | 142 (18.2%) |
| 2-Person Households | 242 (30.9%) | 43 (5.5%) |
| 3-Person Households | 141 (18.0%) | 0 (0.0%) |
| 4-Person Households | 107 (13.7%) | 0 (0.0%) |
| 5-Person Households | 63 (8.1%) | 0 (0.0%) |
| 6-Person Households | 15 (1.9%) | 0 (0.0%) |
| 7+ Person Households | 29 (3.7%) | 0 (0.0%) |
| Total | 597 (76.3%) | 185 (23.7%) |
Female Fertility in Gibbsboro borough
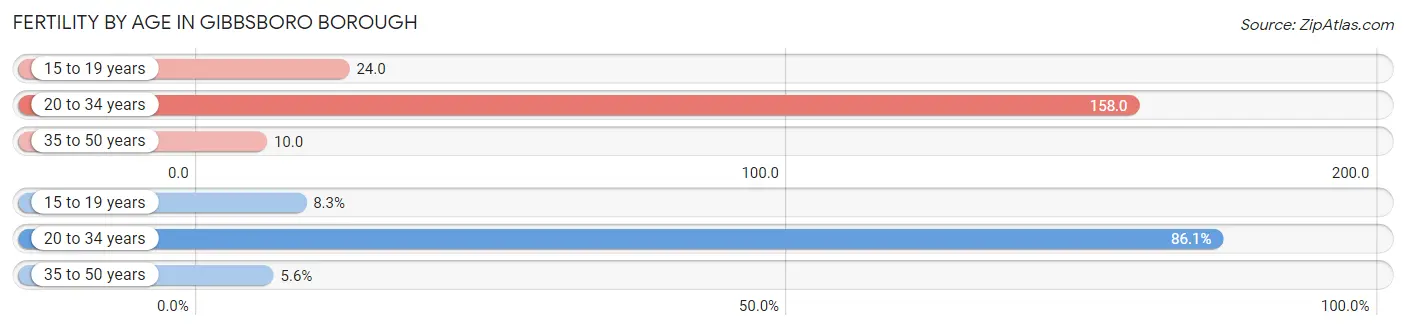
Fertility by Age in Gibbsboro borough
Average fertility rate in Gibbsboro borough is 69.0 births per 1,000 women. Women in the age bracket of 20 to 34 years have the highest fertility rate with 158.0 births per 1,000 women. Women in the age bracket of 20 to 34 years acount for 86.1% of all women with births.
| Age Bracket | Women with Births | Births / 1,000 Women |
| 15 to 19 years | 3 (8.3%) | 24.0 |
| 20 to 34 years | 31 (86.1%) | 158.0 |
| 35 to 50 years | 2 (5.6%) | 10.0 |
| Total | 36 (100.0%) | 69.0 |
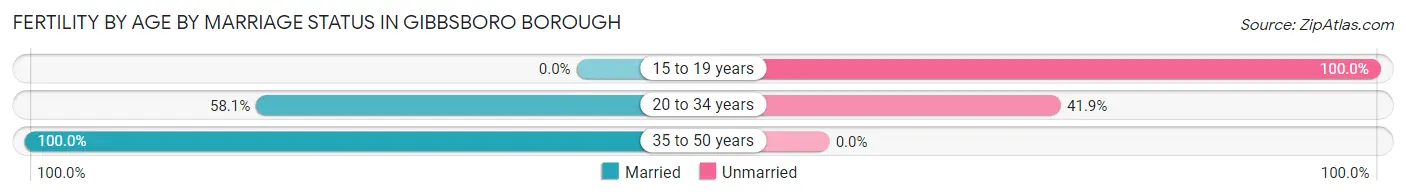
Fertility by Age by Marriage Status in Gibbsboro borough
55.6% of women with births (36) in Gibbsboro borough are married. The highest percentage of unmarried women with births falls into 15 to 19 years age bracket with 100.0% of them unmarried at the time of birth, while the lowest percentage of unmarried women with births belong to 35 to 50 years age bracket with 0.0% of them unmarried.
| Age Bracket | Married | Unmarried |
| 15 to 19 years | 0 (0.0%) | 3 (100.0%) |
| 20 to 34 years | 18 (58.1%) | 13 (41.9%) |
| 35 to 50 years | 2 (100.0%) | 0 (0.0%) |
| Total | 20 (55.6%) | 16 (44.4%) |
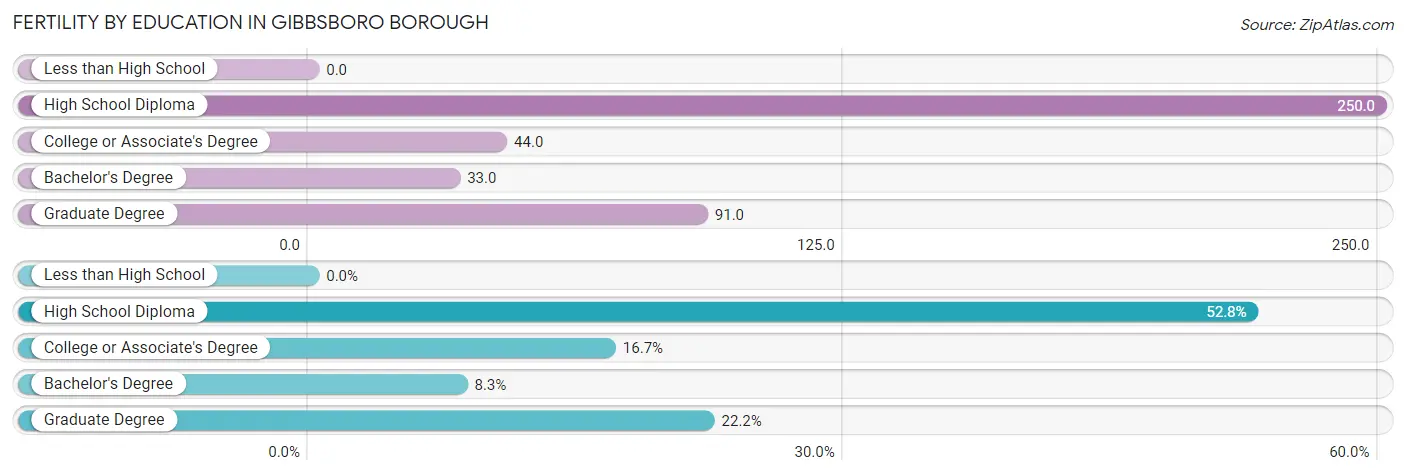
Fertility by Education in Gibbsboro borough
| Educational Attainment | Women with Births | Births / 1,000 Women |
| Less than High School | 0 (0.0%) | 0.0 |
| High School Diploma | 19 (52.8%) | 250.0 |
| College or Associate's Degree | 6 (16.7%) | 44.0 |
| Bachelor's Degree | 3 (8.3%) | 33.0 |
| Graduate Degree | 8 (22.2%) | 91.0 |
| Total | 36 (100.0%) | 69.0 |
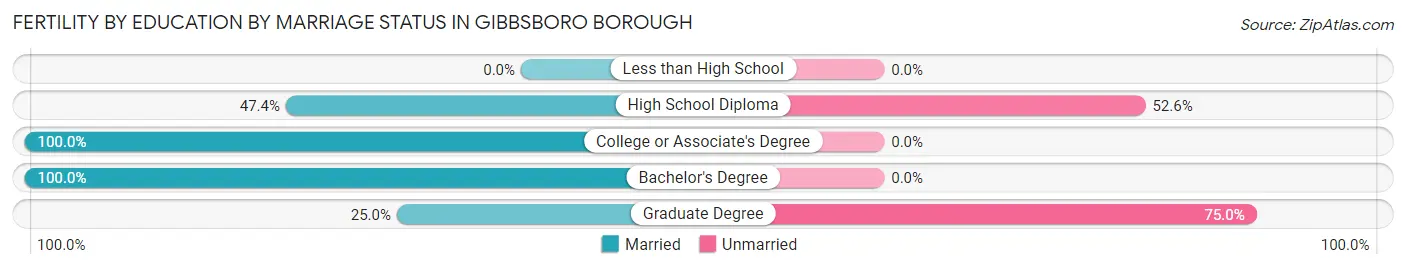
Fertility by Education by Marriage Status in Gibbsboro borough
44.4% of women with births in Gibbsboro borough are unmarried. Women with the educational attainment of college or associate's degree are most likely to be married with 100.0% of them married at childbirth, while women with the educational attainment of graduate degree are least likely to be married with 75.0% of them unmarried at childbirth.
| Educational Attainment | Married | Unmarried |
| Less than High School | 0 (0.0%) | 0 (0.0%) |
| High School Diploma | 9 (47.4%) | 10 (52.6%) |
| College or Associate's Degree | 6 (100.0%) | 0 (0.0%) |
| Bachelor's Degree | 3 (100.0%) | 0 (0.0%) |
| Graduate Degree | 2 (25.0%) | 6 (75.0%) |
| Total | 20 (55.6%) | 16 (44.4%) |
Employment Characteristics in Gibbsboro borough
Employment by Class of Employer in Gibbsboro borough
Among the 876 employed individuals in Gibbsboro borough, private company employees (568 | 64.8%), local government employees (117 | 13.4%), and not-for-profit organizations (87 | 9.9%) make up the most common classes of employment.
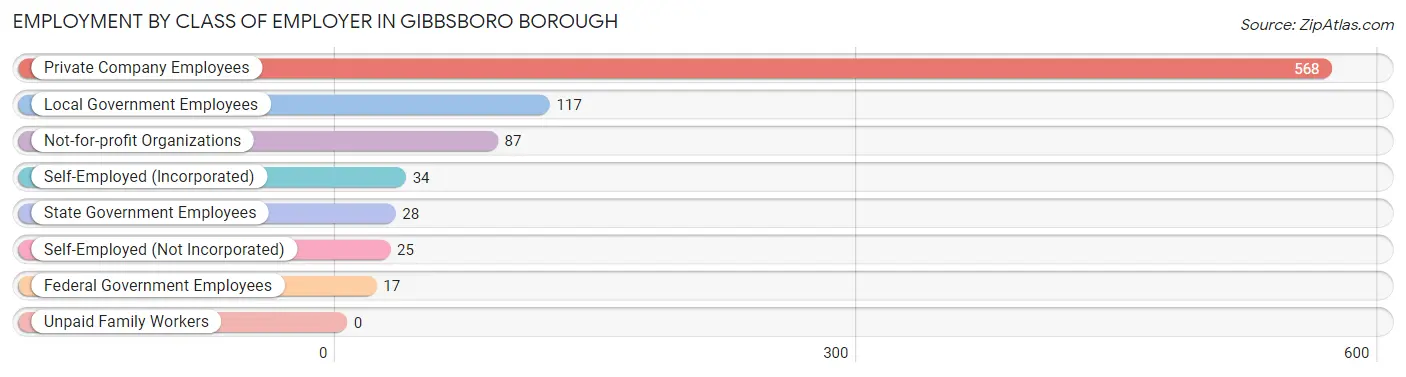
| Employer Class | # Employees | % Employees |
| Private Company Employees | 568 | 64.8% |
| Self-Employed (Incorporated) | 34 | 3.9% |
| Self-Employed (Not Incorporated) | 25 | 2.9% |
| Not-for-profit Organizations | 87 | 9.9% |
| Local Government Employees | 117 | 13.4% |
| State Government Employees | 28 | 3.2% |
| Federal Government Employees | 17 | 1.9% |
| Unpaid Family Workers | 0 | 0.0% |
| Total | 876 | 100.0% |
Employment Status by Age in Gibbsboro borough
According to the labor force statistics for Gibbsboro borough, out of the total population over 16 years of age (1,809), 55.7% or 1,008 individuals are in the labor force, with 8.7% or 88 of them unemployed. The age group with the highest labor force participation rate is 30 to 34 years, with 89.0% or 81 individuals in the labor force. Within the labor force, the 75 years and over age range has the highest percentage of unemployed individuals, with 33.3% or 7 of them being unemployed.
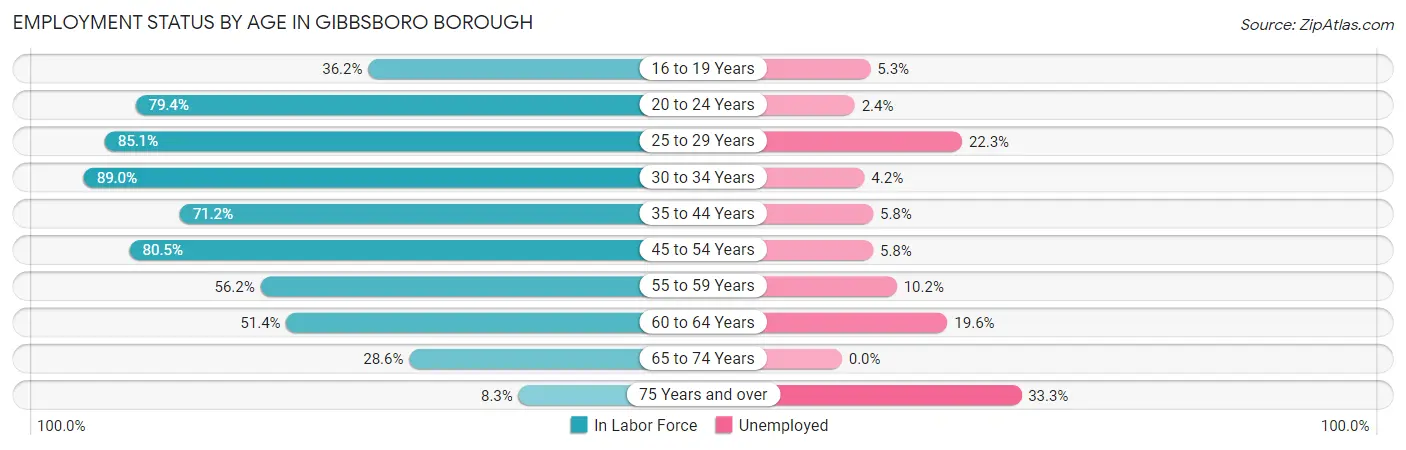
| Age Bracket | In Labor Force | Unemployed |
| 16 to 19 Years | 42 (36.2%) | 2 (5.3%) |
| 20 to 24 Years | 85 (79.4%) | 2 (2.4%) |
| 25 to 29 Years | 103 (85.1%) | 23 (22.3%) |
| 30 to 34 Years | 81 (89.0%) | 3 (4.2%) |
| 35 to 44 Years | 208 (71.2%) | 12 (5.8%) |
| 45 to 54 Years | 223 (80.5%) | 13 (5.8%) |
| 55 to 59 Years | 127 (56.2%) | 13 (10.2%) |
| 60 to 64 Years | 56 (51.4%) | 11 (19.6%) |
| 65 to 74 Years | 62 (28.6%) | 0 (0.0%) |
| 75 Years and over | 21 (8.3%) | 7 (33.3%) |
| Total | 1,008 (55.7%) | 88 (8.7%) |
Employment Status by Educational Attainment in Gibbsboro borough
According to labor force statistics for Gibbsboro borough, 71.5% of individuals (798) out of the total population between 25 and 64 years of age (1,116) are in the labor force, with 9.5% or 76 of them being unemployed. The group with the highest labor force participation rate are those with the educational attainment of bachelor's degree or higher, with 90.9% or 290 individuals in the labor force. Within the labor force, individuals with college / associate degree education have the highest percentage of unemployment, with 11.7% or 32 of them being unemployed.
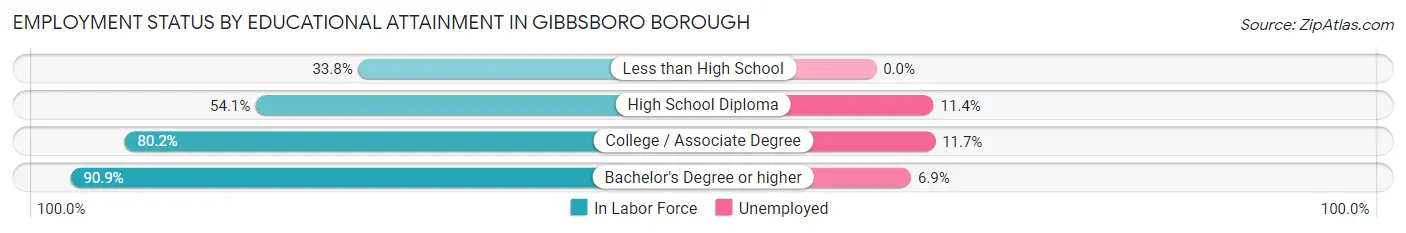
| Educational Attainment | In Labor Force | Unemployed |
| Less than High School | 22 (33.8%) | 0 (0.0%) |
| High School Diploma | 210 (54.1%) | 44 (11.4%) |
| College / Associate Degree | 276 (80.2%) | 40 (11.7%) |
| Bachelor's Degree or higher | 290 (90.9%) | 22 (6.9%) |
| Total | 798 (71.5%) | 106 (9.5%) |
Employment Occupations by Sex in Gibbsboro borough
Management, Business, Science and Arts Occupations
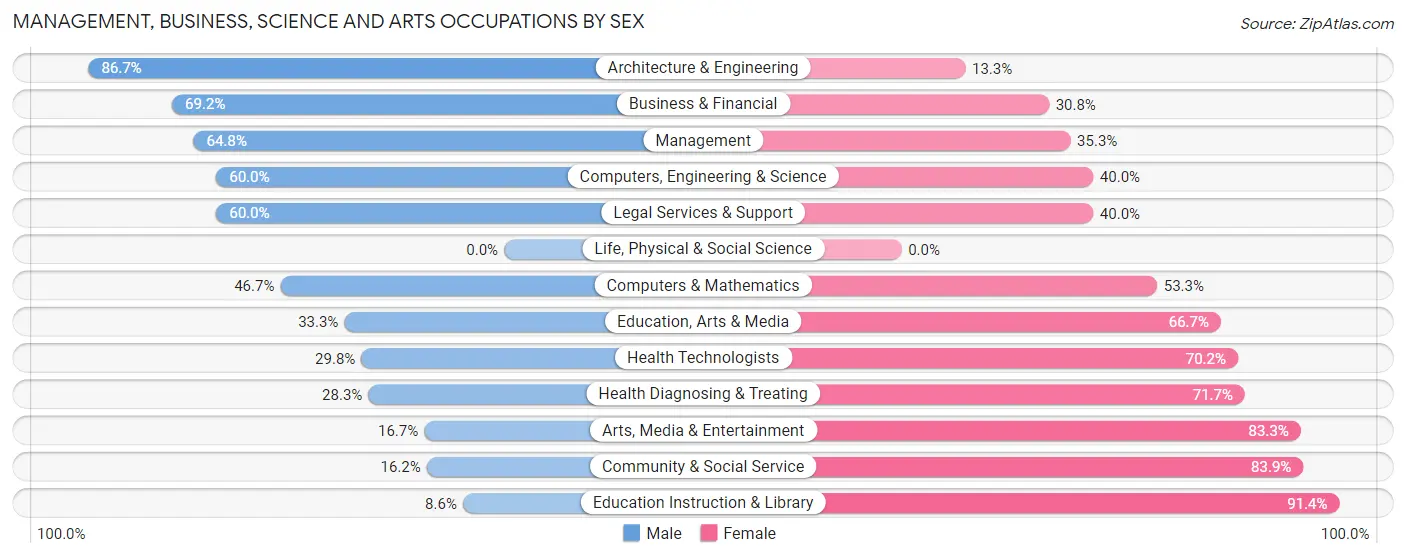
The most common Management, Business, Science and Arts occupations in Gibbsboro borough are Community & Social Service (130 | 14.3%), Management (122 | 13.4%), Education Instruction & Library (93 | 10.2%), Business & Financial (65 | 7.2%), and Health Diagnosing & Treating (60 | 6.6%).
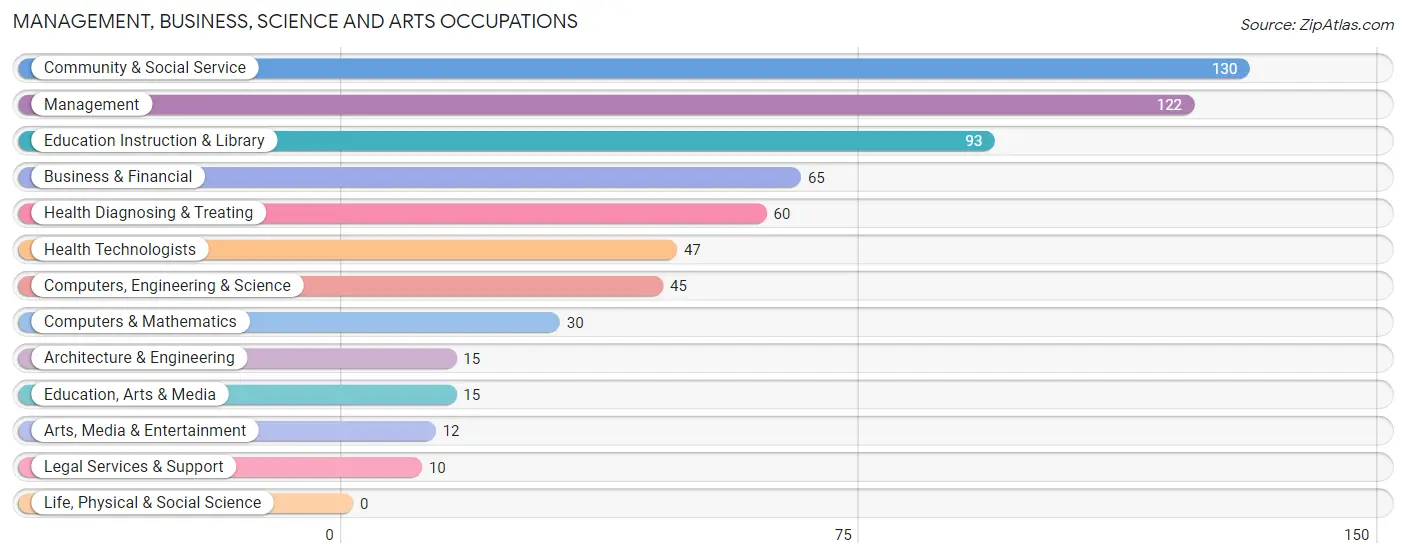
Management, Business, Science and Arts Occupations by Sex
Within the Management, Business, Science and Arts occupations in Gibbsboro borough, the most male-oriented occupations are Architecture & Engineering (86.7%), Business & Financial (69.2%), and Management (64.7%), while the most female-oriented occupations are Education Instruction & Library (91.4%), Community & Social Service (83.9%), and Arts, Media & Entertainment (83.3%).
| Occupation | Male | Female |
| Management | 79 (64.7%) | 43 (35.2%) |
| Business & Financial | 45 (69.2%) | 20 (30.8%) |
| Computers, Engineering & Science | 27 (60.0%) | 18 (40.0%) |
| Computers & Mathematics | 14 (46.7%) | 16 (53.3%) |
| Architecture & Engineering | 13 (86.7%) | 2 (13.3%) |
| Life, Physical & Social Science | 0 (0.0%) | 0 (0.0%) |
| Community & Social Service | 21 (16.2%) | 109 (83.9%) |
| Education, Arts & Media | 5 (33.3%) | 10 (66.7%) |
| Legal Services & Support | 6 (60.0%) | 4 (40.0%) |
| Education Instruction & Library | 8 (8.6%) | 85 (91.4%) |
| Arts, Media & Entertainment | 2 (16.7%) | 10 (83.3%) |
| Health Diagnosing & Treating | 17 (28.3%) | 43 (71.7%) |
| Health Technologists | 14 (29.8%) | 33 (70.2%) |
| Total (Category) | 189 (44.8%) | 233 (55.2%) |
| Total (Overall) | 466 (51.3%) | 442 (48.7%) |
Services Occupations
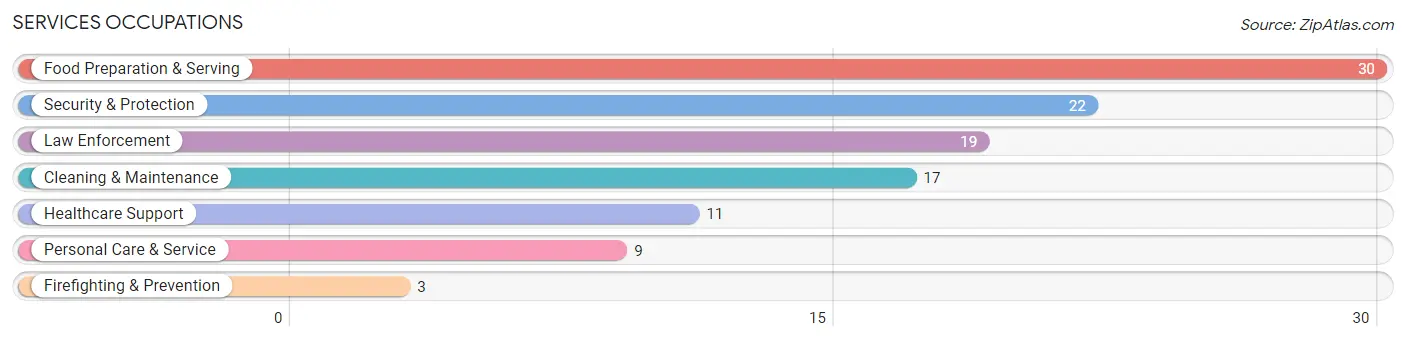
The most common Services occupations in Gibbsboro borough are Food Preparation & Serving (30 | 3.3%), Security & Protection (22 | 2.4%), Law Enforcement (19 | 2.1%), Cleaning & Maintenance (17 | 1.9%), and Healthcare Support (11 | 1.2%).
Services Occupations by Sex
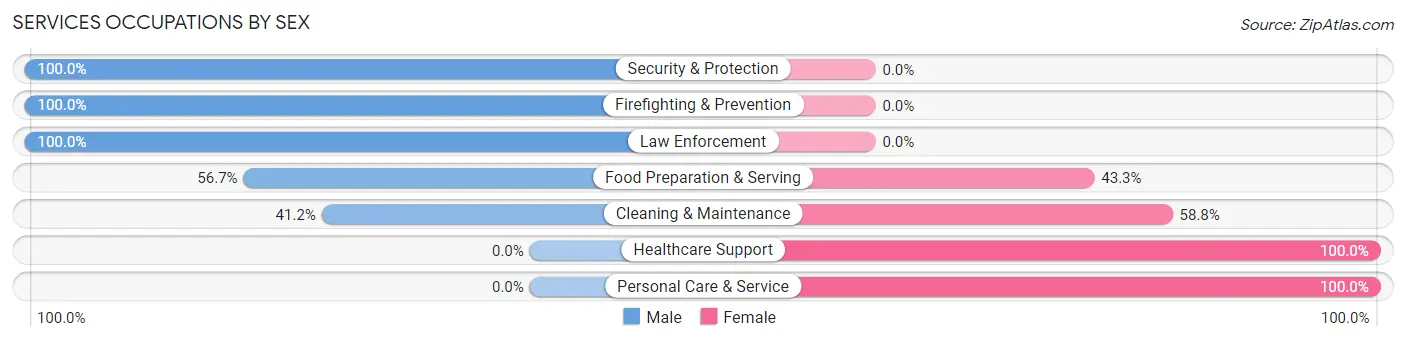
Within the Services occupations in Gibbsboro borough, the most male-oriented occupations are Security & Protection (100.0%), Firefighting & Prevention (100.0%), and Law Enforcement (100.0%), while the most female-oriented occupations are Healthcare Support (100.0%), Personal Care & Service (100.0%), and Cleaning & Maintenance (58.8%).
| Occupation | Male | Female |
| Healthcare Support | 0 (0.0%) | 11 (100.0%) |
| Security & Protection | 22 (100.0%) | 0 (0.0%) |
| Firefighting & Prevention | 3 (100.0%) | 0 (0.0%) |
| Law Enforcement | 19 (100.0%) | 0 (0.0%) |
| Food Preparation & Serving | 17 (56.7%) | 13 (43.3%) |
| Cleaning & Maintenance | 7 (41.2%) | 10 (58.8%) |
| Personal Care & Service | 0 (0.0%) | 9 (100.0%) |
| Total (Category) | 46 (51.7%) | 43 (48.3%) |
| Total (Overall) | 466 (51.3%) | 442 (48.7%) |
Sales and Office Occupations
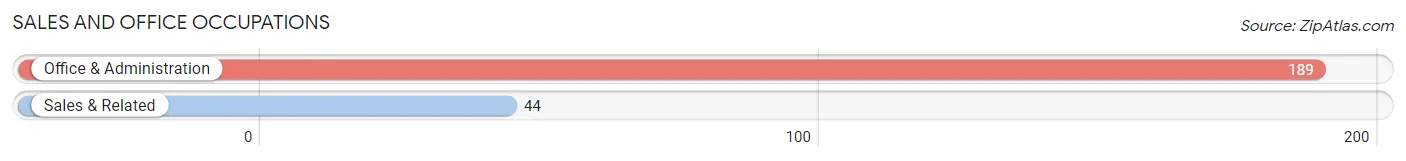
The most common Sales and Office occupations in Gibbsboro borough are Office & Administration (189 | 20.8%), and Sales & Related (44 | 4.9%).
Sales and Office Occupations by Sex
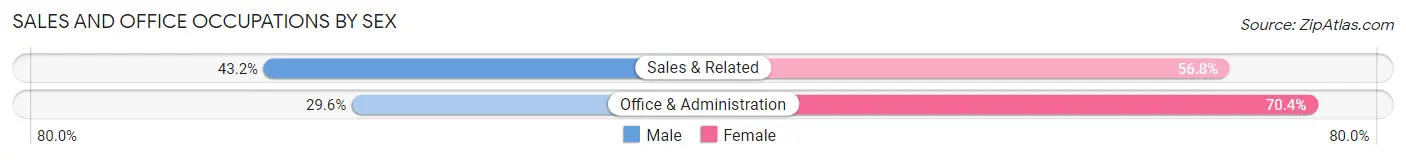
| Occupation | Male | Female |
| Sales & Related | 19 (43.2%) | 25 (56.8%) |
| Office & Administration | 56 (29.6%) | 133 (70.4%) |
| Total (Category) | 75 (32.2%) | 158 (67.8%) |
| Total (Overall) | 466 (51.3%) | 442 (48.7%) |
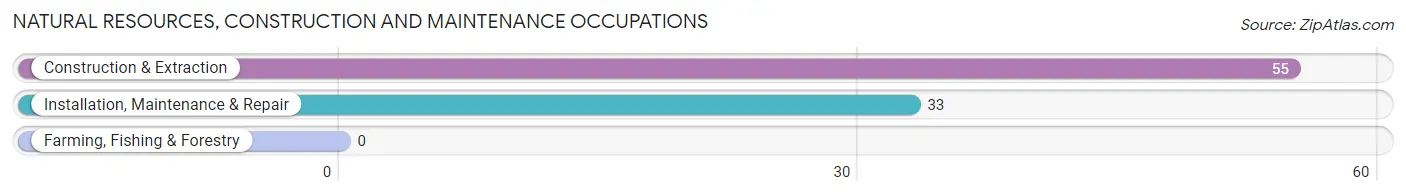
Natural Resources, Construction and Maintenance Occupations
The most common Natural Resources, Construction and Maintenance occupations in Gibbsboro borough are Construction & Extraction (55 | 6.1%), and Installation, Maintenance & Repair (33 | 3.6%).
Natural Resources, Construction and Maintenance Occupations by Sex
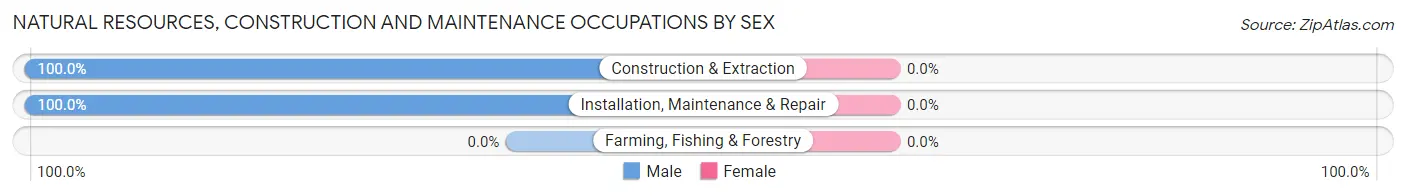
| Occupation | Male | Female |
| Farming, Fishing & Forestry | 0 (0.0%) | 0 (0.0%) |
| Construction & Extraction | 55 (100.0%) | 0 (0.0%) |
| Installation, Maintenance & Repair | 33 (100.0%) | 0 (0.0%) |
| Total (Category) | 88 (100.0%) | 0 (0.0%) |
| Total (Overall) | 466 (51.3%) | 442 (48.7%) |
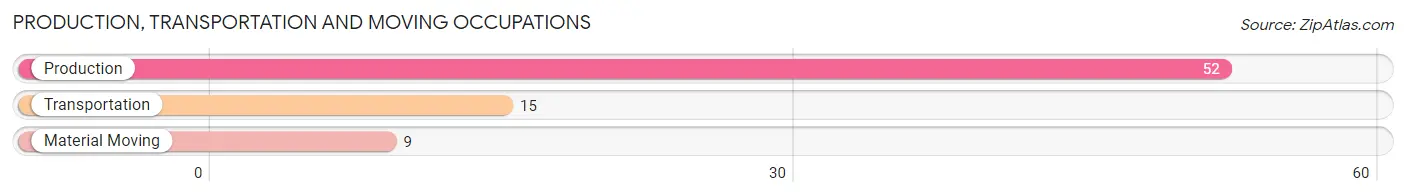
Production, Transportation and Moving Occupations
The most common Production, Transportation and Moving occupations in Gibbsboro borough are Production (52 | 5.7%), Transportation (15 | 1.7%), and Material Moving (9 | 1.0%).
Production, Transportation and Moving Occupations by Sex
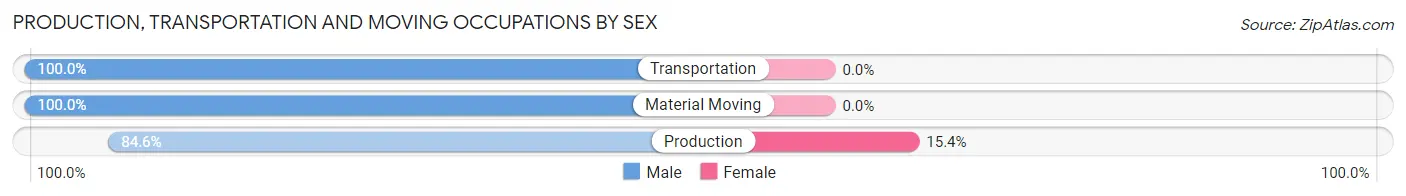
| Occupation | Male | Female |
| Production | 44 (84.6%) | 8 (15.4%) |
| Transportation | 15 (100.0%) | 0 (0.0%) |
| Material Moving | 9 (100.0%) | 0 (0.0%) |
| Total (Category) | 68 (89.5%) | 8 (10.5%) |
| Total (Overall) | 466 (51.3%) | 442 (48.7%) |
Employment Industries by Sex in Gibbsboro borough
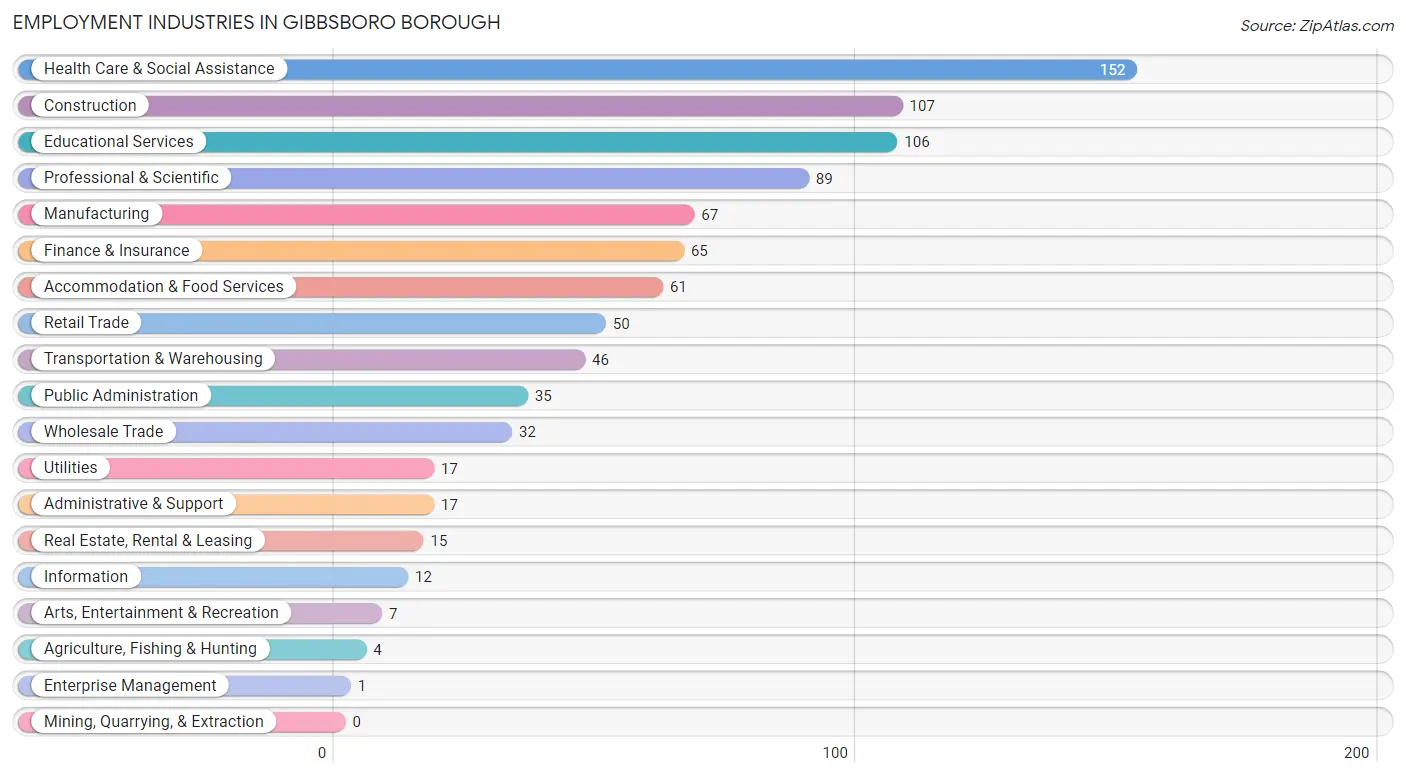
Employment Industries in Gibbsboro borough
The major employment industries in Gibbsboro borough include Health Care & Social Assistance (152 | 16.7%), Construction (107 | 11.8%), Educational Services (106 | 11.7%), Professional & Scientific (89 | 9.8%), and Manufacturing (67 | 7.4%).
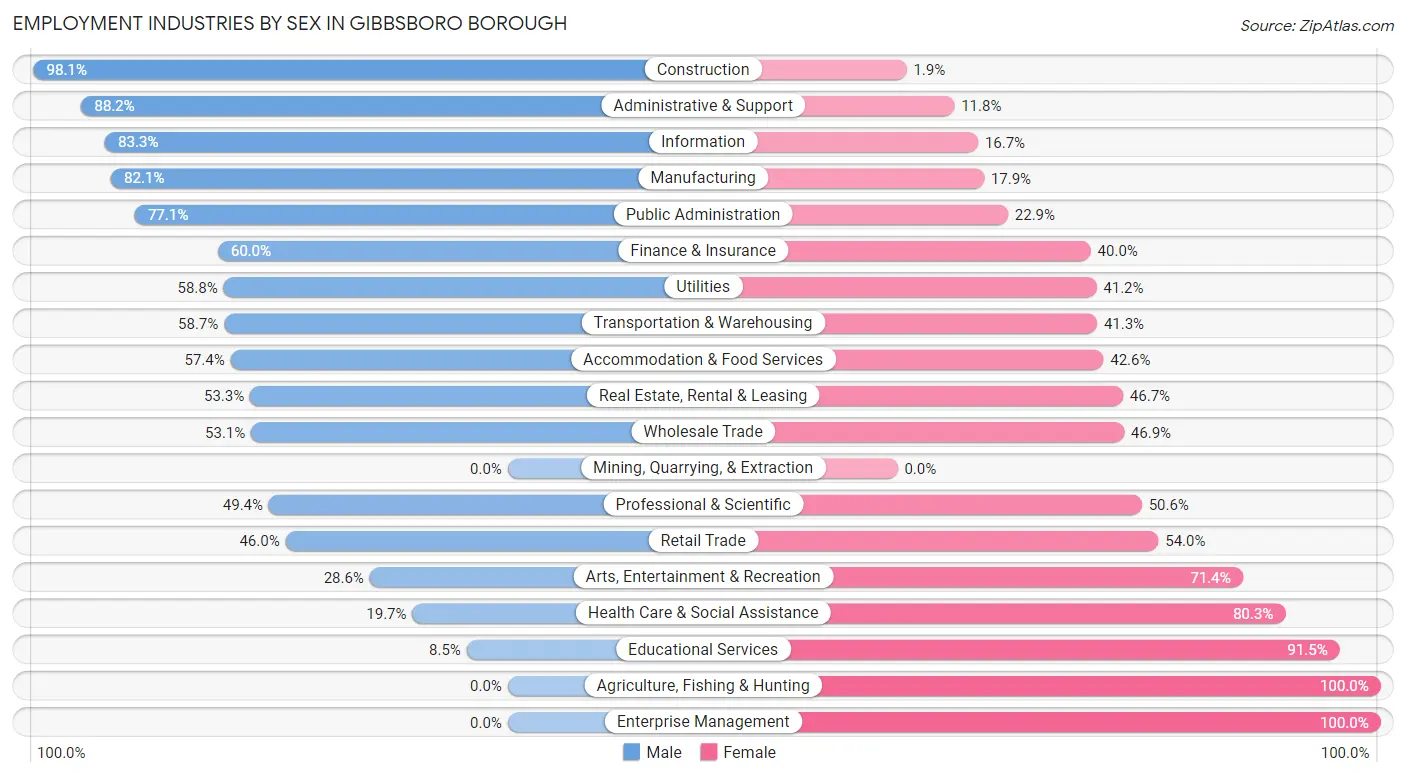
Employment Industries by Sex in Gibbsboro borough
The Gibbsboro borough industries that see more men than women are Construction (98.1%), Administrative & Support (88.2%), and Information (83.3%), whereas the industries that tend to have a higher number of women are Agriculture, Fishing & Hunting (100.0%), Enterprise Management (100.0%), and Educational Services (91.5%).
| Industry | Male | Female |
| Agriculture, Fishing & Hunting | 0 (0.0%) | 4 (100.0%) |
| Mining, Quarrying, & Extraction | 0 (0.0%) | 0 (0.0%) |
| Construction | 105 (98.1%) | 2 (1.9%) |
| Manufacturing | 55 (82.1%) | 12 (17.9%) |
| Wholesale Trade | 17 (53.1%) | 15 (46.9%) |
| Retail Trade | 23 (46.0%) | 27 (54.0%) |
| Transportation & Warehousing | 27 (58.7%) | 19 (41.3%) |
| Utilities | 10 (58.8%) | 7 (41.2%) |
| Information | 10 (83.3%) | 2 (16.7%) |
| Finance & Insurance | 39 (60.0%) | 26 (40.0%) |
| Real Estate, Rental & Leasing | 8 (53.3%) | 7 (46.7%) |
| Professional & Scientific | 44 (49.4%) | 45 (50.6%) |
| Enterprise Management | 0 (0.0%) | 1 (100.0%) |
| Administrative & Support | 15 (88.2%) | 2 (11.8%) |
| Educational Services | 9 (8.5%) | 97 (91.5%) |
| Health Care & Social Assistance | 30 (19.7%) | 122 (80.3%) |
| Arts, Entertainment & Recreation | 2 (28.6%) | 5 (71.4%) |
| Accommodation & Food Services | 35 (57.4%) | 26 (42.6%) |
| Public Administration | 27 (77.1%) | 8 (22.9%) |
| Total | 466 (51.3%) | 442 (48.7%) |
Education in Gibbsboro borough
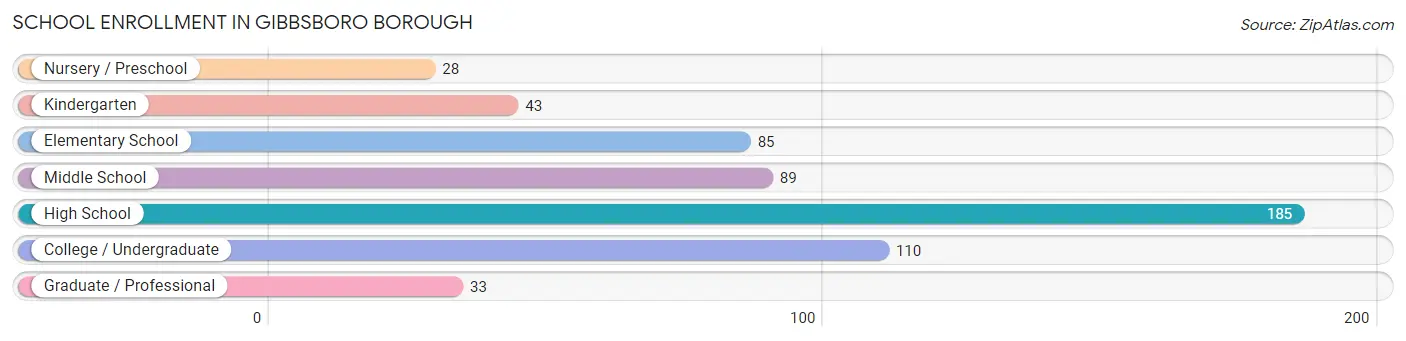
School Enrollment in Gibbsboro borough
The most common levels of schooling among the 573 students in Gibbsboro borough are high school (185 | 32.3%), college / undergraduate (110 | 19.2%), and middle school (89 | 15.5%).
| School Level | # Students | % Students |
| Nursery / Preschool | 28 | 4.9% |
| Kindergarten | 43 | 7.5% |
| Elementary School | 85 | 14.8% |
| Middle School | 89 | 15.5% |
| High School | 185 | 32.3% |
| College / Undergraduate | 110 | 19.2% |
| Graduate / Professional | 33 | 5.8% |
| Total | 573 | 100.0% |
School Enrollment by Age by Funding Source in Gibbsboro borough
Out of a total of 573 students who are enrolled in schools in Gibbsboro borough, 90 (15.7%) attend a private institution, while the remaining 483 (84.3%) are enrolled in public schools. The age group of 35 years and over has the highest likelihood of being enrolled in private schools, with 24 (66.7% in the age bracket) enrolled. Conversely, the age group of 15 to 17 year olds has the lowest likelihood of being enrolled in a private school, with 179 (100.0% in the age bracket) attending a public institution.
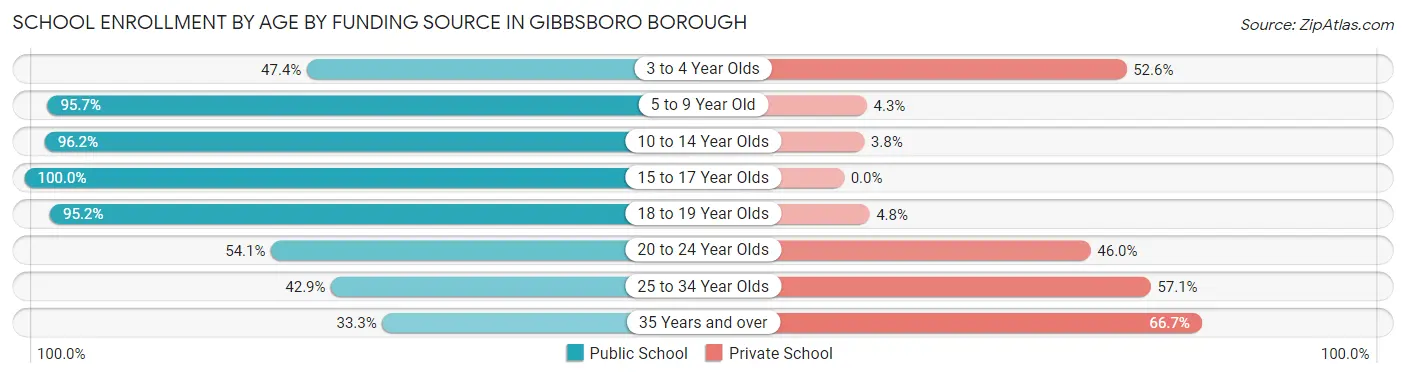
| Age Bracket | Public School | Private School |
| 3 to 4 Year Olds | 9 (47.4%) | 10 (52.6%) |
| 5 to 9 Year Old | 112 (95.7%) | 5 (4.3%) |
| 10 to 14 Year Olds | 102 (96.2%) | 4 (3.8%) |
| 15 to 17 Year Olds | 179 (100.0%) | 0 (0.0%) |
| 18 to 19 Year Olds | 20 (95.2%) | 1 (4.8%) |
| 20 to 24 Year Olds | 40 (54.0%) | 34 (46.0%) |
| 25 to 34 Year Olds | 9 (42.9%) | 12 (57.1%) |
| 35 Years and over | 12 (33.3%) | 24 (66.7%) |
| Total | 483 (84.3%) | 90 (15.7%) |
Educational Attainment by Field of Study in Gibbsboro borough
Business (121 | 26.3%), education (51 | 11.1%), science & technology (47 | 10.2%), liberal arts & history (36 | 7.8%), and arts & humanities (33 | 7.2%) are the most common fields of study among 460 individuals in Gibbsboro borough who have obtained a bachelor's degree or higher.
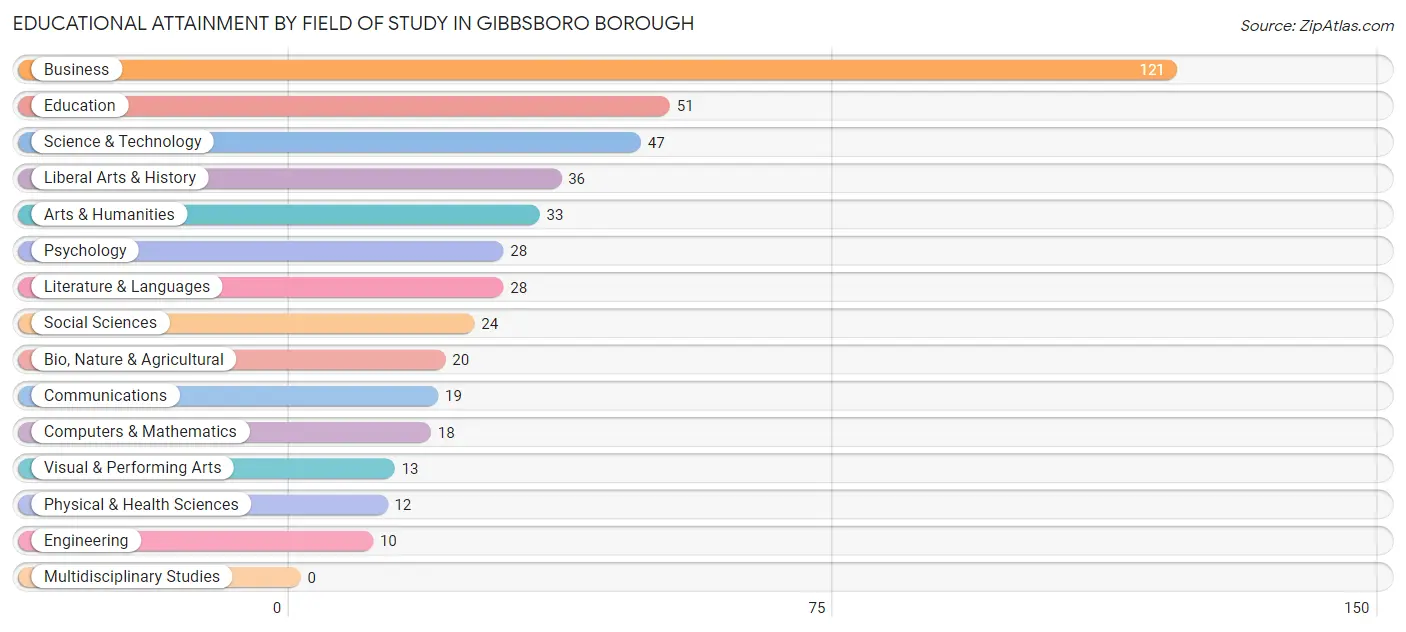
| Field of Study | # Graduates | % Graduates |
| Computers & Mathematics | 18 | 3.9% |
| Bio, Nature & Agricultural | 20 | 4.3% |
| Physical & Health Sciences | 12 | 2.6% |
| Psychology | 28 | 6.1% |
| Social Sciences | 24 | 5.2% |
| Engineering | 10 | 2.2% |
| Multidisciplinary Studies | 0 | 0.0% |
| Science & Technology | 47 | 10.2% |
| Business | 121 | 26.3% |
| Education | 51 | 11.1% |
| Literature & Languages | 28 | 6.1% |
| Liberal Arts & History | 36 | 7.8% |
| Visual & Performing Arts | 13 | 2.8% |
| Communications | 19 | 4.1% |
| Arts & Humanities | 33 | 7.2% |
| Total | 460 | 100.0% |
Transportation & Commute in Gibbsboro borough
Vehicle Availability by Sex in Gibbsboro borough
The most prevalent vehicle ownership categories in Gibbsboro borough are males with 2 vehicles (184, accounting for 40.2%) and females with 2 vehicles (188, making up 44.3%).
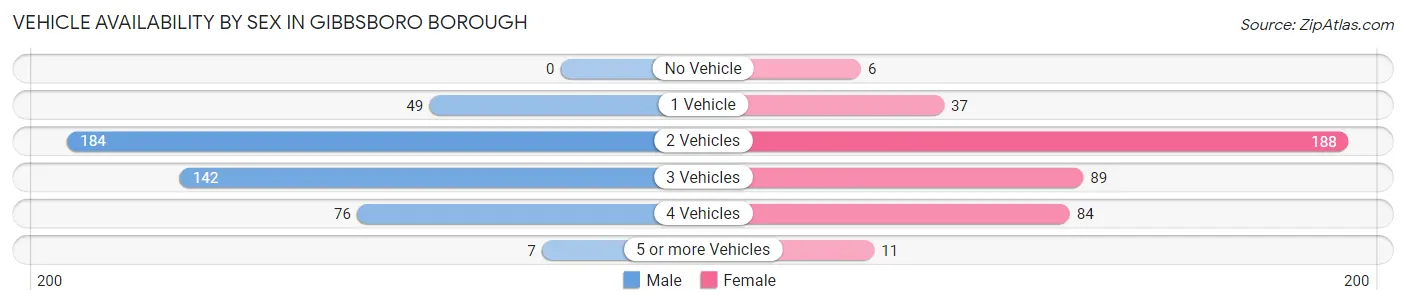
| Vehicles Available | Male | Female |
| No Vehicle | 0 (0.0%) | 6 (1.5%) |
| 1 Vehicle | 49 (10.7%) | 37 (8.9%) |
| 2 Vehicles | 184 (40.2%) | 188 (45.3%) |
| 3 Vehicles | 142 (31.0%) | 89 (21.4%) |
| 4 Vehicles | 76 (16.6%) | 84 (20.2%) |
| 5 or more Vehicles | 7 (1.5%) | 11 (2.6%) |
| Total | 458 (100.0%) | 415 (100.0%) |
Commute Time in Gibbsboro borough
The most frequently occuring commute durations in Gibbsboro borough are 30 to 34 minutes (123 commuters, 16.0%), 45 to 59 minutes (104 commuters, 13.5%), and 20 to 24 minutes (102 commuters, 13.3%).
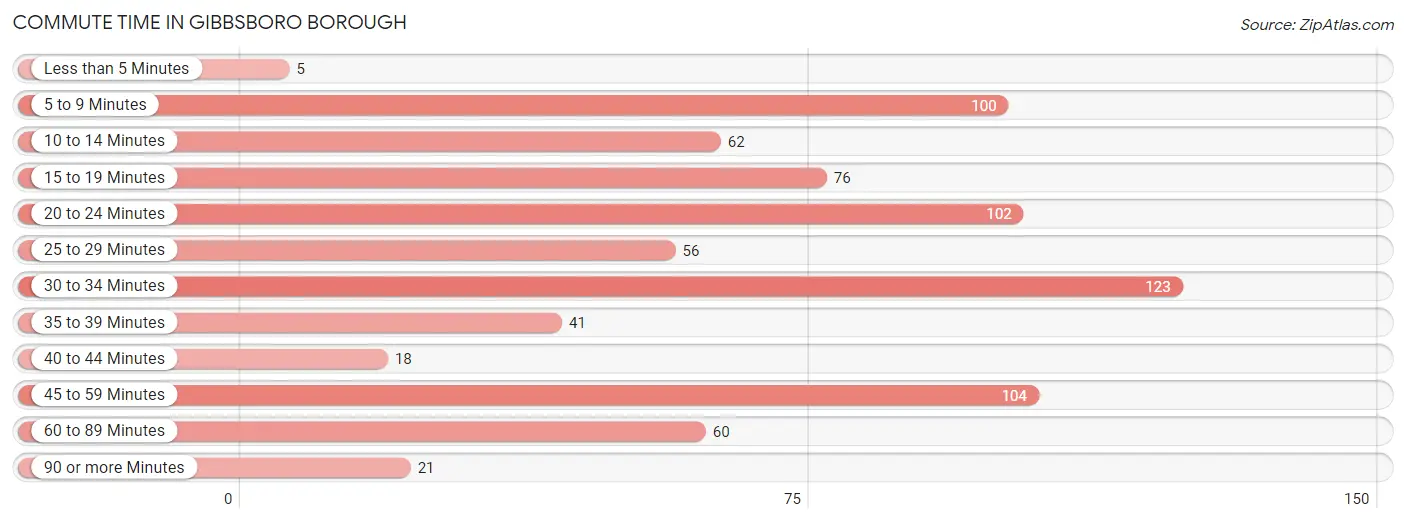
| Commute Time | # Commuters | % Commuters |
| Less than 5 Minutes | 5 | 0.6% |
| 5 to 9 Minutes | 100 | 13.0% |
| 10 to 14 Minutes | 62 | 8.1% |
| 15 to 19 Minutes | 76 | 9.9% |
| 20 to 24 Minutes | 102 | 13.3% |
| 25 to 29 Minutes | 56 | 7.3% |
| 30 to 34 Minutes | 123 | 16.0% |
| 35 to 39 Minutes | 41 | 5.3% |
| 40 to 44 Minutes | 18 | 2.3% |
| 45 to 59 Minutes | 104 | 13.5% |
| 60 to 89 Minutes | 60 | 7.8% |
| 90 or more Minutes | 21 | 2.7% |
Commute Time by Sex in Gibbsboro borough
The most common commute times in Gibbsboro borough are 30 to 34 minutes (81 commuters, 20.3%) for males and 5 to 9 minutes (77 commuters, 20.8%) for females.
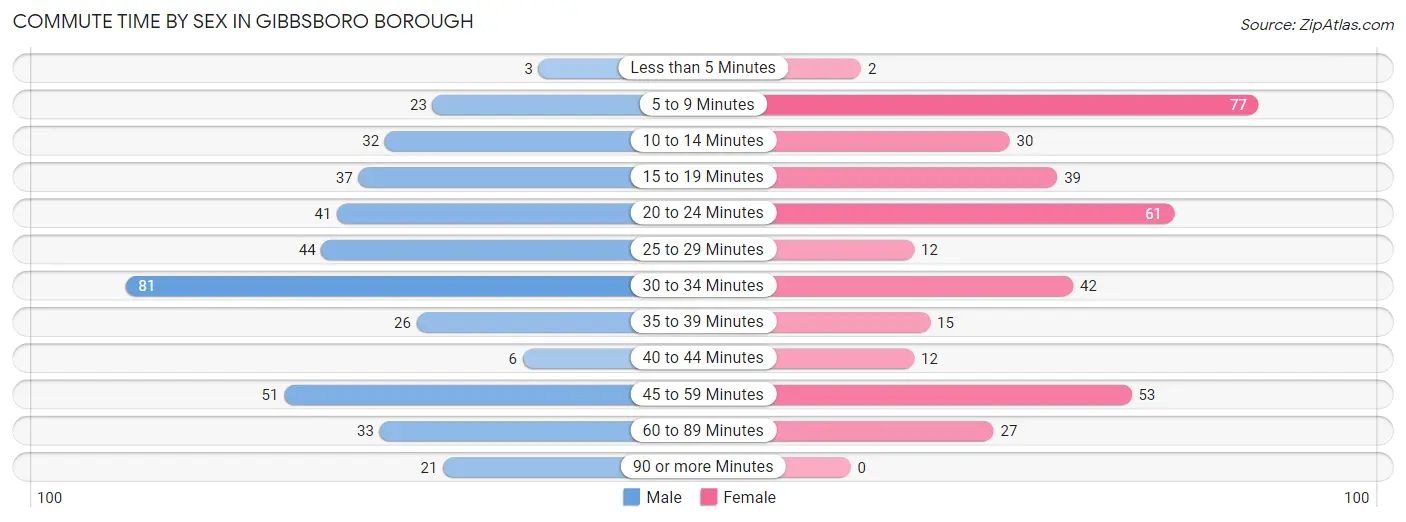
| Commute Time | Male | Female |
| Less than 5 Minutes | 3 (0.7%) | 2 (0.5%) |
| 5 to 9 Minutes | 23 (5.8%) | 77 (20.8%) |
| 10 to 14 Minutes | 32 (8.0%) | 30 (8.1%) |
| 15 to 19 Minutes | 37 (9.3%) | 39 (10.5%) |
| 20 to 24 Minutes | 41 (10.3%) | 61 (16.5%) |
| 25 to 29 Minutes | 44 (11.1%) | 12 (3.2%) |
| 30 to 34 Minutes | 81 (20.3%) | 42 (11.4%) |
| 35 to 39 Minutes | 26 (6.5%) | 15 (4.1%) |
| 40 to 44 Minutes | 6 (1.5%) | 12 (3.2%) |
| 45 to 59 Minutes | 51 (12.8%) | 53 (14.3%) |
| 60 to 89 Minutes | 33 (8.3%) | 27 (7.3%) |
| 90 or more Minutes | 21 (5.3%) | 0 (0.0%) |
Time of Departure to Work by Sex in Gibbsboro borough
The most frequent times of departure to work in Gibbsboro borough are 6:00 AM to 6:29 AM (80, 20.1%) for males and 7:00 AM to 7:29 AM (52, 14.1%) for females.
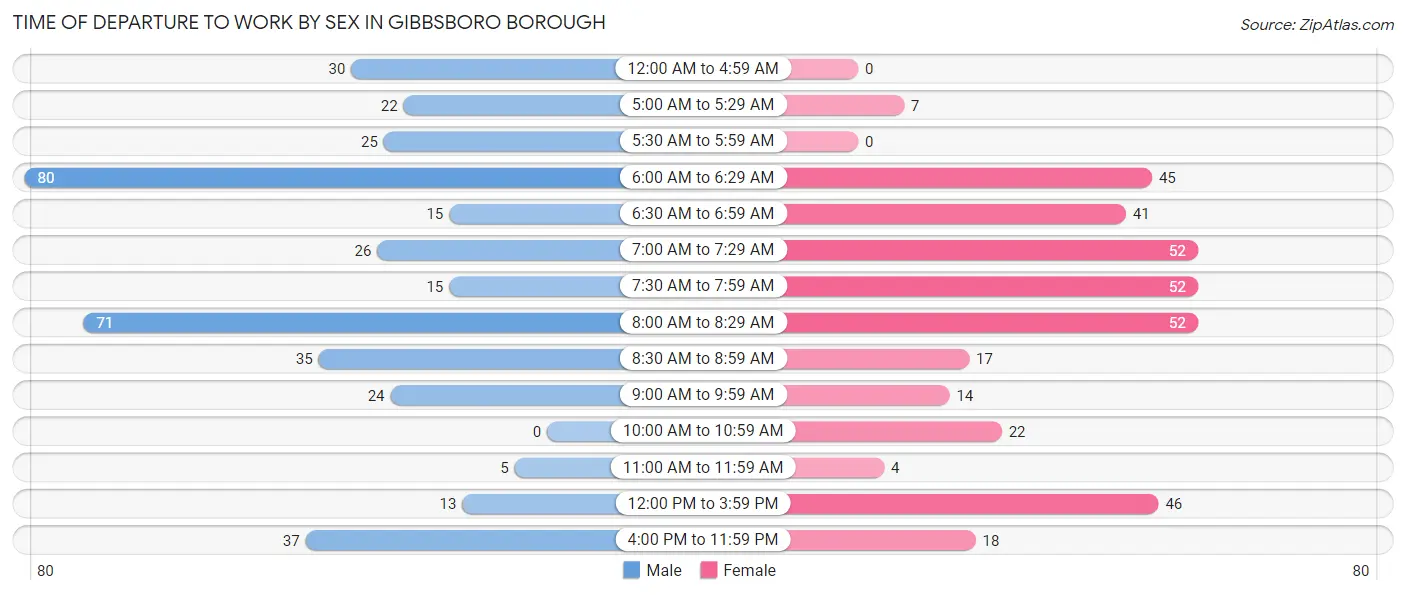
| Time of Departure | Male | Female |
| 12:00 AM to 4:59 AM | 30 (7.5%) | 0 (0.0%) |
| 5:00 AM to 5:29 AM | 22 (5.5%) | 7 (1.9%) |
| 5:30 AM to 5:59 AM | 25 (6.3%) | 0 (0.0%) |
| 6:00 AM to 6:29 AM | 80 (20.1%) | 45 (12.2%) |
| 6:30 AM to 6:59 AM | 15 (3.8%) | 41 (11.1%) |
| 7:00 AM to 7:29 AM | 26 (6.5%) | 52 (14.1%) |
| 7:30 AM to 7:59 AM | 15 (3.8%) | 52 (14.1%) |
| 8:00 AM to 8:29 AM | 71 (17.8%) | 52 (14.1%) |
| 8:30 AM to 8:59 AM | 35 (8.8%) | 17 (4.6%) |
| 9:00 AM to 9:59 AM | 24 (6.0%) | 14 (3.8%) |
| 10:00 AM to 10:59 AM | 0 (0.0%) | 22 (5.9%) |
| 11:00 AM to 11:59 AM | 5 (1.3%) | 4 (1.1%) |
| 12:00 PM to 3:59 PM | 13 (3.3%) | 46 (12.4%) |
| 4:00 PM to 11:59 PM | 37 (9.3%) | 18 (4.9%) |
| Total | 398 (100.0%) | 370 (100.0%) |
Housing Occupancy in Gibbsboro borough
Occupancy by Ownership in Gibbsboro borough
Of the total 782 dwellings in Gibbsboro borough, owner-occupied units account for 711 (90.9%), while renter-occupied units make up 71 (9.1%).
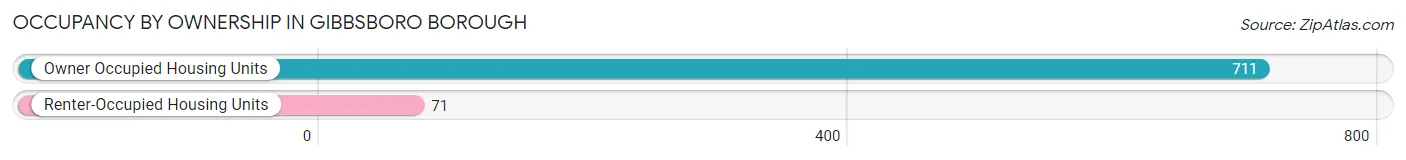
| Occupancy | # Housing Units | % Housing Units |
| Owner Occupied Housing Units | 711 | 90.9% |
| Renter-Occupied Housing Units | 71 | 9.1% |
| Total Occupied Housing Units | 782 | 100.0% |
Occupancy by Household Size in Gibbsboro borough
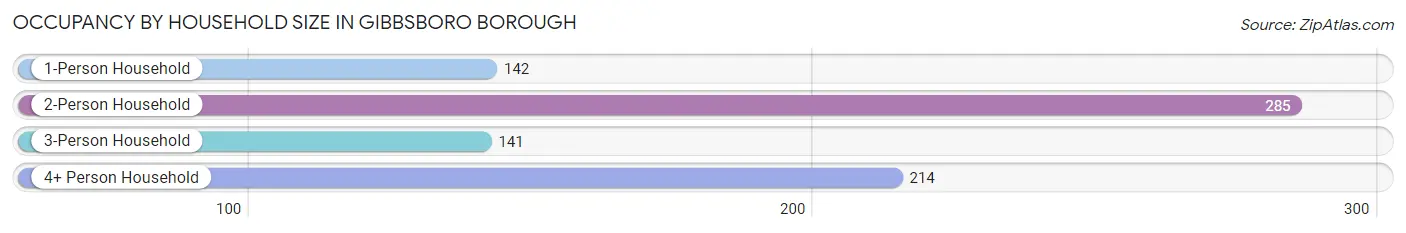
| Household Size | # Housing Units | % Housing Units |
| 1-Person Household | 142 | 18.2% |
| 2-Person Household | 285 | 36.4% |
| 3-Person Household | 141 | 18.0% |
| 4+ Person Household | 214 | 27.4% |
| Total Housing Units | 782 | 100.0% |
Occupancy by Ownership by Household Size in Gibbsboro borough
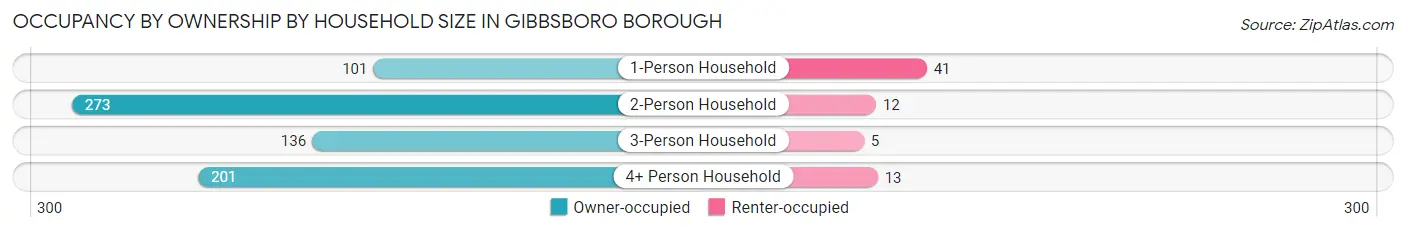
| Household Size | Owner-occupied | Renter-occupied |
| 1-Person Household | 101 (71.1%) | 41 (28.9%) |
| 2-Person Household | 273 (95.8%) | 12 (4.2%) |
| 3-Person Household | 136 (96.5%) | 5 (3.5%) |
| 4+ Person Household | 201 (93.9%) | 13 (6.1%) |
| Total Housing Units | 711 (90.9%) | 71 (9.1%) |
Occupancy by Educational Attainment in Gibbsboro borough
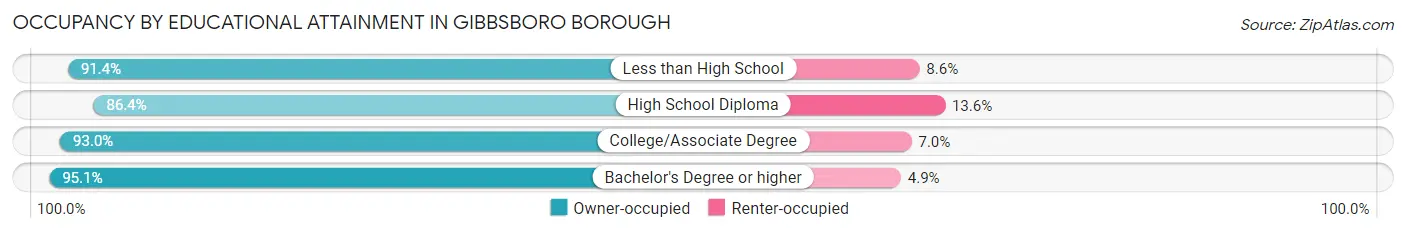
| Household Size | Owner-occupied | Renter-occupied |
| Less than High School | 32 (91.4%) | 3 (8.6%) |
| High School Diploma | 266 (86.4%) | 42 (13.6%) |
| College/Associate Degree | 199 (93.0%) | 15 (7.0%) |
| Bachelor's Degree or higher | 214 (95.1%) | 11 (4.9%) |
Occupancy by Age of Householder in Gibbsboro borough
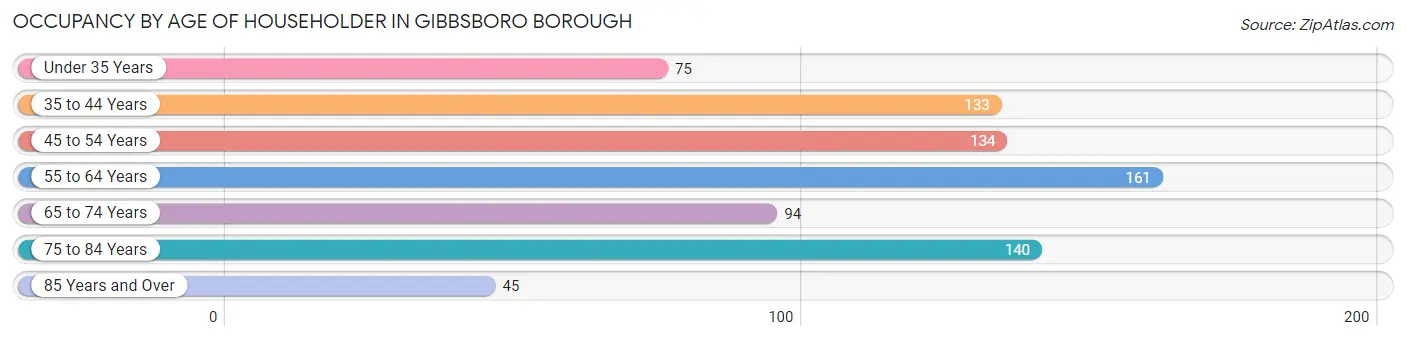
| Age Bracket | # Households | % Households |
| Under 35 Years | 75 | 9.6% |
| 35 to 44 Years | 133 | 17.0% |
| 45 to 54 Years | 134 | 17.1% |
| 55 to 64 Years | 161 | 20.6% |
| 65 to 74 Years | 94 | 12.0% |
| 75 to 84 Years | 140 | 17.9% |
| 85 Years and Over | 45 | 5.8% |
| Total | 782 | 100.0% |
Housing Finances in Gibbsboro borough
Median Income by Occupancy in Gibbsboro borough
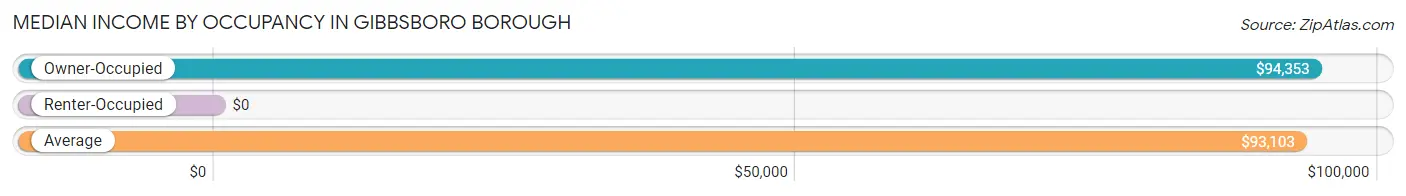
| Occupancy Type | # Households | Median Income |
| Owner-Occupied | 711 (90.9%) | $94,353 |
| Renter-Occupied | 71 (9.1%) | $0 |
| Average | 782 (100.0%) | $93,103 |
Occupancy by Householder Income Bracket in Gibbsboro borough
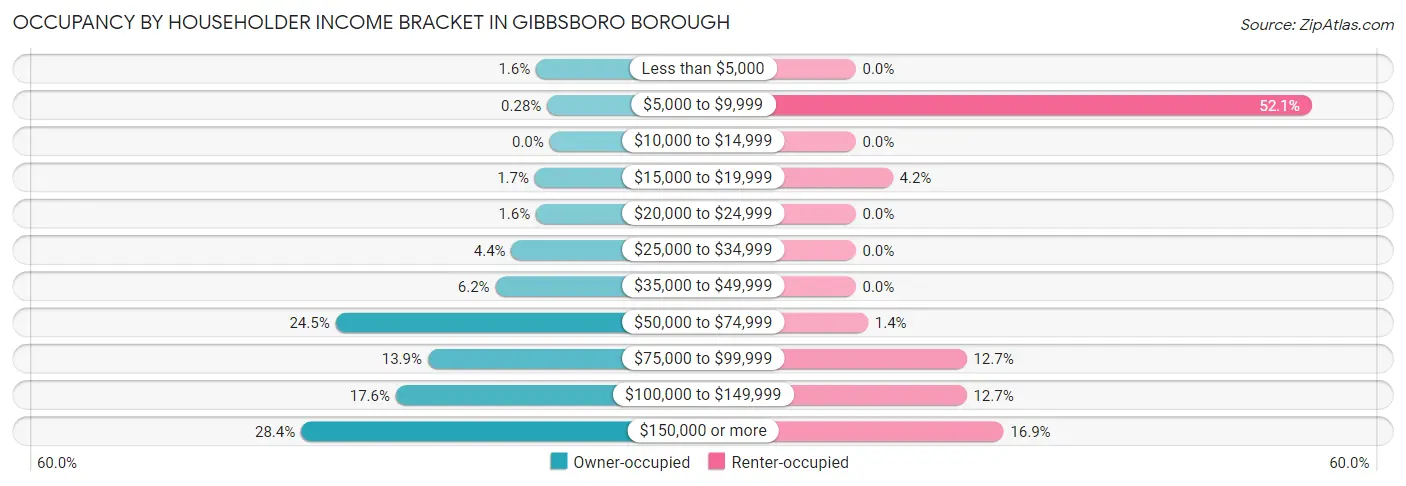
| Income Bracket | Owner-occupied | Renter-occupied |
| Less than $5,000 | 11 (1.5%) | 0 (0.0%) |
| $5,000 to $9,999 | 2 (0.3%) | 37 (52.1%) |
| $10,000 to $14,999 | 0 (0.0%) | 0 (0.0%) |
| $15,000 to $19,999 | 12 (1.7%) | 3 (4.2%) |
| $20,000 to $24,999 | 11 (1.5%) | 0 (0.0%) |
| $25,000 to $34,999 | 31 (4.4%) | 0 (0.0%) |
| $35,000 to $49,999 | 44 (6.2%) | 0 (0.0%) |
| $50,000 to $74,999 | 174 (24.5%) | 1 (1.4%) |
| $75,000 to $99,999 | 99 (13.9%) | 9 (12.7%) |
| $100,000 to $149,999 | 125 (17.6%) | 9 (12.7%) |
| $150,000 or more | 202 (28.4%) | 12 (16.9%) |
| Total | 711 (100.0%) | 71 (100.0%) |
Monthly Housing Cost Tiers in Gibbsboro borough
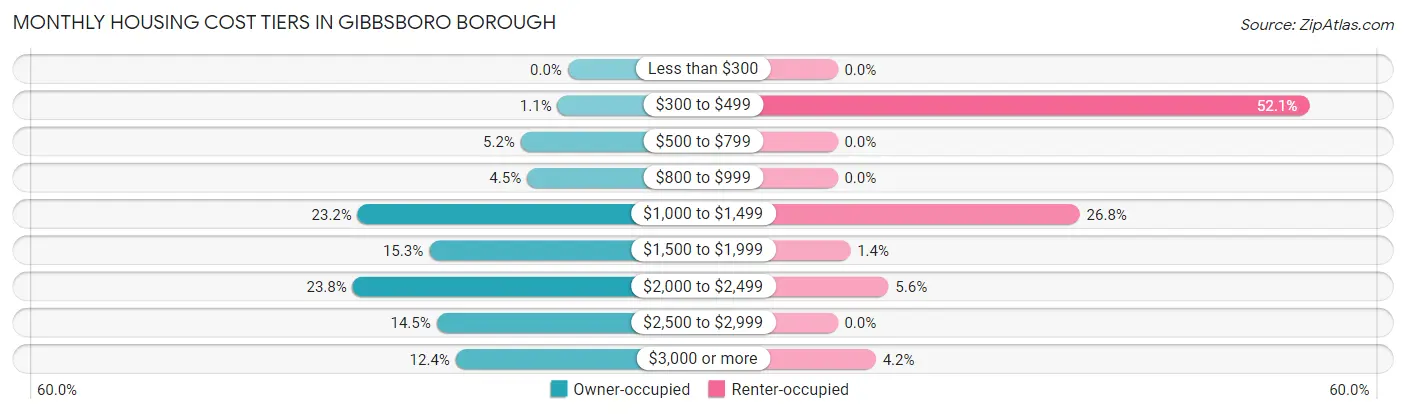
| Monthly Cost | Owner-occupied | Renter-occupied |
| Less than $300 | 0 (0.0%) | 0 (0.0%) |
| $300 to $499 | 8 (1.1%) | 37 (52.1%) |
| $500 to $799 | 37 (5.2%) | 0 (0.0%) |
| $800 to $999 | 32 (4.5%) | 0 (0.0%) |
| $1,000 to $1,499 | 165 (23.2%) | 19 (26.8%) |
| $1,500 to $1,999 | 109 (15.3%) | 1 (1.4%) |
| $2,000 to $2,499 | 169 (23.8%) | 4 (5.6%) |
| $2,500 to $2,999 | 103 (14.5%) | 0 (0.0%) |
| $3,000 or more | 88 (12.4%) | 3 (4.2%) |
| Total | 711 (100.0%) | 71 (100.0%) |
Physical Housing Characteristics in Gibbsboro borough
Housing Structures in Gibbsboro borough
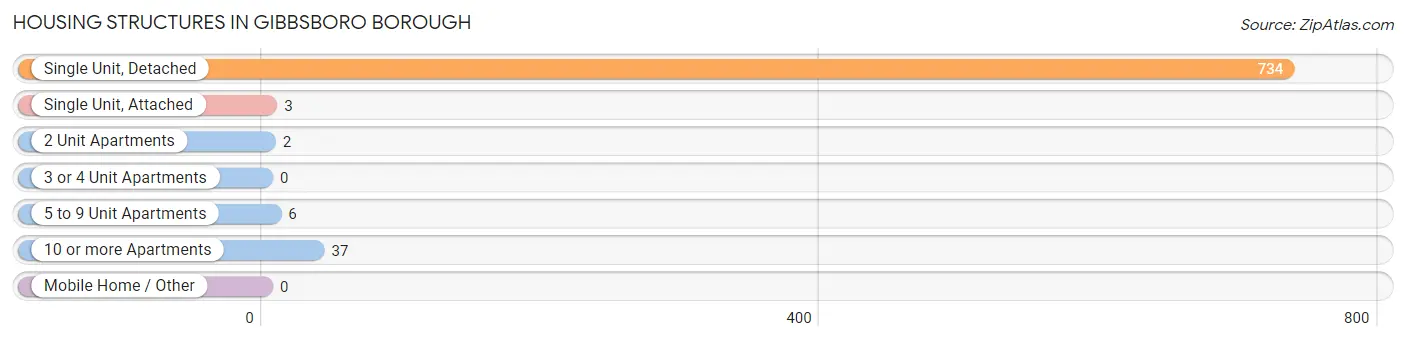
| Structure Type | # Housing Units | % Housing Units |
| Single Unit, Detached | 734 | 93.9% |
| Single Unit, Attached | 3 | 0.4% |
| 2 Unit Apartments | 2 | 0.3% |
| 3 or 4 Unit Apartments | 0 | 0.0% |
| 5 to 9 Unit Apartments | 6 | 0.8% |
| 10 or more Apartments | 37 | 4.7% |
| Mobile Home / Other | 0 | 0.0% |
| Total | 782 | 100.0% |
Housing Structures by Occupancy in Gibbsboro borough
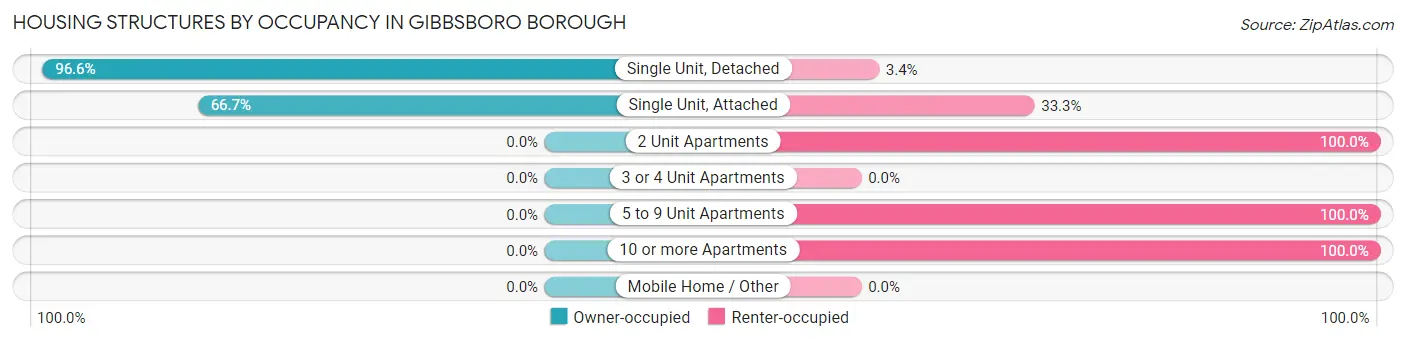
| Structure Type | Owner-occupied | Renter-occupied |
| Single Unit, Detached | 709 (96.6%) | 25 (3.4%) |
| Single Unit, Attached | 2 (66.7%) | 1 (33.3%) |
| 2 Unit Apartments | 0 (0.0%) | 2 (100.0%) |
| 3 or 4 Unit Apartments | 0 (0.0%) | 0 (0.0%) |
| 5 to 9 Unit Apartments | 0 (0.0%) | 6 (100.0%) |
| 10 or more Apartments | 0 (0.0%) | 37 (100.0%) |
| Mobile Home / Other | 0 (0.0%) | 0 (0.0%) |
| Total | 711 (90.9%) | 71 (9.1%) |
Housing Structures by Number of Rooms in Gibbsboro borough
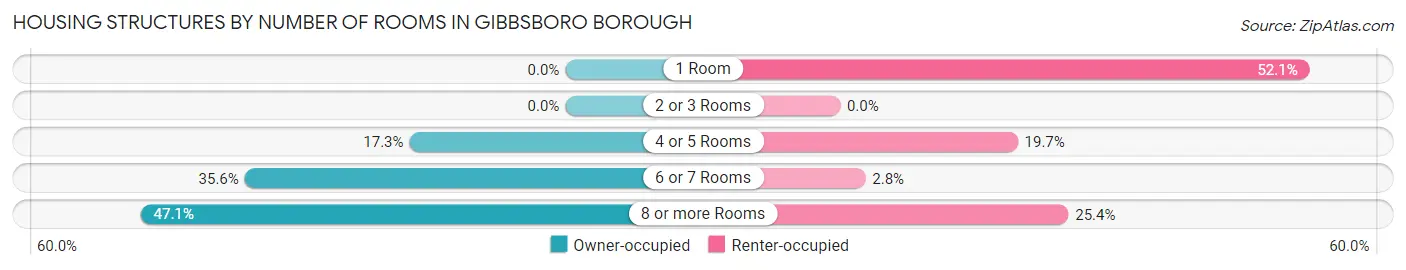
| Number of Rooms | Owner-occupied | Renter-occupied |
| 1 Room | 0 (0.0%) | 37 (52.1%) |
| 2 or 3 Rooms | 0 (0.0%) | 0 (0.0%) |
| 4 or 5 Rooms | 123 (17.3%) | 14 (19.7%) |
| 6 or 7 Rooms | 253 (35.6%) | 2 (2.8%) |
| 8 or more Rooms | 335 (47.1%) | 18 (25.4%) |
| Total | 711 (100.0%) | 71 (100.0%) |
Housing Structure by Heating Type in Gibbsboro borough
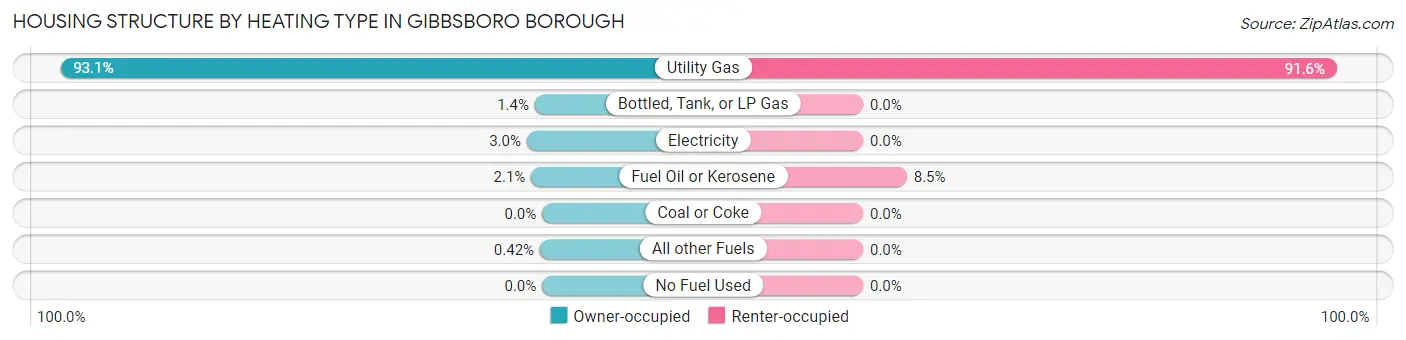
| Heating Type | Owner-occupied | Renter-occupied |
| Utility Gas | 662 (93.1%) | 65 (91.5%) |
| Bottled, Tank, or LP Gas | 10 (1.4%) | 0 (0.0%) |
| Electricity | 21 (2.9%) | 0 (0.0%) |
| Fuel Oil or Kerosene | 15 (2.1%) | 6 (8.5%) |
| Coal or Coke | 0 (0.0%) | 0 (0.0%) |
| All other Fuels | 3 (0.4%) | 0 (0.0%) |
| No Fuel Used | 0 (0.0%) | 0 (0.0%) |
| Total | 711 (100.0%) | 71 (100.0%) |
Household Vehicle Usage in Gibbsboro borough
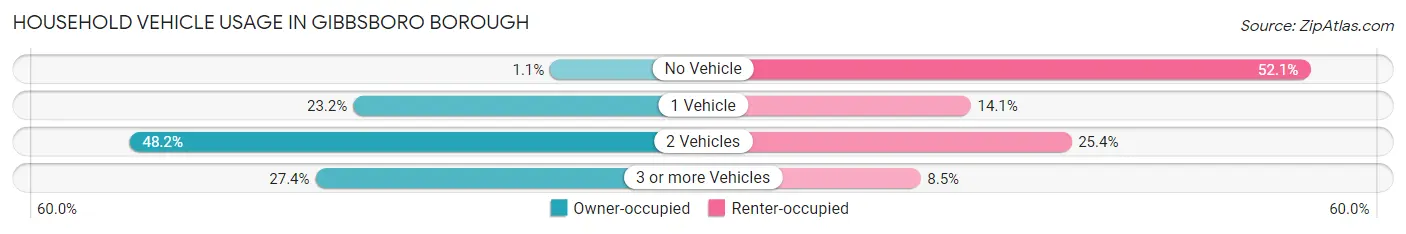
| Vehicles per Household | Owner-occupied | Renter-occupied |
| No Vehicle | 8 (1.1%) | 37 (52.1%) |
| 1 Vehicle | 165 (23.2%) | 10 (14.1%) |
| 2 Vehicles | 343 (48.2%) | 18 (25.4%) |
| 3 or more Vehicles | 195 (27.4%) | 6 (8.5%) |
| Total | 711 (100.0%) | 71 (100.0%) |
Real Estate & Mortgages in Gibbsboro borough
Real Estate and Mortgage Overview in Gibbsboro borough
| Characteristic | Without Mortgage | With Mortgage |
| Housing Units | 239 | 472 |
| Median Property Value | $262,300 | $266,300 |
| Median Household Income | $75,268 | $159 |
| Monthly Housing Costs | $1,097 | $88 |
| Real Estate Taxes | $8,106 | $4 |
Property Value by Mortgage Status in Gibbsboro borough
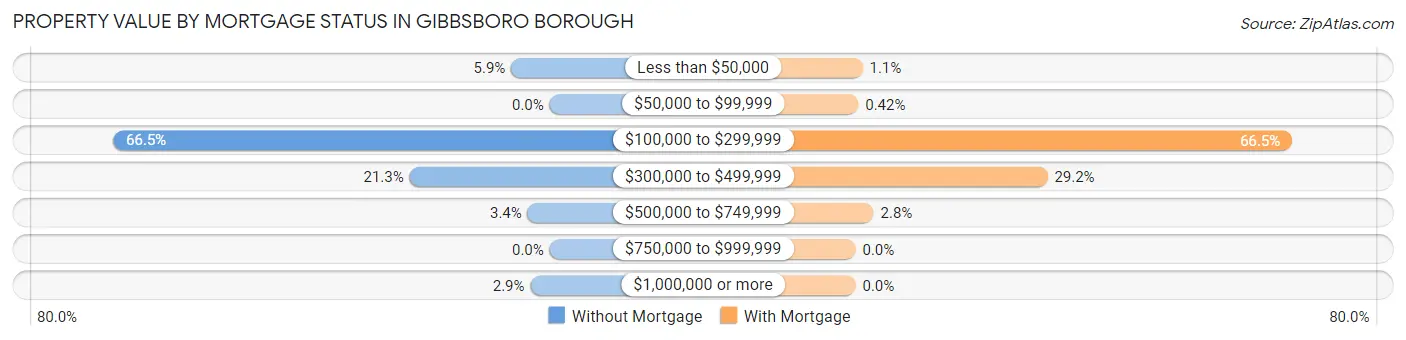
| Property Value | Without Mortgage | With Mortgage |
| Less than $50,000 | 14 (5.9%) | 5 (1.1%) |
| $50,000 to $99,999 | 0 (0.0%) | 2 (0.4%) |
| $100,000 to $299,999 | 159 (66.5%) | 314 (66.5%) |
| $300,000 to $499,999 | 51 (21.3%) | 138 (29.2%) |
| $500,000 to $749,999 | 8 (3.4%) | 13 (2.8%) |
| $750,000 to $999,999 | 0 (0.0%) | 0 (0.0%) |
| $1,000,000 or more | 7 (2.9%) | 0 (0.0%) |
| Total | 239 (100.0%) | 472 (100.0%) |
Household Income by Mortgage Status in Gibbsboro borough
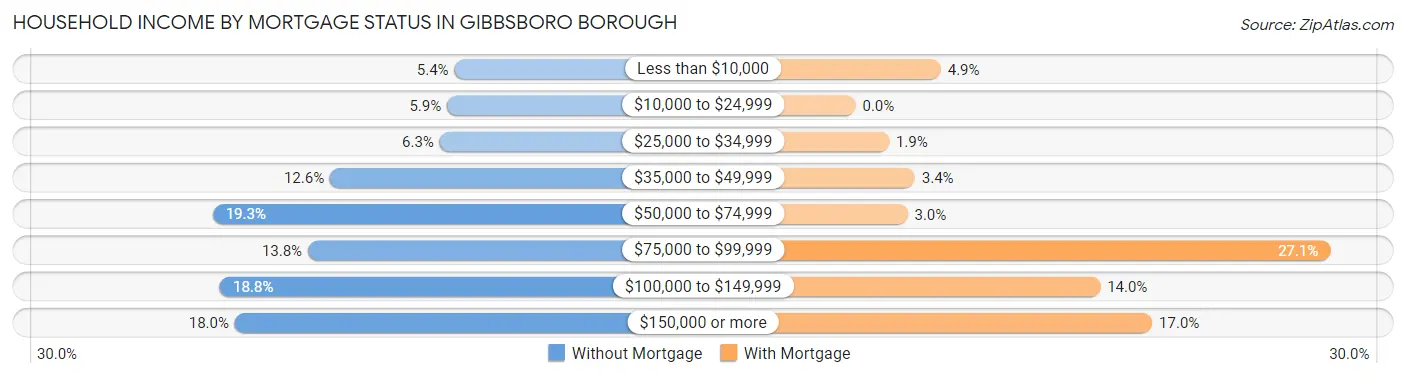
| Household Income | Without Mortgage | With Mortgage |
| Less than $10,000 | 13 (5.4%) | 23 (4.9%) |
| $10,000 to $24,999 | 14 (5.9%) | 0 (0.0%) |
| $25,000 to $34,999 | 15 (6.3%) | 9 (1.9%) |
| $35,000 to $49,999 | 30 (12.6%) | 16 (3.4%) |
| $50,000 to $74,999 | 46 (19.3%) | 14 (3.0%) |
| $75,000 to $99,999 | 33 (13.8%) | 128 (27.1%) |
| $100,000 to $149,999 | 45 (18.8%) | 66 (14.0%) |
| $150,000 or more | 43 (18.0%) | 80 (17.0%) |
| Total | 239 (100.0%) | 472 (100.0%) |
Property Value to Household Income Ratio in Gibbsboro borough
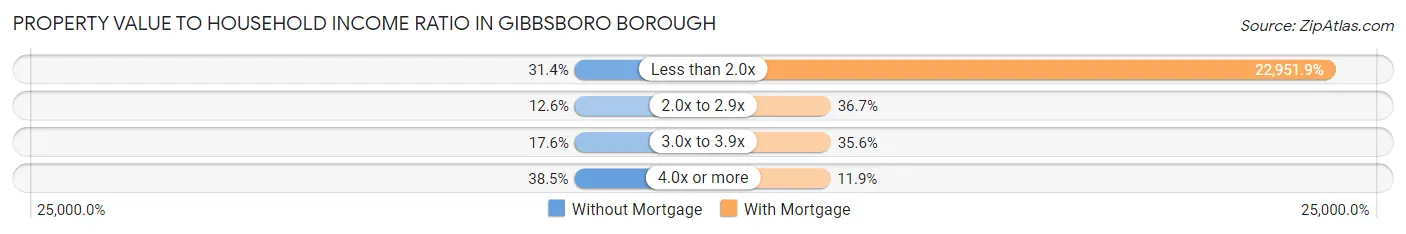
| Value-to-Income Ratio | Without Mortgage | With Mortgage |
| Less than 2.0x | 75 (31.4%) | 108,333 (22,951.9%) |
| 2.0x to 2.9x | 30 (12.6%) | 173 (36.6%) |
| 3.0x to 3.9x | 42 (17.6%) | 168 (35.6%) |
| 4.0x or more | 92 (38.5%) | 56 (11.9%) |
| Total | 239 (100.0%) | 472 (100.0%) |
Real Estate Taxes by Mortgage Status in Gibbsboro borough
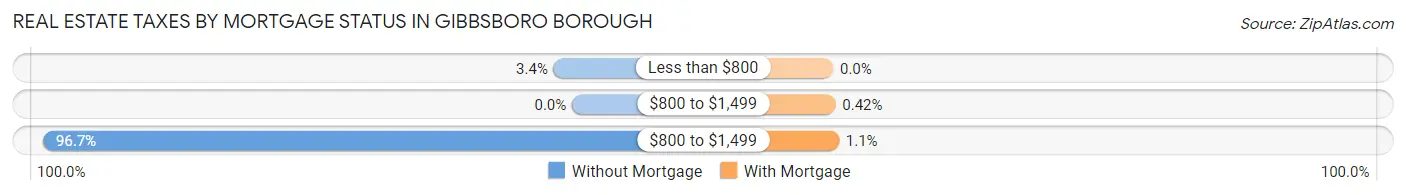
| Property Taxes | Without Mortgage | With Mortgage |
| Less than $800 | 8 (3.4%) | 0 (0.0%) |
| $800 to $1,499 | 0 (0.0%) | 2 (0.4%) |
| $800 to $1,499 | 231 (96.7%) | 5 (1.1%) |
| Total | 239 (100.0%) | 472 (100.0%) |
Health & Disability in Gibbsboro borough
Health Insurance Coverage by Age in Gibbsboro borough
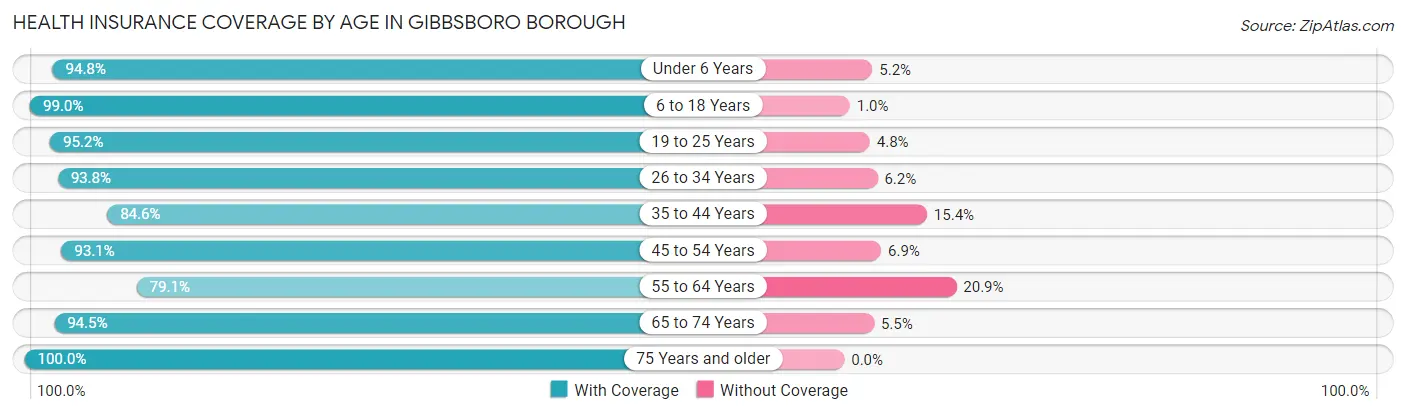
| Age Bracket | With Coverage | Without Coverage |
| Under 6 Years | 163 (94.8%) | 9 (5.2%) |
| 6 to 18 Years | 389 (99.0%) | 4 (1.0%) |
| 19 to 25 Years | 140 (95.2%) | 7 (4.8%) |
| 26 to 34 Years | 167 (93.8%) | 11 (6.2%) |
| 35 to 44 Years | 247 (84.6%) | 45 (15.4%) |
| 45 to 54 Years | 258 (93.1%) | 19 (6.9%) |
| 55 to 64 Years | 265 (79.1%) | 70 (20.9%) |
| 65 to 74 Years | 205 (94.5%) | 12 (5.5%) |
| 75 Years and older | 253 (100.0%) | 0 (0.0%) |
| Total | 2,087 (92.2%) | 177 (7.8%) |
Health Insurance Coverage by Citizenship Status in Gibbsboro borough
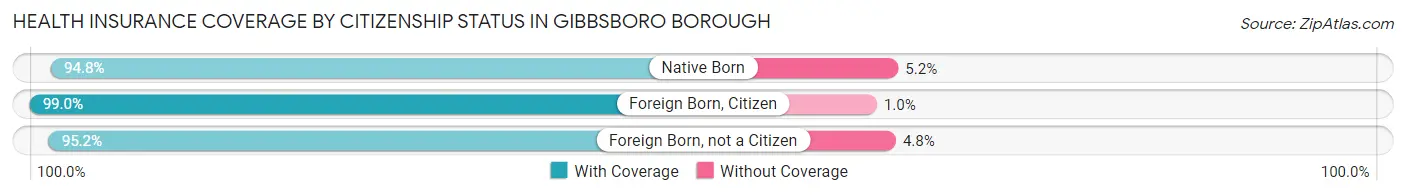
| Citizenship Status | With Coverage | Without Coverage |
| Native Born | 163 (94.8%) | 9 (5.2%) |
| Foreign Born, Citizen | 389 (99.0%) | 4 (1.0%) |
| Foreign Born, not a Citizen | 140 (95.2%) | 7 (4.8%) |
Health Insurance Coverage by Household Income in Gibbsboro borough
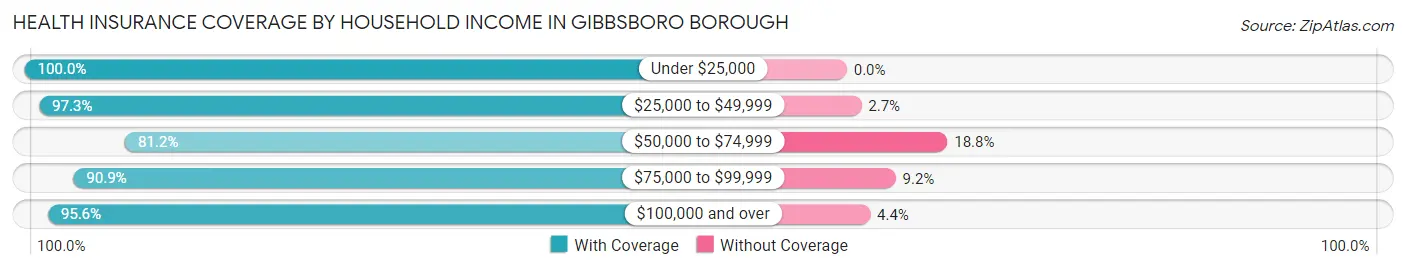
| Household Income | With Coverage | Without Coverage |
| Under $25,000 | 95 (100.0%) | 0 (0.0%) |
| $25,000 to $49,999 | 143 (97.3%) | 4 (2.7%) |
| $50,000 to $74,999 | 401 (81.2%) | 93 (18.8%) |
| $75,000 to $99,999 | 258 (90.8%) | 26 (9.1%) |
| $100,000 and over | 1,185 (95.6%) | 54 (4.4%) |
Public vs Private Health Insurance Coverage by Age in Gibbsboro borough
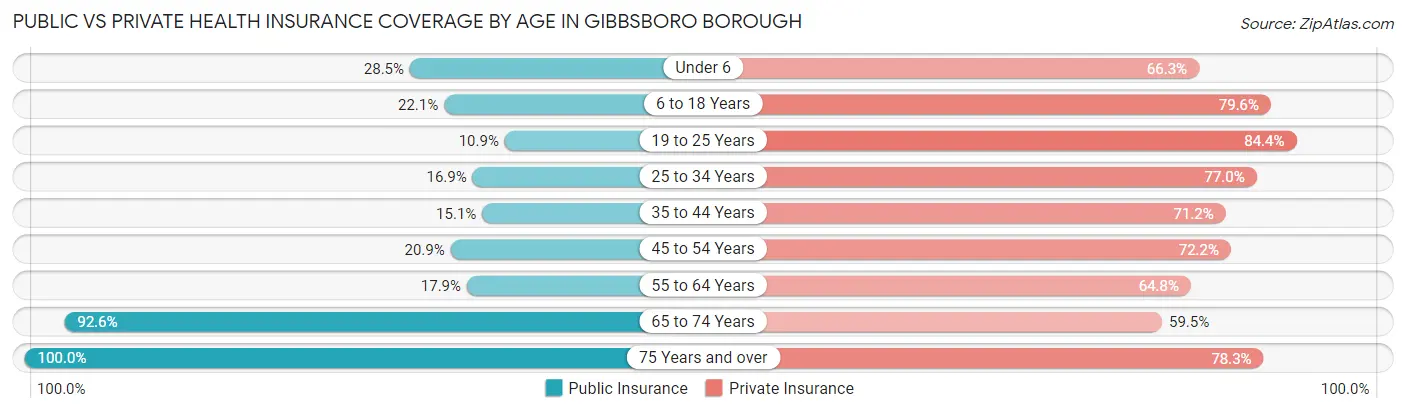
| Age Bracket | Public Insurance | Private Insurance |
| Under 6 | 49 (28.5%) | 114 (66.3%) |
| 6 to 18 Years | 87 (22.1%) | 313 (79.6%) |
| 19 to 25 Years | 16 (10.9%) | 124 (84.4%) |
| 25 to 34 Years | 30 (16.9%) | 137 (77.0%) |
| 35 to 44 Years | 44 (15.1%) | 208 (71.2%) |
| 45 to 54 Years | 58 (20.9%) | 200 (72.2%) |
| 55 to 64 Years | 60 (17.9%) | 217 (64.8%) |
| 65 to 74 Years | 201 (92.6%) | 129 (59.5%) |
| 75 Years and over | 253 (100.0%) | 198 (78.3%) |
| Total | 798 (35.2%) | 1,640 (72.4%) |
Disability Status by Sex by Age in Gibbsboro borough
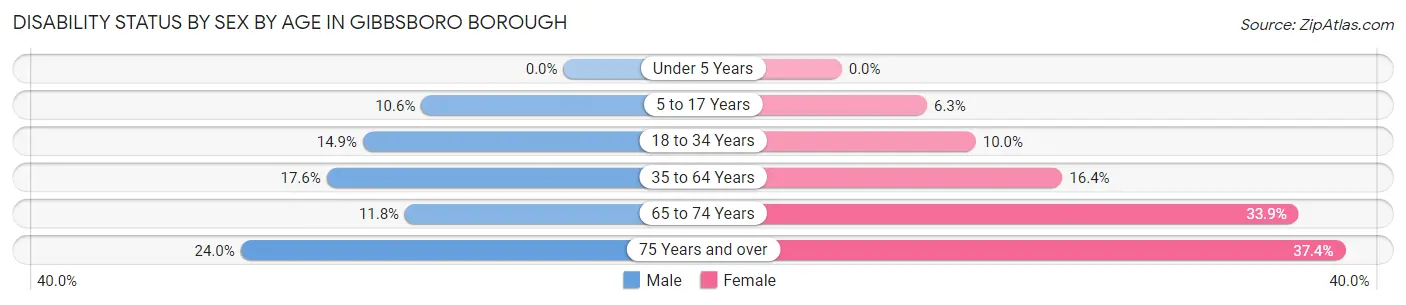
| Age Bracket | Male | Female |
| Under 5 Years | 0 (0.0%) | 0 (0.0%) |
| 5 to 17 Years | 21 (10.5%) | 14 (6.3%) |
| 18 to 34 Years | 21 (14.9%) | 20 (10.0%) |
| 35 to 64 Years | 87 (17.6%) | 67 (16.4%) |
| 65 to 74 Years | 12 (11.8%) | 39 (33.9%) |
| 75 Years and over | 35 (24.0%) | 40 (37.4%) |
Disability Class by Sex by Age in Gibbsboro borough
Disability Class: Hearing Difficulty
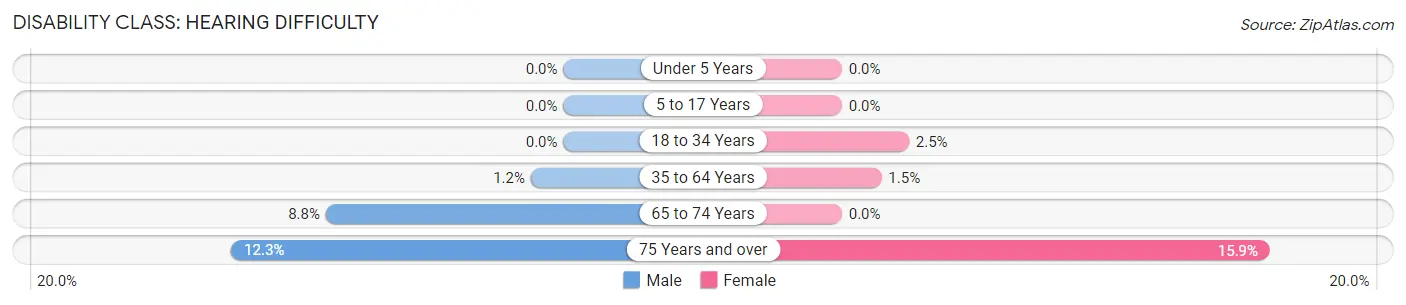
| Age Bracket | Male | Female |
| Under 5 Years | 0 (0.0%) | 0 (0.0%) |
| 5 to 17 Years | 0 (0.0%) | 0 (0.0%) |
| 18 to 34 Years | 0 (0.0%) | 5 (2.5%) |
| 35 to 64 Years | 6 (1.2%) | 6 (1.5%) |
| 65 to 74 Years | 9 (8.8%) | 0 (0.0%) |
| 75 Years and over | 18 (12.3%) | 17 (15.9%) |
Disability Class: Vision Difficulty
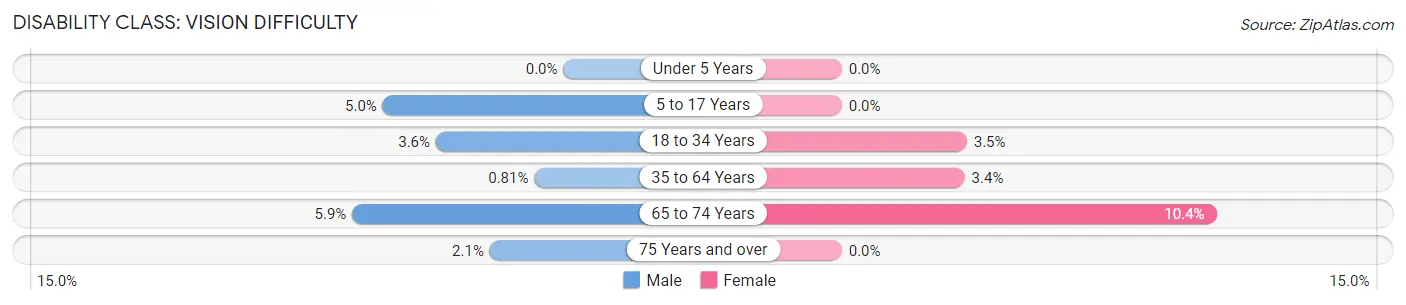
| Age Bracket | Male | Female |
| Under 5 Years | 0 (0.0%) | 0 (0.0%) |
| 5 to 17 Years | 10 (5.0%) | 0 (0.0%) |
| 18 to 34 Years | 5 (3.5%) | 7 (3.5%) |
| 35 to 64 Years | 4 (0.8%) | 14 (3.4%) |
| 65 to 74 Years | 6 (5.9%) | 12 (10.4%) |
| 75 Years and over | 3 (2.1%) | 0 (0.0%) |
Disability Class: Cognitive Difficulty
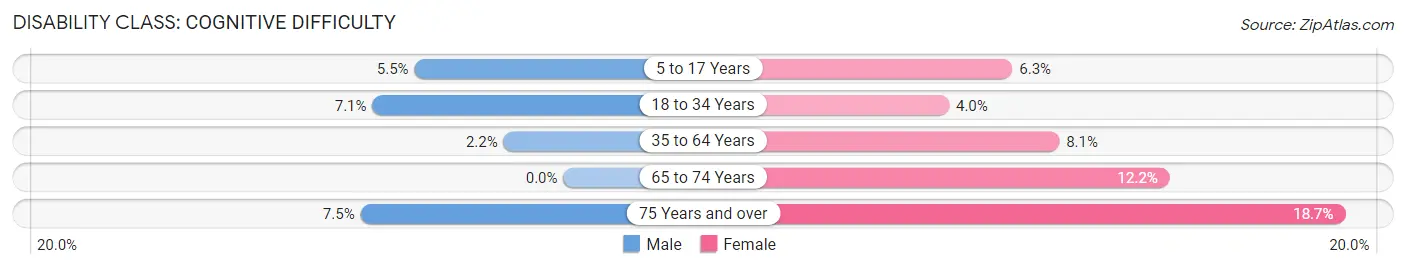
| Age Bracket | Male | Female |
| 5 to 17 Years | 11 (5.5%) | 14 (6.3%) |
| 18 to 34 Years | 10 (7.1%) | 8 (4.0%) |
| 35 to 64 Years | 11 (2.2%) | 33 (8.1%) |
| 65 to 74 Years | 0 (0.0%) | 14 (12.2%) |
| 75 Years and over | 11 (7.5%) | 20 (18.7%) |
Disability Class: Ambulatory Difficulty
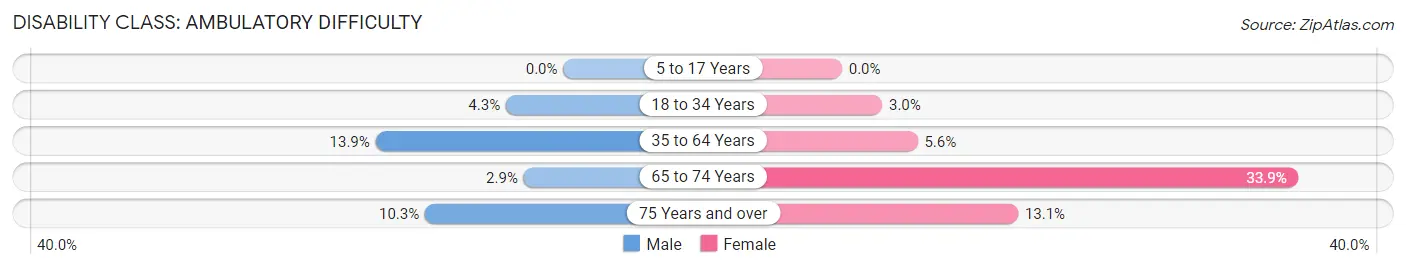
| Age Bracket | Male | Female |
| 5 to 17 Years | 0 (0.0%) | 0 (0.0%) |
| 18 to 34 Years | 6 (4.3%) | 6 (3.0%) |
| 35 to 64 Years | 69 (13.9%) | 23 (5.6%) |
| 65 to 74 Years | 3 (2.9%) | 39 (33.9%) |
| 75 Years and over | 15 (10.3%) | 14 (13.1%) |
Disability Class: Self-Care Difficulty
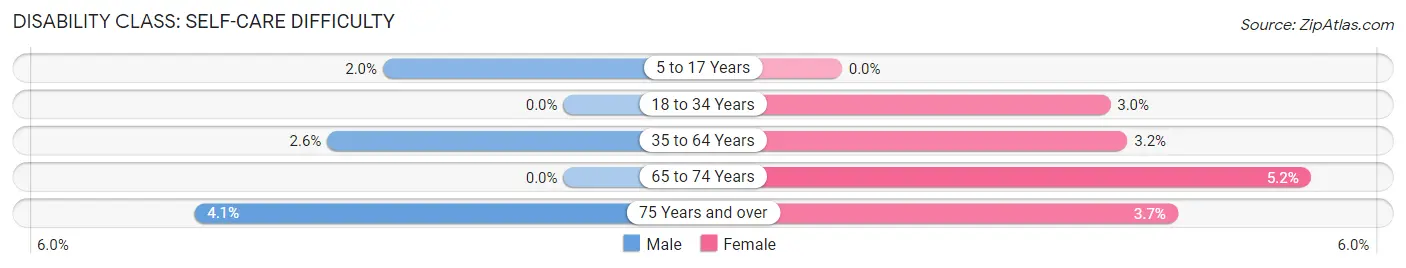
| Age Bracket | Male | Female |
| 5 to 17 Years | 4 (2.0%) | 0 (0.0%) |
| 18 to 34 Years | 0 (0.0%) | 6 (3.0%) |
| 35 to 64 Years | 13 (2.6%) | 13 (3.2%) |
| 65 to 74 Years | 0 (0.0%) | 6 (5.2%) |
| 75 Years and over | 6 (4.1%) | 4 (3.7%) |
Technology Access in Gibbsboro borough
Computing Device Access in Gibbsboro borough
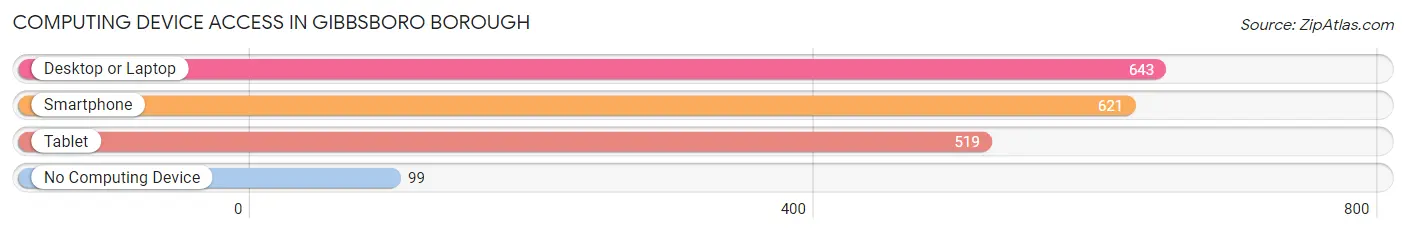
| Device Type | # Households | % Households |
| Desktop or Laptop | 643 | 82.2% |
| Smartphone | 621 | 79.4% |
| Tablet | 519 | 66.4% |
| No Computing Device | 99 | 12.7% |
| Total | 782 | 100.0% |
Internet Access in Gibbsboro borough
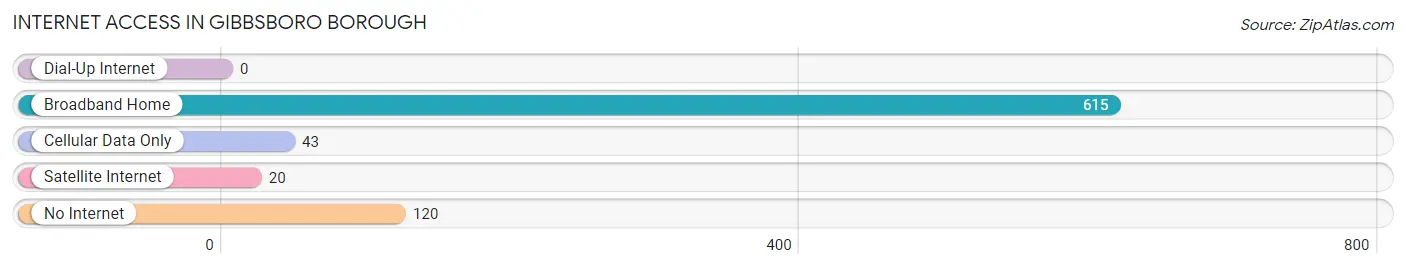
| Internet Type | # Households | % Households |
| Dial-Up Internet | 0 | 0.0% |
| Broadband Home | 615 | 78.6% |
| Cellular Data Only | 43 | 5.5% |
| Satellite Internet | 20 | 2.6% |
| No Internet | 120 | 15.3% |
| Total | 782 | 100.0% |
Gibbsboro borough Summary
Gibbsboro Borough is a small borough located in Camden County, New Jersey. It is situated in the eastern part of the county, just south of the city of Camden. The borough was incorporated in 1891 and is home to a population of approximately 3,000 people.
Geography
Gibbsboro Borough is located in the eastern part of Camden County, New Jersey. It is situated just south of the city of Camden and is bordered by Voorhees Township to the north, Berlin Township to the east, and Clementon Borough to the south. The borough is approximately 2.5 square miles in size and is located at an elevation of approximately 50 feet above sea level. The borough is located in the Atlantic Coastal Plain region of New Jersey and is characterized by flat terrain and sandy soils. The borough is located in the Pine Barrens region of New Jersey and is home to a variety of plant and animal species.
History
Gibbsboro Borough was originally part of Gloucester Township, which was established in 1695. The area was first settled in the early 1700s by Quaker settlers from England. The area was known as Gibbsboro until 1891, when it was incorporated as a borough. The borough was named after John Gibbs, who was a prominent local landowner and businessman.
Gibbsboro Borough was a rural farming community until the 1950s, when the population began to grow rapidly due to the influx of people from Philadelphia and Camden. The borough experienced a period of rapid growth and development during this time, with the construction of new homes, businesses, and schools.
Economy
Gibbsboro Borough has a diverse economy that is largely based on the service industry. The borough is home to a variety of businesses, including retail stores, restaurants, and professional services. The borough is also home to a number of manufacturing companies, including a plastics manufacturer and a printing company.
The borough is also home to a number of government offices, including the Gibbsboro Borough Hall and the Gibbsboro Police Department. The borough is also home to a number of parks and recreational facilities, including the Gibbsboro Recreation Center and the Gibbsboro Nature Center.
Demographics
Gibbsboro Borough has a population of approximately 3,000 people. The population is largely white (90.2%), with a small percentage of African Americans (4.2%), Asians (2.2%), and Hispanics (2.2%). The median household income in the borough is $68,944, and the median home value is $232,400.
Conclusion
Gibbsboro Borough is a small borough located in Camden County, New Jersey. It is situated in the eastern part of the county, just south of the city of Camden. The borough was incorporated in 1891 and is home to a population of approximately 3,000 people. The borough has a diverse economy that is largely based on the service industry, and the population is largely white. Gibbsboro Borough is a great place to live, work, and play, and is a great example of a small, vibrant community.
Common Questions
What is Per Capita Income in Gibbsboro borough?
Per Capita income in Gibbsboro borough is $41,960.
What is the Median Family Income in Gibbsboro borough?
Median Family Income in Gibbsboro borough is $106,458.
What is the Median Household income in Gibbsboro borough?
Median Household Income in Gibbsboro borough is $93,103.
What is Income or Wage Gap in Gibbsboro borough?
Income or Wage Gap in Gibbsboro borough is 4.0%.
Women in Gibbsboro borough earn 96.0 cents for every dollar earned by a man.
What is Inequality or Gini Index in Gibbsboro borough?
Inequality or Gini Index in Gibbsboro borough is 0.41.
What is the Total Population of Gibbsboro borough?
Total Population of Gibbsboro borough is 2,278.
What is the Total Male Population of Gibbsboro borough?
Total Male Population of Gibbsboro borough is 1,166.
What is the Total Female Population of Gibbsboro borough?
Total Female Population of Gibbsboro borough is 1,112.
What is the Ratio of Males per 100 Females in Gibbsboro borough?
There are 104.86 Males per 100 Females in Gibbsboro borough.
What is the Ratio of Females per 100 Males in Gibbsboro borough?
There are 95.37 Females per 100 Males in Gibbsboro borough.
What is the Median Population Age in Gibbsboro borough?
Median Population Age in Gibbsboro borough is 41.3 Years.
What is the Average Family Size in Gibbsboro borough
Average Family Size in Gibbsboro borough is 3.4 People.
What is the Average Household Size in Gibbsboro borough
Average Household Size in Gibbsboro borough is 2.9 People.
How Large is the Labor Force in Gibbsboro borough?
There are 1,008 People in the Labor Forcein in Gibbsboro borough.
What is the Percentage of People in the Labor Force in Gibbsboro borough?
55.7% of People are in the Labor Force in Gibbsboro borough.
What is the Unemployment Rate in Gibbsboro borough?
Unemployment Rate in Gibbsboro borough is 8.7%.