Turnersville, NJ Map & Demographics
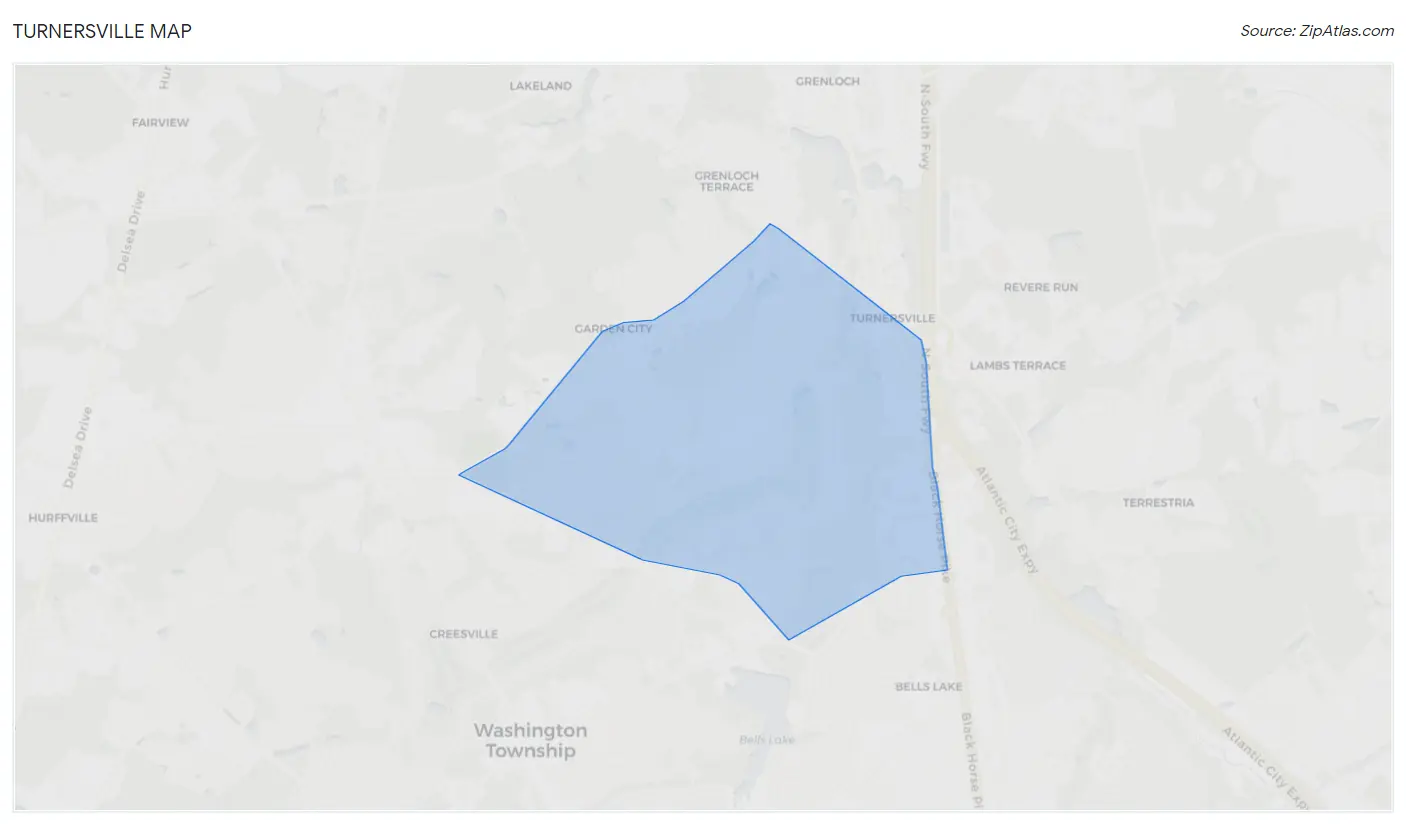
Turnersville Map
Turnersville Overview
$58,927
PER CAPITA INCOME
$175,142
AVG FAMILY INCOME
$152,120
AVG HOUSEHOLD INCOME
33.6%
WAGE / INCOME GAP [ % ]
66.4¢/ $1
WAGE / INCOME GAP [ $ ]
0.36
INEQUALITY / GINI INDEX
2,989
TOTAL POPULATION
1,534
MALE POPULATION
1,455
FEMALE POPULATION
105.43
MALES / 100 FEMALES
94.85
FEMALES / 100 MALES
43.0
MEDIAN AGE
3.2
AVG FAMILY SIZE
2.8
AVG HOUSEHOLD SIZE
1,749
LABOR FORCE [ PEOPLE ]
70.4%
PERCENT IN LABOR FORCE
4.1%
UNEMPLOYMENT RATE
Turnersville Area Codes
Income in Turnersville
Income Overview in Turnersville
Per Capita Income in Turnersville is $58,927, while median incomes of families and households are $175,142 and $152,120 respectively.
| Characteristic | Number | Measure |
| Per Capita Income | 2,989 | $58,927 |
| Median Family Income | 848 | $175,142 |
| Mean Family Income | 848 | $181,582 |
| Median Household Income | 1,055 | $152,120 |
| Mean Household Income | 1,055 | $162,033 |
| Income Deficit | 848 | $0 |
| Wage / Income Gap (%) | 2,989 | 33.64% |
| Wage / Income Gap ($) | 2,989 | 66.36¢ per $1 |
| Gini / Inequality Index | 2,989 | 0.36 |
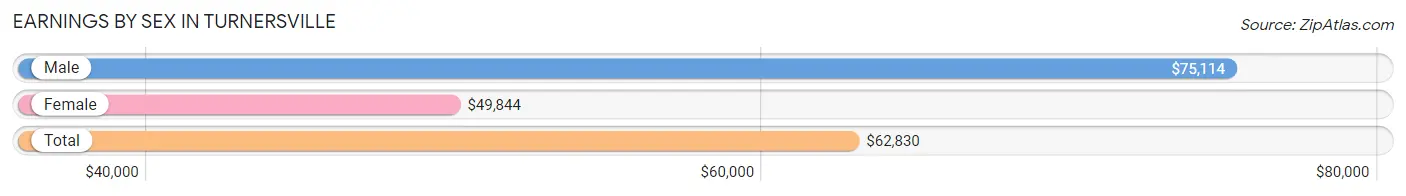
Earnings by Sex in Turnersville
Average Earnings in Turnersville are $62,830, $75,114 for men and $49,844 for women, a difference of 33.6%.
| Sex | Number | Average Earnings |
| Male | 923 (51.6%) | $75,114 |
| Female | 865 (48.4%) | $49,844 |
| Total | 1,788 (100.0%) | $62,830 |
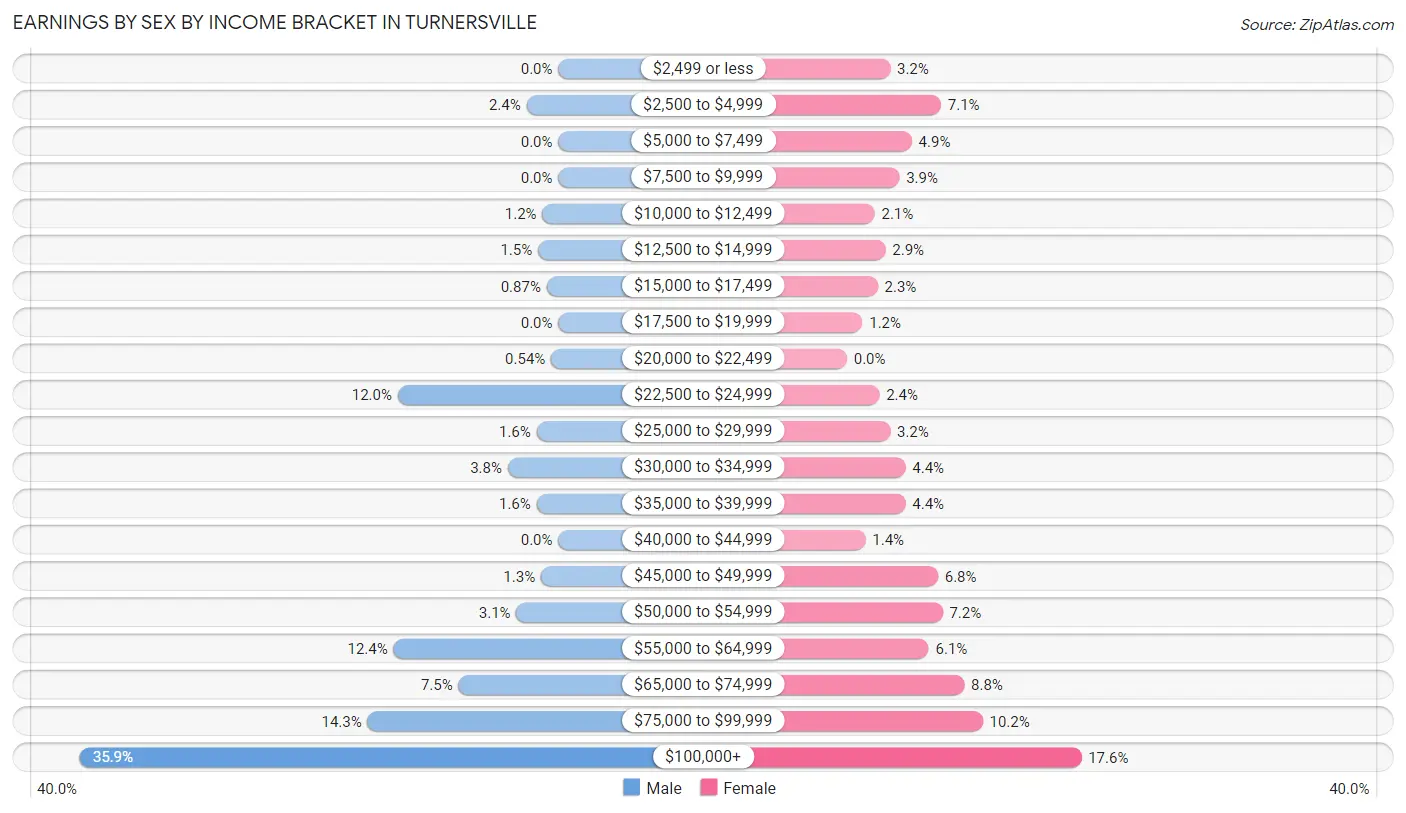
Earnings by Sex by Income Bracket in Turnersville
The most common earnings brackets in Turnersville are $100,000+ for men (331 | 35.9%) and $100,000+ for women (152 | 17.6%).
| Income | Male | Female |
| $2,499 or less | 0 (0.0%) | 28 (3.2%) |
| $2,500 to $4,999 | 22 (2.4%) | 61 (7.0%) |
| $5,000 to $7,499 | 0 (0.0%) | 42 (4.9%) |
| $7,500 to $9,999 | 0 (0.0%) | 34 (3.9%) |
| $10,000 to $12,499 | 11 (1.2%) | 18 (2.1%) |
| $12,500 to $14,999 | 14 (1.5%) | 25 (2.9%) |
| $15,000 to $17,499 | 8 (0.9%) | 20 (2.3%) |
| $17,500 to $19,999 | 0 (0.0%) | 10 (1.2%) |
| $20,000 to $22,499 | 5 (0.5%) | 0 (0.0%) |
| $22,500 to $24,999 | 111 (12.0%) | 21 (2.4%) |
| $25,000 to $29,999 | 15 (1.6%) | 28 (3.2%) |
| $30,000 to $34,999 | 35 (3.8%) | 38 (4.4%) |
| $35,000 to $39,999 | 15 (1.6%) | 38 (4.4%) |
| $40,000 to $44,999 | 0 (0.0%) | 12 (1.4%) |
| $45,000 to $49,999 | 12 (1.3%) | 59 (6.8%) |
| $50,000 to $54,999 | 29 (3.1%) | 62 (7.2%) |
| $55,000 to $64,999 | 114 (12.3%) | 53 (6.1%) |
| $65,000 to $74,999 | 69 (7.5%) | 76 (8.8%) |
| $75,000 to $99,999 | 132 (14.3%) | 88 (10.2%) |
| $100,000+ | 331 (35.9%) | 152 (17.6%) |
| Total | 923 (100.0%) | 865 (100.0%) |
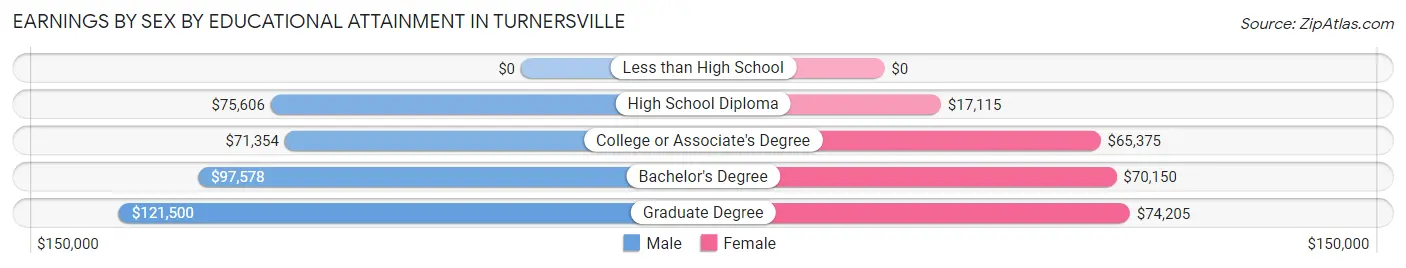
Earnings by Sex by Educational Attainment in Turnersville
Average earnings in Turnersville are $85,815 for men and $64,167 for women, a difference of 25.2%. Men with an educational attainment of graduate degree enjoy the highest average annual earnings of $121,500, while those with college or associate's degree education earn the least with $71,354. Women with an educational attainment of graduate degree earn the most with the average annual earnings of $74,205, while those with high school diploma education have the smallest earnings of $17,115.
| Educational Attainment | Male Income | Female Income |
| Less than High School | - | - |
| High School Diploma | $75,606 | $17,115 |
| College or Associate's Degree | $71,354 | $65,375 |
| Bachelor's Degree | $97,578 | $70,150 |
| Graduate Degree | $121,500 | $74,205 |
| Total | $85,815 | $64,167 |
Family Income in Turnersville
Family Income Brackets in Turnersville
According to the Turnersville family income data, there are 276 families falling into the $150,000 to $199,999 income range, which is the most common income bracket and makes up 32.6% of all families.
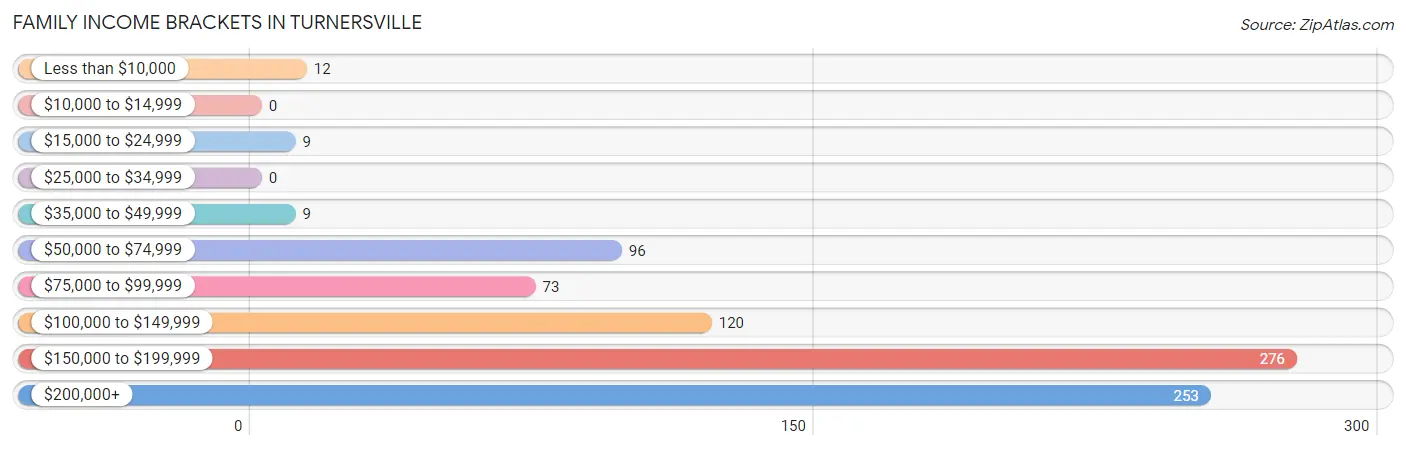
| Income Bracket | # Families | % Families |
| Less than $10,000 | 12 | 1.4% |
| $10,000 to $14,999 | 0 | 0.0% |
| $15,000 to $24,999 | 9 | 1.1% |
| $25,000 to $34,999 | 0 | 0.0% |
| $35,000 to $49,999 | 9 | 1.1% |
| $50,000 to $74,999 | 96 | 11.3% |
| $75,000 to $99,999 | 73 | 8.6% |
| $100,000 to $149,999 | 120 | 14.2% |
| $150,000 to $199,999 | 276 | 32.5% |
| $200,000+ | 253 | 29.8% |
Family Income by Famaliy Size in Turnersville
3-person families (241 | 28.4%) account for the highest median family income in Turnersville with $180,313 per family, while 3-person families (241 | 28.4%) have the highest median income of $60,104 per family member.
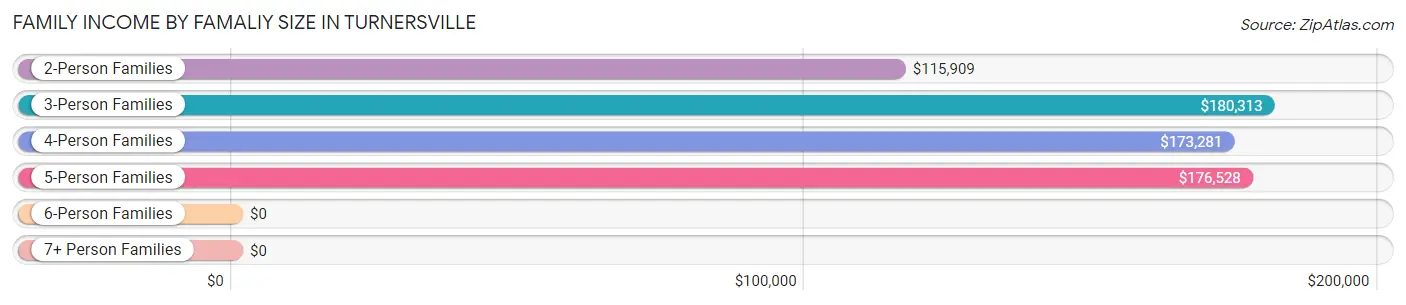
| Income Bracket | # Families | Median Income |
| 2-Person Families | 354 (41.7%) | $115,909 |
| 3-Person Families | 241 (28.4%) | $180,313 |
| 4-Person Families | 148 (17.4%) | $173,281 |
| 5-Person Families | 74 (8.7%) | $176,528 |
| 6-Person Families | 27 (3.2%) | $0 |
| 7+ Person Families | 4 (0.5%) | $0 |
| Total | 848 (100.0%) | $175,142 |
Family Income by Number of Earners in Turnersville
The median family income in Turnersville is $175,142, with families comprising 3+ earners (185) having the highest median family income of $211,806, while families with no earners (118) have the lowest median family income of $85,658, accounting for 21.8% and 13.9% of families, respectively.
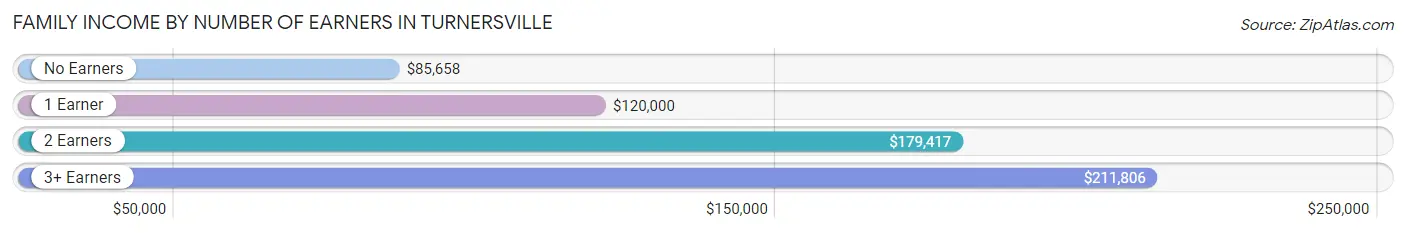
| Number of Earners | # Families | Median Income |
| No Earners | 118 (13.9%) | $85,658 |
| 1 Earner | 200 (23.6%) | $120,000 |
| 2 Earners | 345 (40.7%) | $179,417 |
| 3+ Earners | 185 (21.8%) | $211,806 |
| Total | 848 (100.0%) | $175,142 |
Household Income in Turnersville
Household Income Brackets in Turnersville
With 276 households falling in the category, the $150,000 to $199,999 income range is the most frequent in Turnersville, accounting for 26.2% of all households.
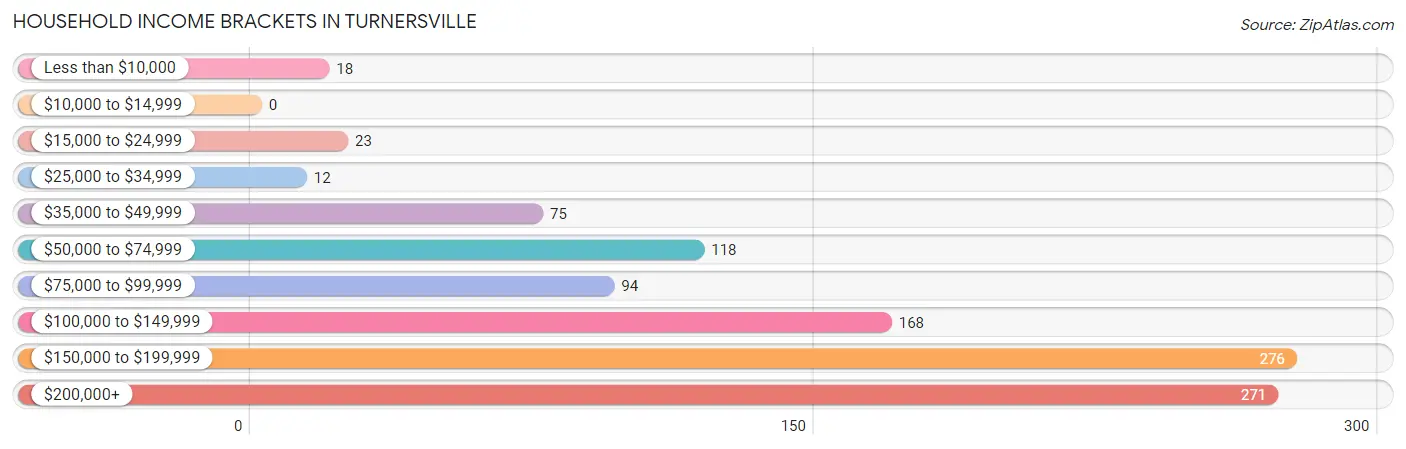
| Income Bracket | # Households | % Households |
| Less than $10,000 | 18 | 1.7% |
| $10,000 to $14,999 | 0 | 0.0% |
| $15,000 to $24,999 | 23 | 2.2% |
| $25,000 to $34,999 | 12 | 1.1% |
| $35,000 to $49,999 | 75 | 7.1% |
| $50,000 to $74,999 | 118 | 11.2% |
| $75,000 to $99,999 | 94 | 8.9% |
| $100,000 to $149,999 | 168 | 15.9% |
| $150,000 to $199,999 | 276 | 26.2% |
| $200,000+ | 271 | 25.7% |
Household Income by Householder Age in Turnersville
The median household income in Turnersville is $152,120, with the highest median household income of $187,813 found in the 45 to 64 years age bracket for the primary householder. A total of 438 households (41.5%) fall into this category.
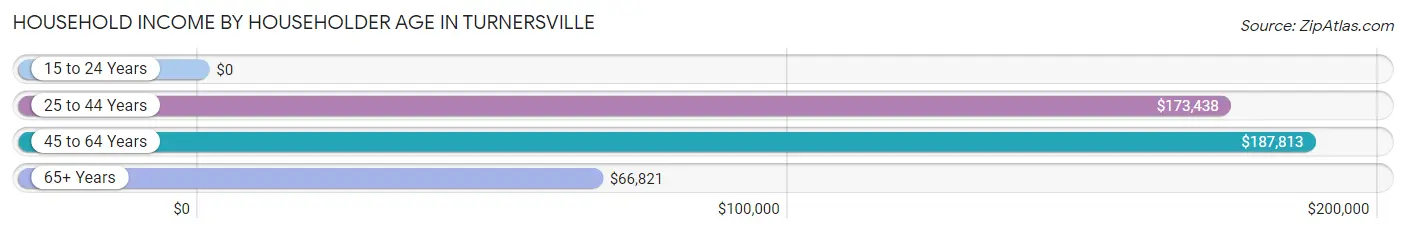
| Income Bracket | # Households | Median Income |
| 15 to 24 Years | 0 (0.0%) | $0 |
| 25 to 44 Years | 276 (26.2%) | $173,438 |
| 45 to 64 Years | 438 (41.5%) | $187,813 |
| 65+ Years | 341 (32.3%) | $66,821 |
| Total | 1,055 (100.0%) | $152,120 |
Poverty in Turnersville
Income Below Poverty by Sex and Age in Turnersville
With 2.0% poverty level for males and 0.4% for females among the residents of Turnersville, 75 year old and over males and 65 to 74 year old females are the most vulnerable to poverty, with 12 males (11.9%) and 6 females (4.3%) in their respective age groups living below the poverty level.
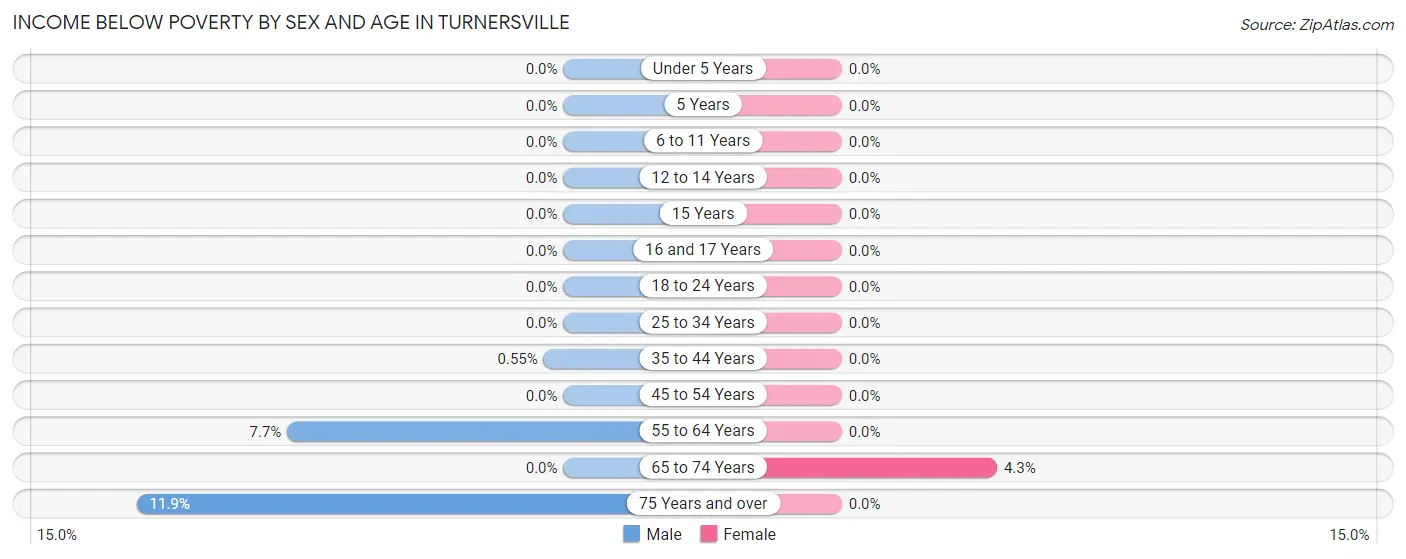
| Age Bracket | Male | Female |
| Under 5 Years | 0 (0.0%) | 0 (0.0%) |
| 5 Years | 0 (0.0%) | 0 (0.0%) |
| 6 to 11 Years | 0 (0.0%) | 0 (0.0%) |
| 12 to 14 Years | 0 (0.0%) | 0 (0.0%) |
| 15 Years | 0 (0.0%) | 0 (0.0%) |
| 16 and 17 Years | 0 (0.0%) | 0 (0.0%) |
| 18 to 24 Years | 0 (0.0%) | 0 (0.0%) |
| 25 to 34 Years | 0 (0.0%) | 0 (0.0%) |
| 35 to 44 Years | 1 (0.5%) | 0 (0.0%) |
| 45 to 54 Years | 0 (0.0%) | 0 (0.0%) |
| 55 to 64 Years | 17 (7.7%) | 0 (0.0%) |
| 65 to 74 Years | 0 (0.0%) | 6 (4.3%) |
| 75 Years and over | 12 (11.9%) | 0 (0.0%) |
| Total | 30 (2.0%) | 6 (0.4%) |
Income Above Poverty by Sex and Age in Turnersville
According to the poverty statistics in Turnersville, males aged under 5 years and females aged under 5 years are the age groups that are most secure financially, with 100.0% of males and 100.0% of females in these age groups living above the poverty line.
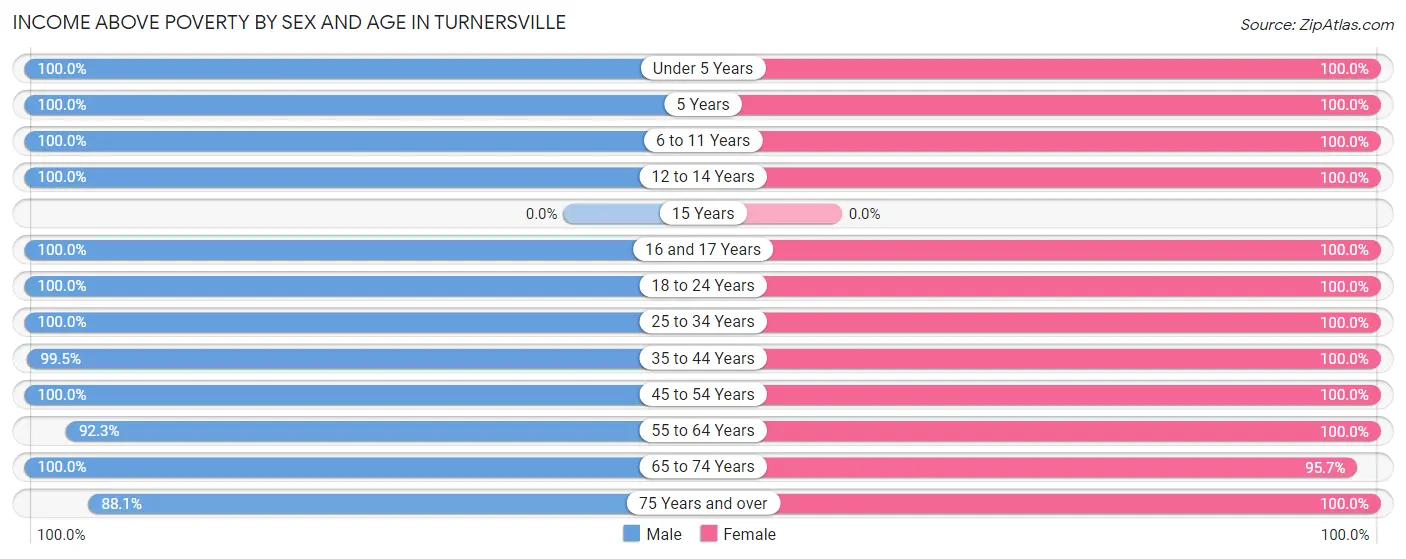
| Age Bracket | Male | Female |
| Under 5 Years | 96 (100.0%) | 93 (100.0%) |
| 5 Years | 39 (100.0%) | 24 (100.0%) |
| 6 to 11 Years | 87 (100.0%) | 39 (100.0%) |
| 12 to 14 Years | 105 (100.0%) | 22 (100.0%) |
| 15 Years | 0 (0.0%) | 0 (0.0%) |
| 16 and 17 Years | 45 (100.0%) | 36 (100.0%) |
| 18 to 24 Years | 134 (100.0%) | 217 (100.0%) |
| 25 to 34 Years | 180 (100.0%) | 155 (100.0%) |
| 35 to 44 Years | 181 (99.5%) | 204 (100.0%) |
| 45 to 54 Years | 177 (100.0%) | 105 (100.0%) |
| 55 to 64 Years | 204 (92.3%) | 311 (100.0%) |
| 65 to 74 Years | 167 (100.0%) | 133 (95.7%) |
| 75 Years and over | 89 (88.1%) | 110 (100.0%) |
| Total | 1,504 (98.0%) | 1,449 (99.6%) |
Income Below Poverty Among Married-Couple Families in Turnersville
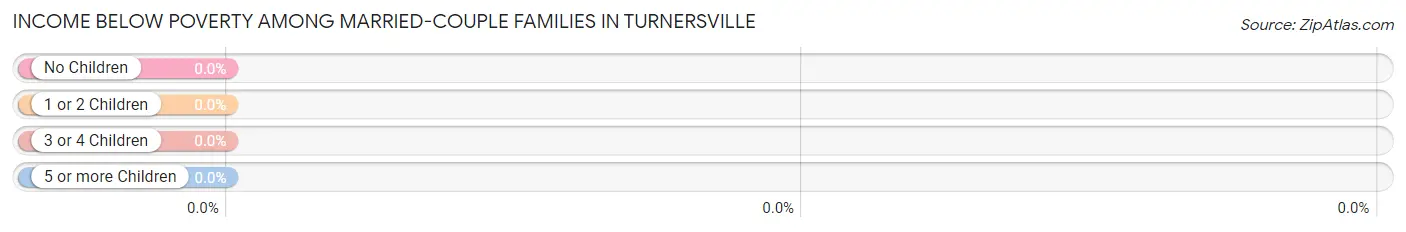
| Children | Above Poverty | Below Poverty |
| No Children | 402 (100.0%) | 0 (0.0%) |
| 1 or 2 Children | 218 (100.0%) | 0 (0.0%) |
| 3 or 4 Children | 67 (100.0%) | 0 (0.0%) |
| 5 or more Children | 0 (0.0%) | 0 (0.0%) |
| Total | 687 (100.0%) | 0 (0.0%) |
Income Below Poverty Among Single-Parent Households in Turnersville
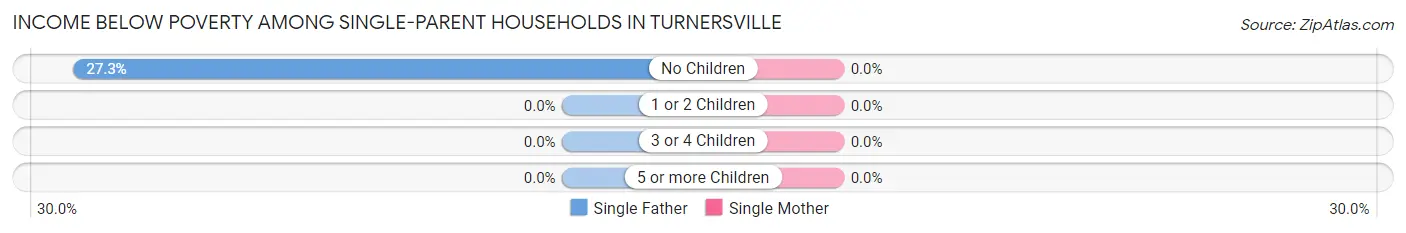
| Children | Single Father | Single Mother |
| No Children | 12 (27.3%) | 0 (0.0%) |
| 1 or 2 Children | 0 (0.0%) | 0 (0.0%) |
| 3 or 4 Children | 0 (0.0%) | 0 (0.0%) |
| 5 or more Children | 0 (0.0%) | 0 (0.0%) |
| Total | 12 (27.3%) | 0 (0.0%) |
Income Below Poverty Among Married-Couple vs Single-Parent Households in Turnersville
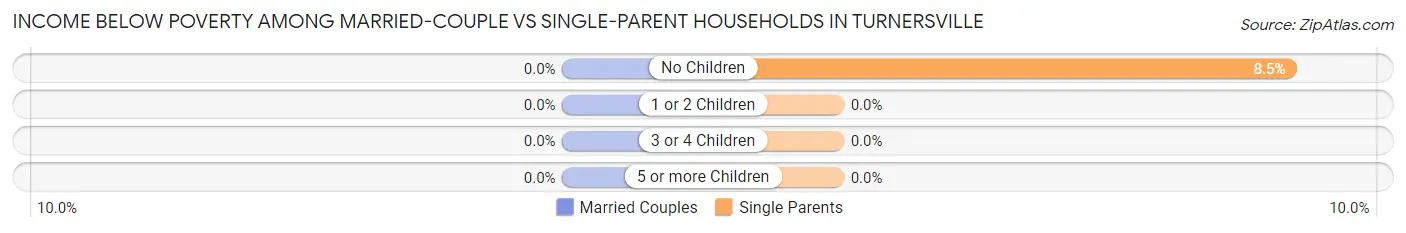
| Children | Married-Couple Families | Single-Parent Households |
| No Children | 0 (0.0%) | 12 (8.5%) |
| 1 or 2 Children | 0 (0.0%) | 0 (0.0%) |
| 3 or 4 Children | 0 (0.0%) | 0 (0.0%) |
| 5 or more Children | 0 (0.0%) | 0 (0.0%) |
| Total | 0 (0.0%) | 12 (7.4%) |
Race in Turnersville
The most populous races in Turnersville are White / Caucasian (2,705 | 90.5%), Two or more Races (181 | 6.1%), and Hispanic or Latino (118 | 4.0%).
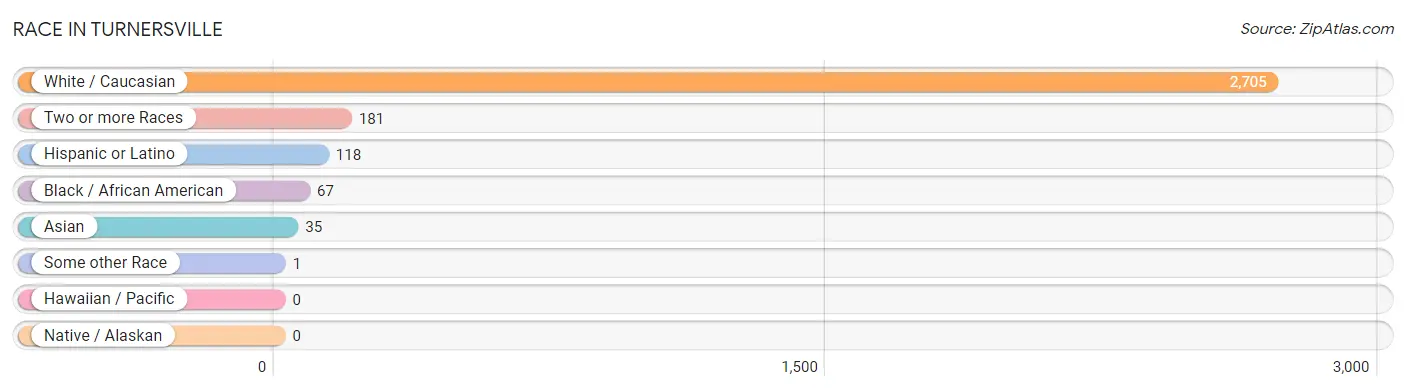
| Race | # Population | % Population |
| Asian | 35 | 1.2% |
| Black / African American | 67 | 2.2% |
| Hawaiian / Pacific | 0 | 0.0% |
| Hispanic or Latino | 118 | 4.0% |
| Native / Alaskan | 0 | 0.0% |
| White / Caucasian | 2,705 | 90.5% |
| Two or more Races | 181 | 6.1% |
| Some other Race | 1 | 0.0% |
| Total | 2,989 | 100.0% |
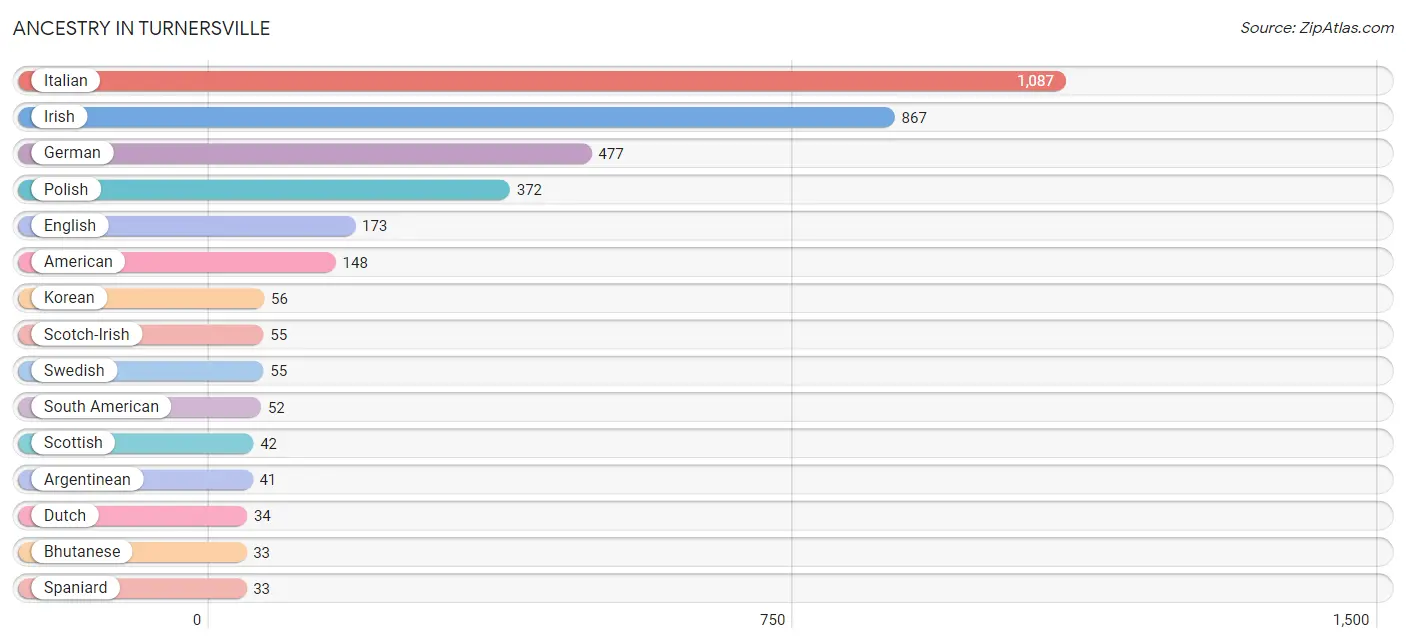
Ancestry in Turnersville
The most populous ancestries reported in Turnersville are Italian (1,087 | 36.4%), Irish (867 | 29.0%), German (477 | 16.0%), Polish (372 | 12.4%), and English (173 | 5.8%), together accounting for 99.6% of all Turnersville residents.
| Ancestry | # Population | % Population |
| American | 148 | 5.0% |
| Argentinean | 41 | 1.4% |
| Austrian | 10 | 0.3% |
| Bhutanese | 33 | 1.1% |
| Colombian | 11 | 0.4% |
| Cuban | 2 | 0.1% |
| Dutch | 34 | 1.1% |
| Eastern European | 13 | 0.4% |
| English | 173 | 5.8% |
| European | 19 | 0.6% |
| French | 10 | 0.3% |
| French Canadian | 25 | 0.8% |
| German | 477 | 16.0% |
| Greek | 13 | 0.4% |
| Hungarian | 25 | 0.8% |
| Irish | 867 | 29.0% |
| Italian | 1,087 | 36.4% |
| Korean | 56 | 1.9% |
| Lithuanian | 26 | 0.9% |
| Northern European | 12 | 0.4% |
| Norwegian | 9 | 0.3% |
| Pennsylvania German | 32 | 1.1% |
| Polish | 372 | 12.4% |
| Puerto Rican | 31 | 1.0% |
| Scotch-Irish | 55 | 1.8% |
| Scottish | 42 | 1.4% |
| Slovak | 10 | 0.3% |
| South American | 52 | 1.7% |
| Spaniard | 33 | 1.1% |
| Swedish | 55 | 1.8% |
| Thai | 9 | 0.3% |
| Ukrainian | 23 | 0.8% |
| Welsh | 21 | 0.7% | View All 33 Rows |
Immigrants in Turnersville
The most numerous immigrant groups reported in Turnersville came from Latin America (48 | 1.6%), South America (37 | 1.2%), Asia (25 | 0.8%), Argentina (22 | 0.7%), and Europe (16 | 0.5%), together accounting for 5.0% of all Turnersville residents.
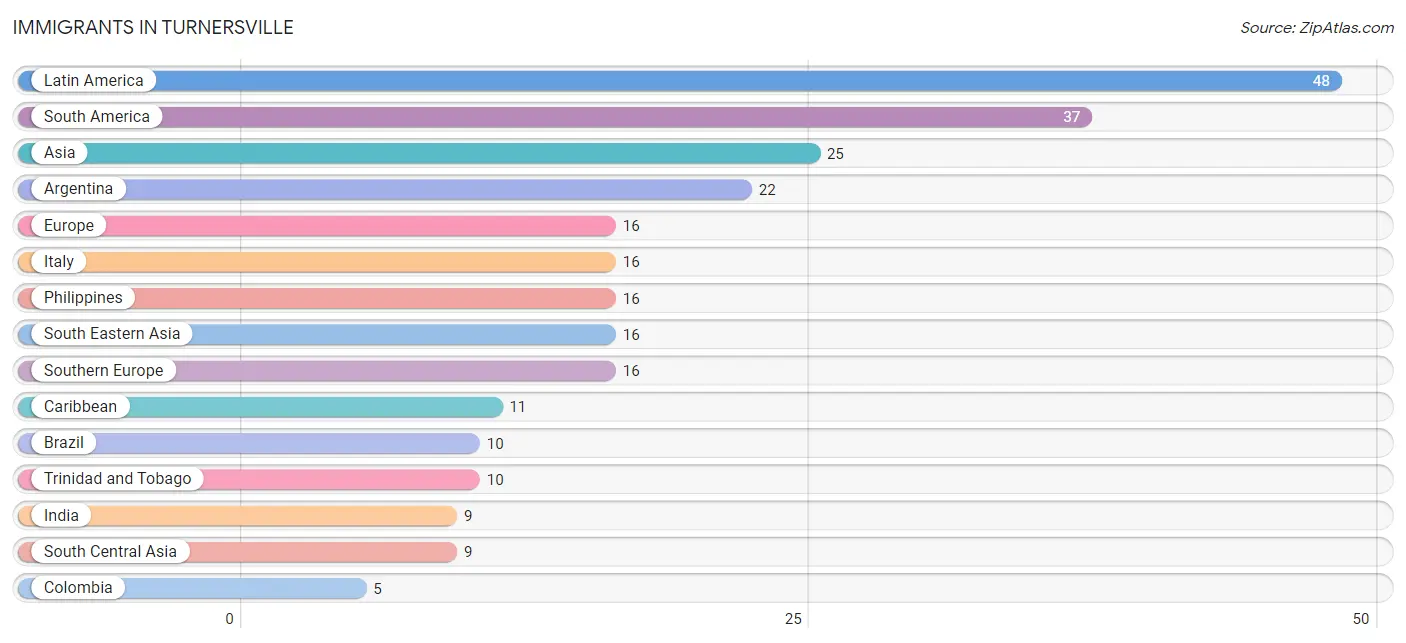
| Immigration Origin | # Population | % Population |
| Argentina | 22 | 0.7% |
| Asia | 25 | 0.8% |
| Brazil | 10 | 0.3% |
| Caribbean | 11 | 0.4% |
| Colombia | 5 | 0.2% |
| Cuba | 1 | 0.0% |
| Europe | 16 | 0.5% |
| India | 9 | 0.3% |
| Italy | 16 | 0.5% |
| Latin America | 48 | 1.6% |
| Philippines | 16 | 0.5% |
| South America | 37 | 1.2% |
| South Central Asia | 9 | 0.3% |
| South Eastern Asia | 16 | 0.5% |
| Southern Europe | 16 | 0.5% |
| Trinidad and Tobago | 10 | 0.3% | View All 16 Rows |
Sex and Age in Turnersville
Sex and Age in Turnersville
The most populous age groups in Turnersville are 10 to 14 Years (162 | 10.6%) for men and 20 to 24 Years (198 | 13.6%) for women.
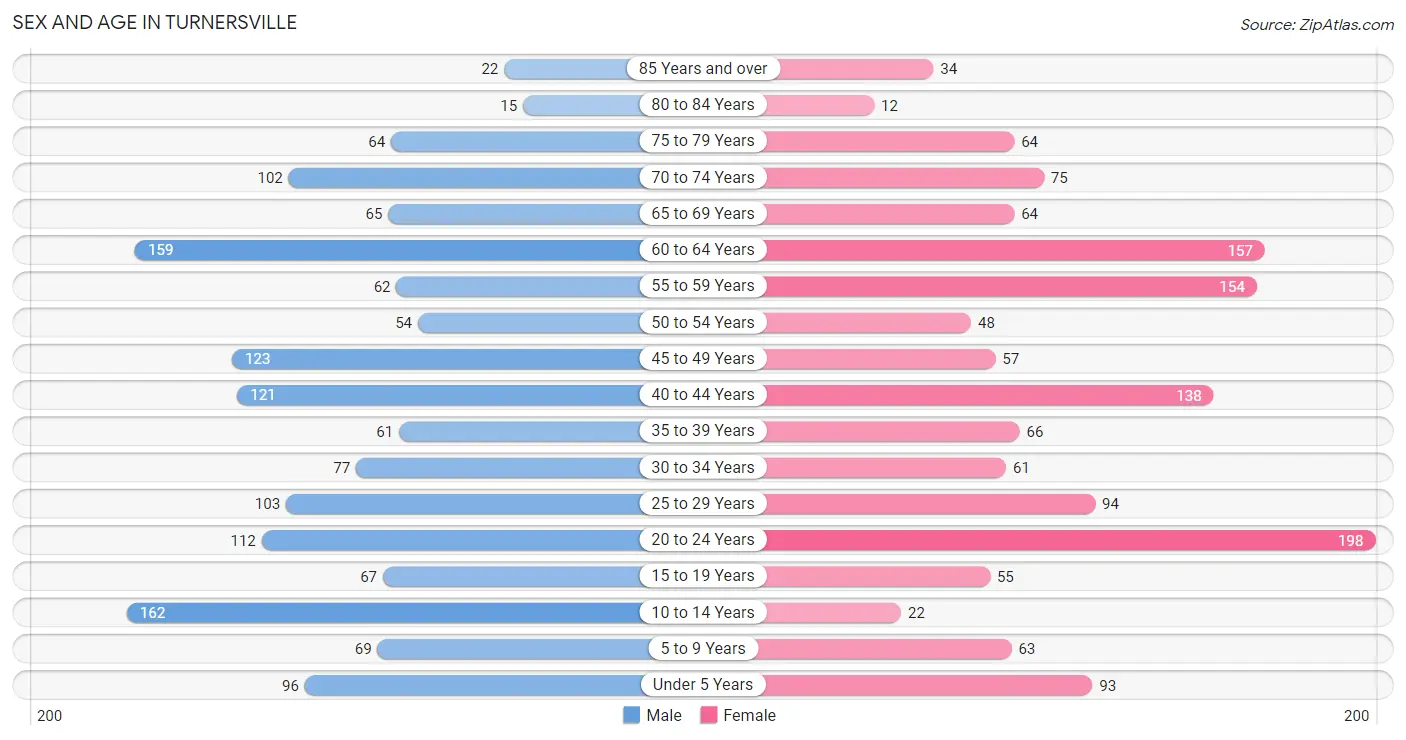
| Age Bracket | Male | Female |
| Under 5 Years | 96 (6.3%) | 93 (6.4%) |
| 5 to 9 Years | 69 (4.5%) | 63 (4.3%) |
| 10 to 14 Years | 162 (10.6%) | 22 (1.5%) |
| 15 to 19 Years | 67 (4.4%) | 55 (3.8%) |
| 20 to 24 Years | 112 (7.3%) | 198 (13.6%) |
| 25 to 29 Years | 103 (6.7%) | 94 (6.5%) |
| 30 to 34 Years | 77 (5.0%) | 61 (4.2%) |
| 35 to 39 Years | 61 (4.0%) | 66 (4.5%) |
| 40 to 44 Years | 121 (7.9%) | 138 (9.5%) |
| 45 to 49 Years | 123 (8.0%) | 57 (3.9%) |
| 50 to 54 Years | 54 (3.5%) | 48 (3.3%) |
| 55 to 59 Years | 62 (4.0%) | 154 (10.6%) |
| 60 to 64 Years | 159 (10.4%) | 157 (10.8%) |
| 65 to 69 Years | 65 (4.2%) | 64 (4.4%) |
| 70 to 74 Years | 102 (6.7%) | 75 (5.1%) |
| 75 to 79 Years | 64 (4.2%) | 64 (4.4%) |
| 80 to 84 Years | 15 (1.0%) | 12 (0.8%) |
| 85 Years and over | 22 (1.4%) | 34 (2.3%) |
| Total | 1,534 (100.0%) | 1,455 (100.0%) |
Families and Households in Turnersville
Median Family Size in Turnersville
The median family size in Turnersville is 3.21 persons per family, with married-couple families (687 | 81.0%) accounting for the largest median family size of 3.29 persons per family. On the other hand, single male/father families (44 | 5.2%) represent the smallest median family size with 2.32 persons per family.
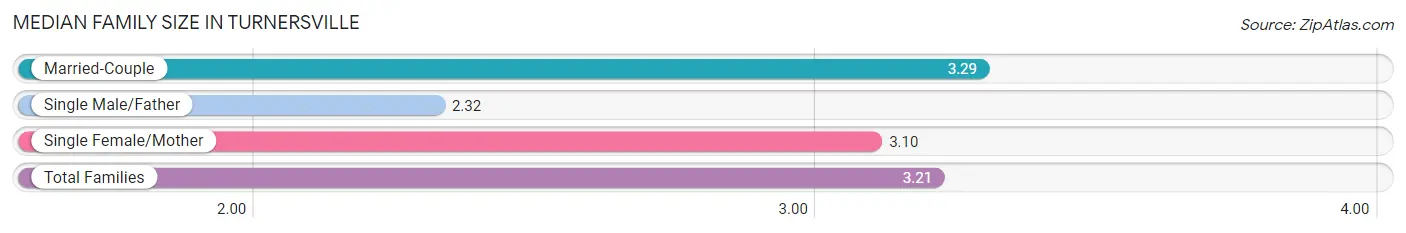
| Family Type | # Families | Family Size |
| Married-Couple | 687 (81.0%) | 3.29 |
| Single Male/Father | 44 (5.2%) | 2.32 |
| Single Female/Mother | 117 (13.8%) | 3.10 |
| Total Families | 848 (100.0%) | 3.21 |
Median Household Size in Turnersville
The median household size in Turnersville is 2.83 persons per household, with married-couple households (687 | 65.1%) accounting for the largest median household size of 3.29 persons per household. non-family households (207 | 19.6%) represent the smallest median household size with 1.26 persons per household.
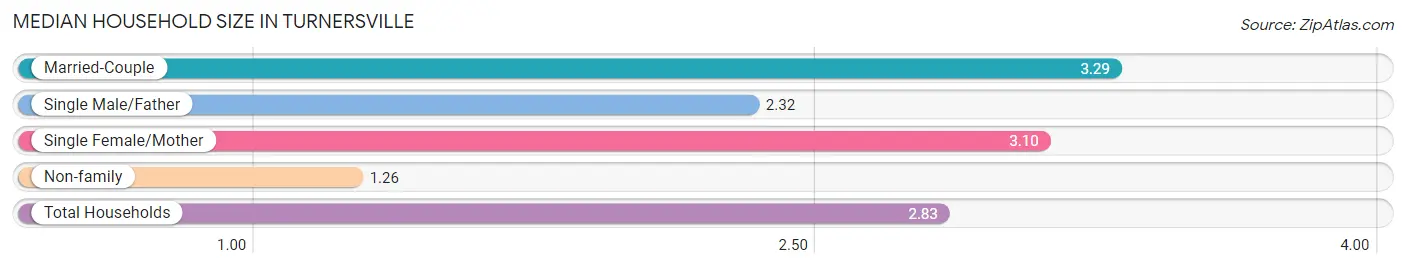
| Household Type | # Households | Household Size |
| Married-Couple | 687 (65.1%) | 3.29 |
| Single Male/Father | 44 (4.2%) | 2.32 |
| Single Female/Mother | 117 (11.1%) | 3.10 |
| Non-family | 207 (19.6%) | 1.26 |
| Total Households | 1,055 (100.0%) | 2.83 |
Household Size by Marriage Status in Turnersville
Out of a total of 1,055 households in Turnersville, 848 (80.4%) are family households, while 207 (19.6%) are nonfamily households. The most numerous type of family households are 2-person households, comprising 354, and the most common type of nonfamily households are 1-person households, comprising 157.
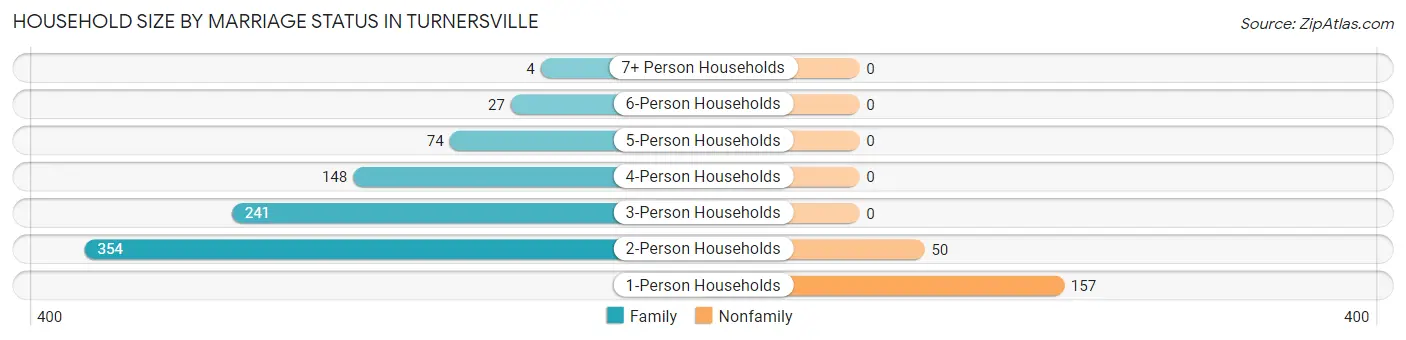
| Household Size | Family Households | Nonfamily Households |
| 1-Person Households | - | 157 (14.9%) |
| 2-Person Households | 354 (33.6%) | 50 (4.7%) |
| 3-Person Households | 241 (22.8%) | 0 (0.0%) |
| 4-Person Households | 148 (14.0%) | 0 (0.0%) |
| 5-Person Households | 74 (7.0%) | 0 (0.0%) |
| 6-Person Households | 27 (2.6%) | 0 (0.0%) |
| 7+ Person Households | 4 (0.4%) | 0 (0.0%) |
| Total | 848 (80.4%) | 207 (19.6%) |
Female Fertility in Turnersville
Fertility by Age in Turnersville
Average fertility rate in Turnersville is 56.0 births per 1,000 women. Women in the age bracket of 20 to 34 years have the highest fertility rate with 108.0 births per 1,000 women. Women in the age bracket of 20 to 34 years acount for 100.0% of all women with births.
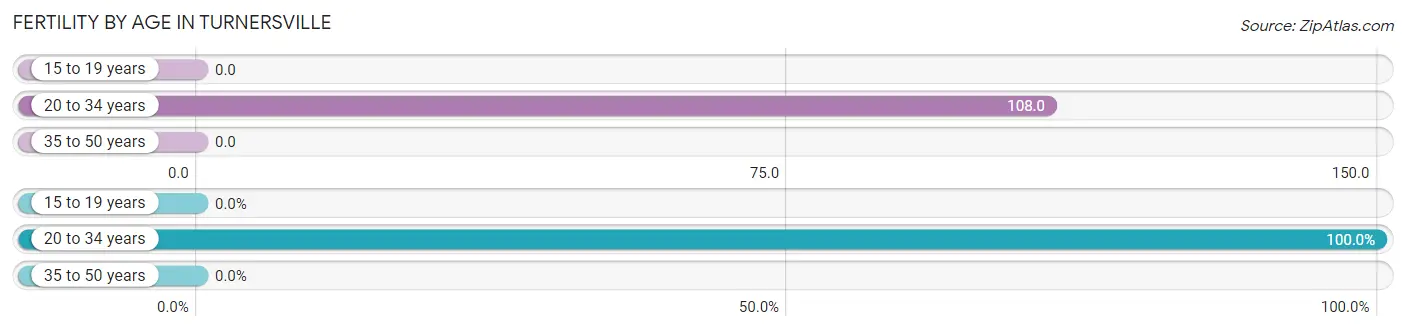
| Age Bracket | Women with Births | Births / 1,000 Women |
| 15 to 19 years | 0 (0.0%) | 0.0 |
| 20 to 34 years | 38 (100.0%) | 108.0 |
| 35 to 50 years | 0 (0.0%) | 0.0 |
| Total | 38 (100.0%) | 56.0 |
Fertility by Age by Marriage Status in Turnersville
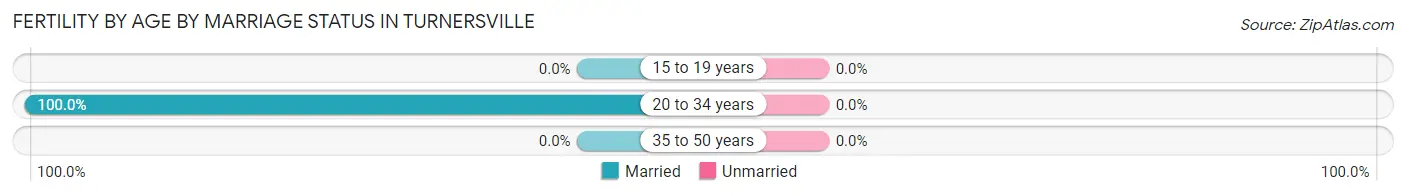
| Age Bracket | Married | Unmarried |
| 15 to 19 years | 0 (0.0%) | 0 (0.0%) |
| 20 to 34 years | 38 (100.0%) | 0 (0.0%) |
| 35 to 50 years | 0 (0.0%) | 0 (0.0%) |
| Total | 38 (100.0%) | 0 (0.0%) |
Fertility by Education in Turnersville
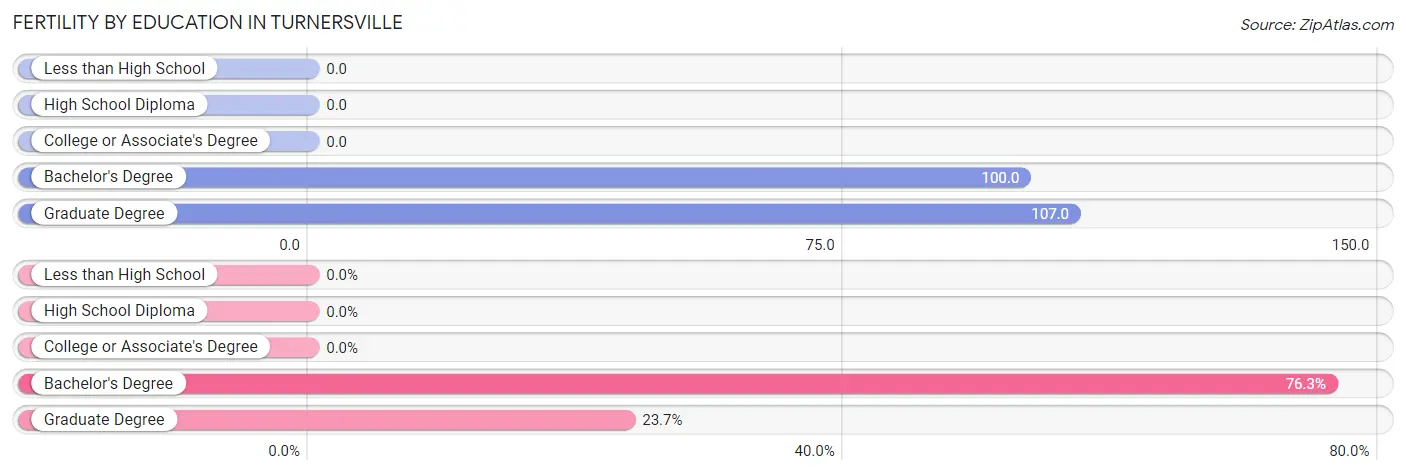
| Educational Attainment | Women with Births | Births / 1,000 Women |
| Less than High School | 0 (0.0%) | 0.0 |
| High School Diploma | 0 (0.0%) | 0.0 |
| College or Associate's Degree | 0 (0.0%) | 0.0 |
| Bachelor's Degree | 29 (76.3%) | 100.0 |
| Graduate Degree | 9 (23.7%) | 107.0 |
| Total | 38 (100.0%) | 56.0 |
Fertility by Education by Marriage Status in Turnersville
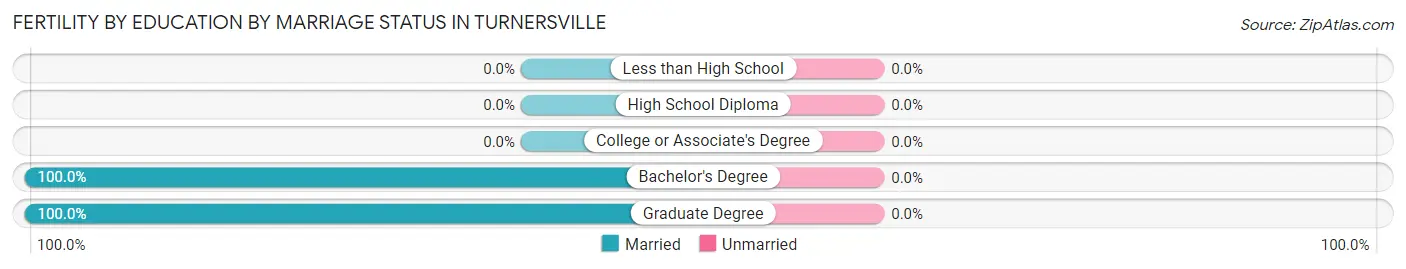
| Educational Attainment | Married | Unmarried |
| Less than High School | 0 (0.0%) | 0 (0.0%) |
| High School Diploma | 0 (0.0%) | 0 (0.0%) |
| College or Associate's Degree | 0 (0.0%) | 0 (0.0%) |
| Bachelor's Degree | 29 (100.0%) | 0 (0.0%) |
| Graduate Degree | 9 (100.0%) | 0 (0.0%) |
| Total | 38 (100.0%) | 0 (0.0%) |
Employment Characteristics in Turnersville
Employment by Class of Employer in Turnersville
Among the 1,654 employed individuals in Turnersville, private company employees (1,270 | 76.8%), not-for-profit organizations (124 | 7.5%), and local government employees (87 | 5.3%) make up the most common classes of employment.
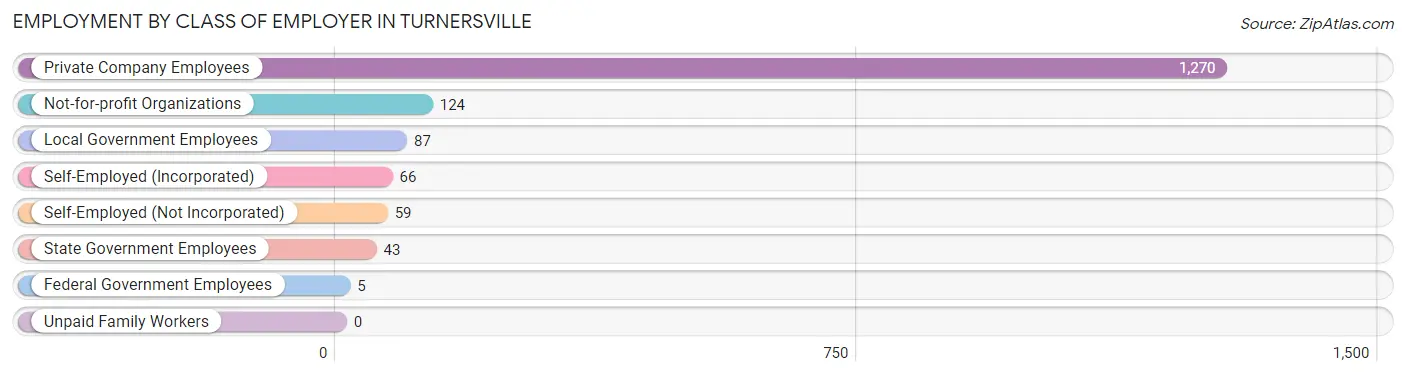
| Employer Class | # Employees | % Employees |
| Private Company Employees | 1,270 | 76.8% |
| Self-Employed (Incorporated) | 66 | 4.0% |
| Self-Employed (Not Incorporated) | 59 | 3.6% |
| Not-for-profit Organizations | 124 | 7.5% |
| Local Government Employees | 87 | 5.3% |
| State Government Employees | 43 | 2.6% |
| Federal Government Employees | 5 | 0.3% |
| Unpaid Family Workers | 0 | 0.0% |
| Total | 1,654 | 100.0% |
Employment Status by Age in Turnersville
According to the labor force statistics for Turnersville, out of the total population over 16 years of age (2,484), 70.4% or 1,749 individuals are in the labor force, with 4.1% or 72 of them unemployed. The age group with the highest labor force participation rate is 25 to 29 years, with 99.5% or 196 individuals in the labor force. Within the labor force, the 65 to 74 years age range has the highest percentage of unemployed individuals, with 21.5% or 23 of them being unemployed.
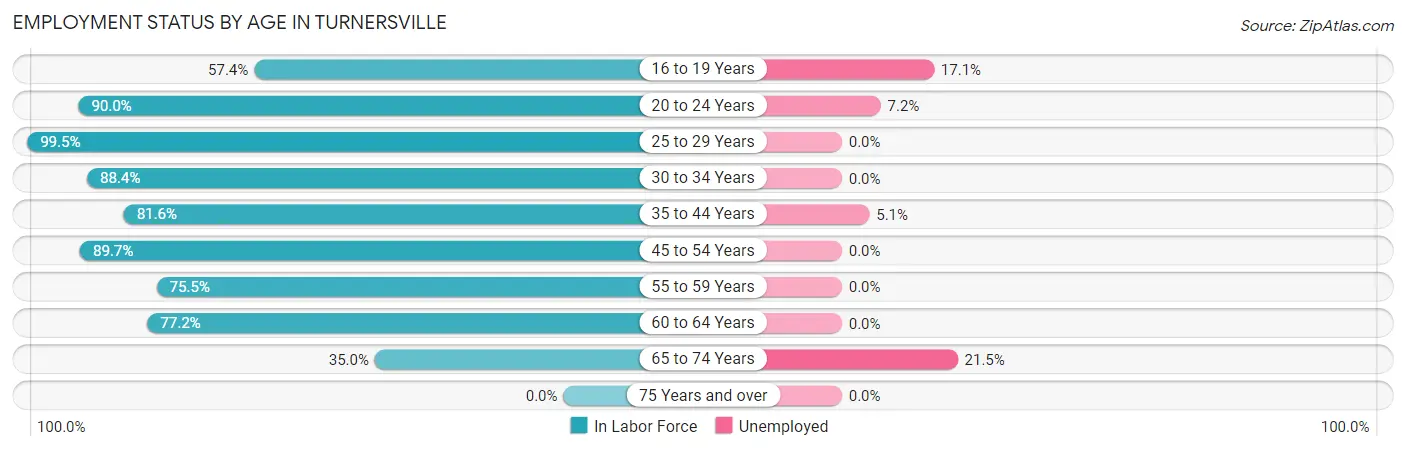
| Age Bracket | In Labor Force | Unemployed |
| 16 to 19 Years | 70 (57.4%) | 12 (17.1%) |
| 20 to 24 Years | 279 (90.0%) | 20 (7.2%) |
| 25 to 29 Years | 196 (99.5%) | 0 (0.0%) |
| 30 to 34 Years | 122 (88.4%) | 0 (0.0%) |
| 35 to 44 Years | 315 (81.6%) | 16 (5.1%) |
| 45 to 54 Years | 253 (89.7%) | 0 (0.0%) |
| 55 to 59 Years | 163 (75.5%) | 0 (0.0%) |
| 60 to 64 Years | 244 (77.2%) | 0 (0.0%) |
| 65 to 74 Years | 107 (35.0%) | 23 (21.5%) |
| 75 Years and over | 0 (0.0%) | 0 (0.0%) |
| Total | 1,749 (70.4%) | 72 (4.1%) |
Employment Status by Educational Attainment in Turnersville
According to labor force statistics for Turnersville, 84.2% of individuals (1,292) out of the total population between 25 and 64 years of age (1,535) are in the labor force, with 1.2% or 16 of them being unemployed. The group with the highest labor force participation rate are those with the educational attainment of less than high school, with 87.5% or 42 individuals in the labor force. Within the labor force, individuals with college / associate degree education have the highest percentage of unemployment, with 4.4% or 16 of them being unemployed.
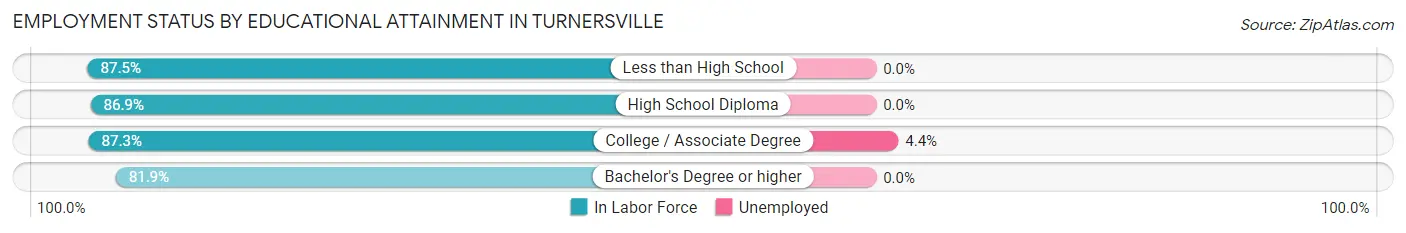
| Educational Attainment | In Labor Force | Unemployed |
| Less than High School | 42 (87.5%) | 0 (0.0%) |
| High School Diploma | 186 (86.9%) | 0 (0.0%) |
| College / Associate Degree | 364 (87.3%) | 18 (4.4%) |
| Bachelor's Degree or higher | 701 (81.9%) | 0 (0.0%) |
| Total | 1,292 (84.2%) | 18 (1.2%) |
Employment Occupations by Sex in Turnersville
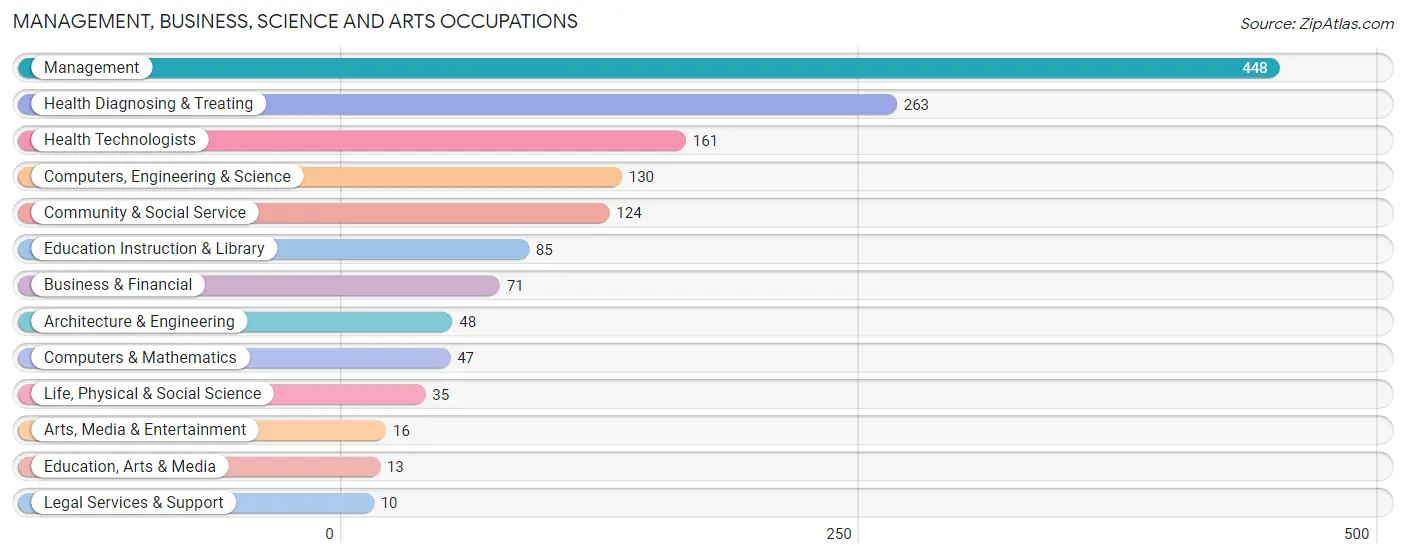
Management, Business, Science and Arts Occupations
The most common Management, Business, Science and Arts occupations in Turnersville are Management (448 | 26.7%), Health Diagnosing & Treating (263 | 15.7%), Health Technologists (161 | 9.6%), Computers, Engineering & Science (130 | 7.7%), and Community & Social Service (124 | 7.4%).
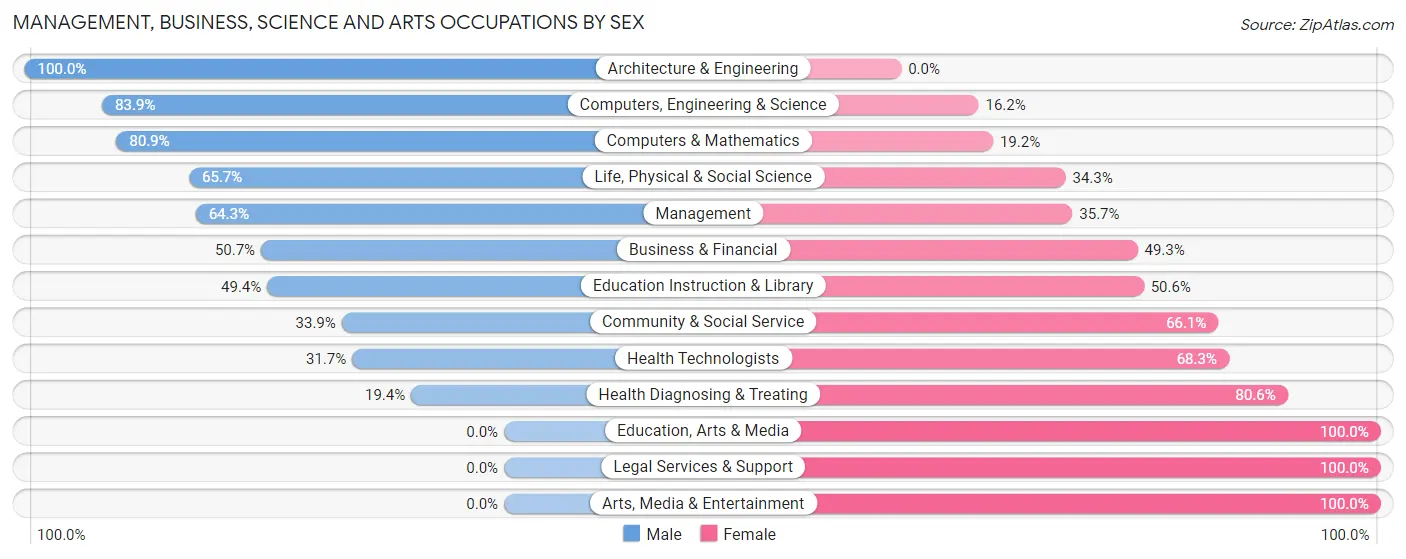
Management, Business, Science and Arts Occupations by Sex
Within the Management, Business, Science and Arts occupations in Turnersville, the most male-oriented occupations are Architecture & Engineering (100.0%), Computers, Engineering & Science (83.9%), and Computers & Mathematics (80.8%), while the most female-oriented occupations are Education, Arts & Media (100.0%), Legal Services & Support (100.0%), and Arts, Media & Entertainment (100.0%).
| Occupation | Male | Female |
| Management | 288 (64.3%) | 160 (35.7%) |
| Business & Financial | 36 (50.7%) | 35 (49.3%) |
| Computers, Engineering & Science | 109 (83.9%) | 21 (16.2%) |
| Computers & Mathematics | 38 (80.8%) | 9 (19.2%) |
| Architecture & Engineering | 48 (100.0%) | 0 (0.0%) |
| Life, Physical & Social Science | 23 (65.7%) | 12 (34.3%) |
| Community & Social Service | 42 (33.9%) | 82 (66.1%) |
| Education, Arts & Media | 0 (0.0%) | 13 (100.0%) |
| Legal Services & Support | 0 (0.0%) | 10 (100.0%) |
| Education Instruction & Library | 42 (49.4%) | 43 (50.6%) |
| Arts, Media & Entertainment | 0 (0.0%) | 16 (100.0%) |
| Health Diagnosing & Treating | 51 (19.4%) | 212 (80.6%) |
| Health Technologists | 51 (31.7%) | 110 (68.3%) |
| Total (Category) | 526 (50.8%) | 510 (49.2%) |
| Total (Overall) | 871 (51.9%) | 807 (48.1%) |
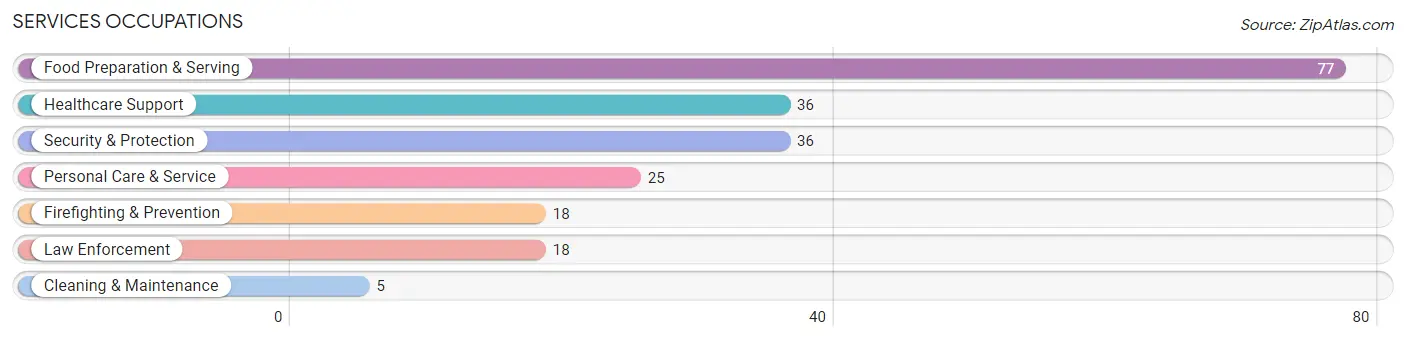
Services Occupations
The most common Services occupations in Turnersville are Food Preparation & Serving (77 | 4.6%), Healthcare Support (36 | 2.1%), Security & Protection (36 | 2.1%), Personal Care & Service (25 | 1.5%), and Firefighting & Prevention (18 | 1.1%).
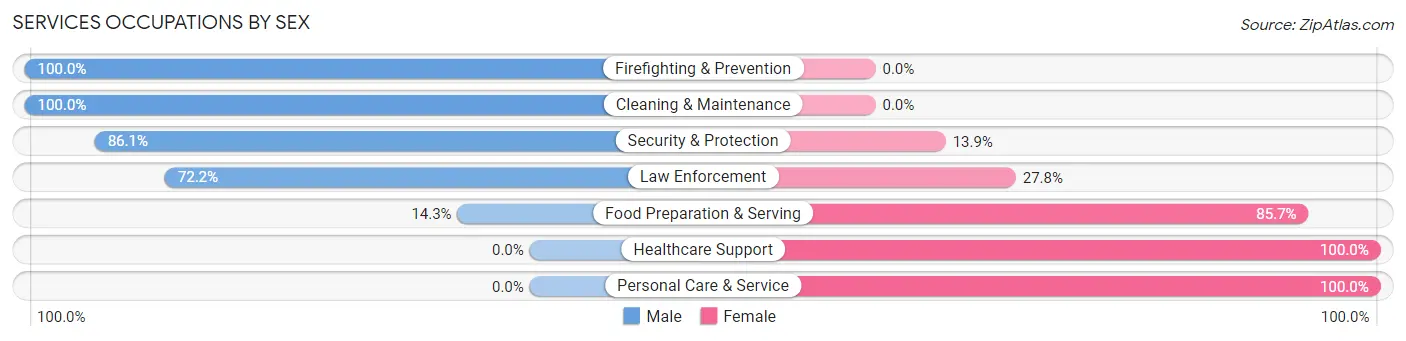
Services Occupations by Sex
Within the Services occupations in Turnersville, the most male-oriented occupations are Firefighting & Prevention (100.0%), Cleaning & Maintenance (100.0%), and Security & Protection (86.1%), while the most female-oriented occupations are Healthcare Support (100.0%), Personal Care & Service (100.0%), and Food Preparation & Serving (85.7%).
| Occupation | Male | Female |
| Healthcare Support | 0 (0.0%) | 36 (100.0%) |
| Security & Protection | 31 (86.1%) | 5 (13.9%) |
| Firefighting & Prevention | 18 (100.0%) | 0 (0.0%) |
| Law Enforcement | 13 (72.2%) | 5 (27.8%) |
| Food Preparation & Serving | 11 (14.3%) | 66 (85.7%) |
| Cleaning & Maintenance | 5 (100.0%) | 0 (0.0%) |
| Personal Care & Service | 0 (0.0%) | 25 (100.0%) |
| Total (Category) | 47 (26.3%) | 132 (73.7%) |
| Total (Overall) | 871 (51.9%) | 807 (48.1%) |
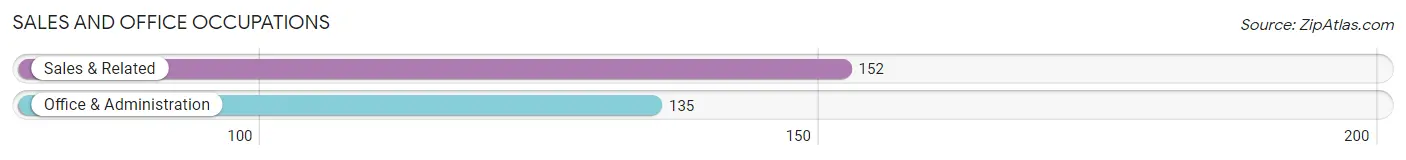
Sales and Office Occupations
The most common Sales and Office occupations in Turnersville are Sales & Related (152 | 9.1%), and Office & Administration (135 | 8.1%).
Sales and Office Occupations by Sex
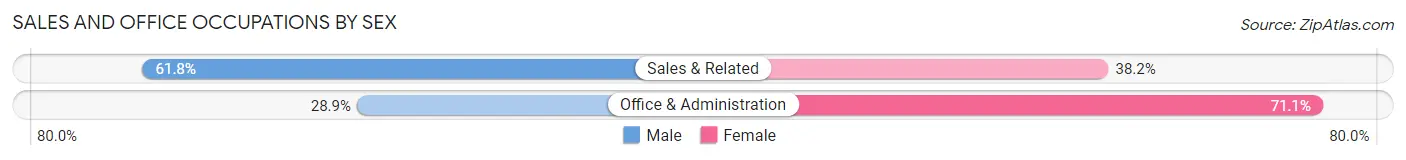
| Occupation | Male | Female |
| Sales & Related | 94 (61.8%) | 58 (38.2%) |
| Office & Administration | 39 (28.9%) | 96 (71.1%) |
| Total (Category) | 133 (46.3%) | 154 (53.7%) |
| Total (Overall) | 871 (51.9%) | 807 (48.1%) |
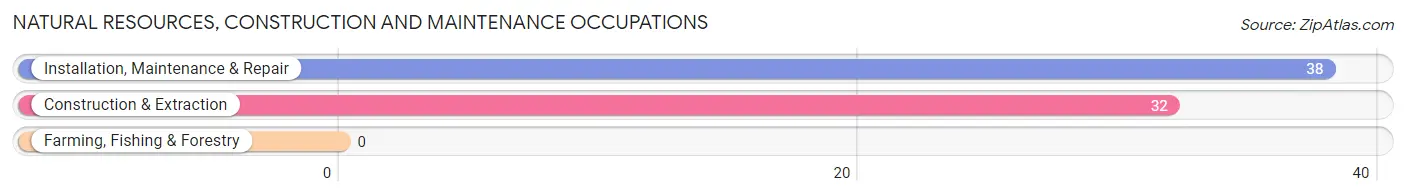
Natural Resources, Construction and Maintenance Occupations
The most common Natural Resources, Construction and Maintenance occupations in Turnersville are Installation, Maintenance & Repair (38 | 2.3%), and Construction & Extraction (32 | 1.9%).
Natural Resources, Construction and Maintenance Occupations by Sex
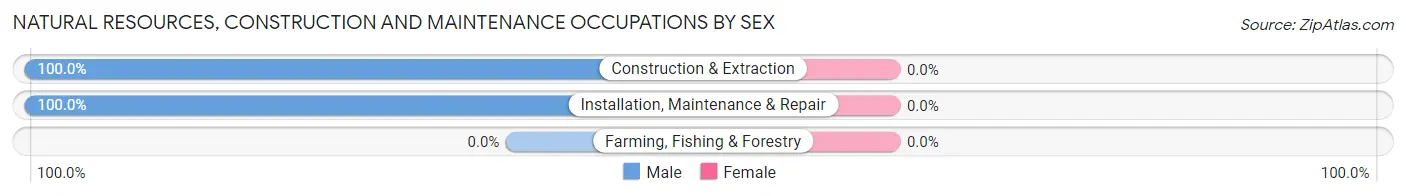
| Occupation | Male | Female |
| Farming, Fishing & Forestry | 0 (0.0%) | 0 (0.0%) |
| Construction & Extraction | 32 (100.0%) | 0 (0.0%) |
| Installation, Maintenance & Repair | 38 (100.0%) | 0 (0.0%) |
| Total (Category) | 70 (100.0%) | 0 (0.0%) |
| Total (Overall) | 871 (51.9%) | 807 (48.1%) |
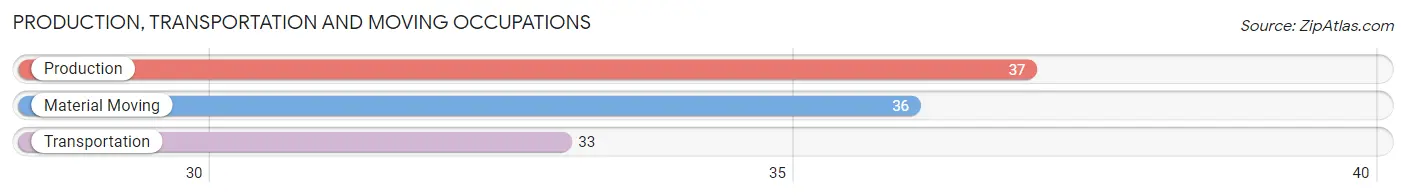
Production, Transportation and Moving Occupations
The most common Production, Transportation and Moving occupations in Turnersville are Production (37 | 2.2%), Material Moving (36 | 2.1%), and Transportation (33 | 2.0%).
Production, Transportation and Moving Occupations by Sex
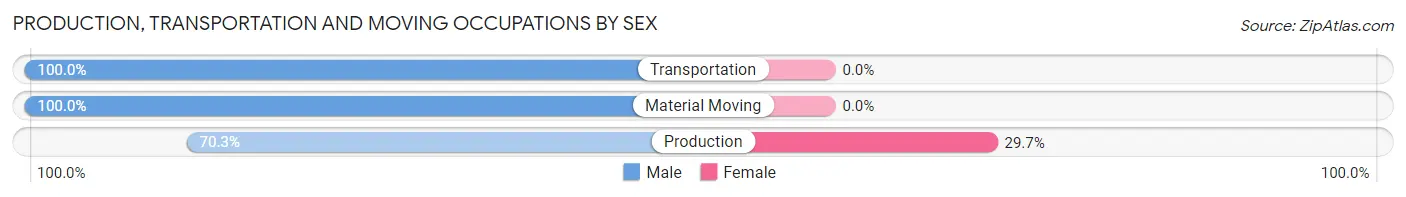
| Occupation | Male | Female |
| Production | 26 (70.3%) | 11 (29.7%) |
| Transportation | 33 (100.0%) | 0 (0.0%) |
| Material Moving | 36 (100.0%) | 0 (0.0%) |
| Total (Category) | 95 (89.6%) | 11 (10.4%) |
| Total (Overall) | 871 (51.9%) | 807 (48.1%) |
Employment Industries by Sex in Turnersville
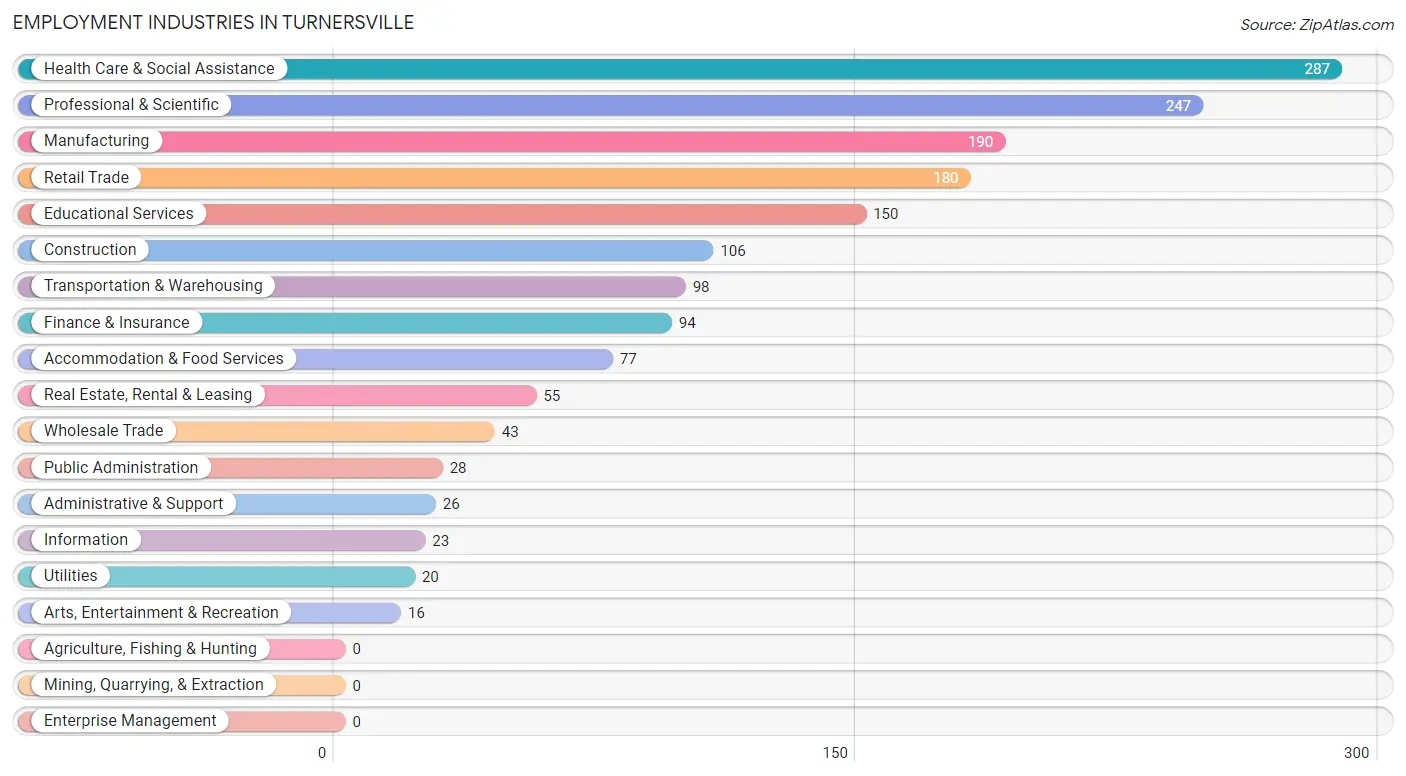
Employment Industries in Turnersville
The major employment industries in Turnersville include Health Care & Social Assistance (287 | 17.1%), Professional & Scientific (247 | 14.7%), Manufacturing (190 | 11.3%), Retail Trade (180 | 10.7%), and Educational Services (150 | 8.9%).
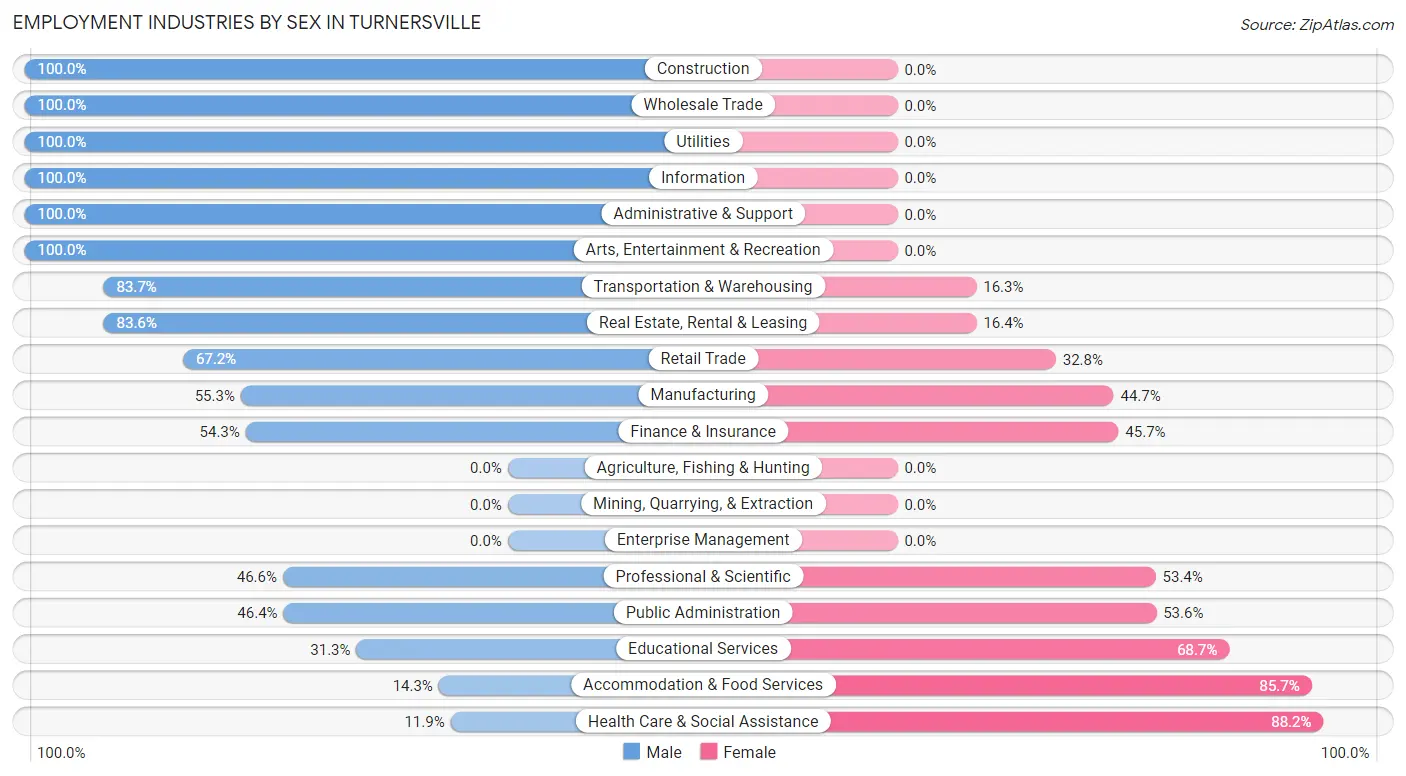
Employment Industries by Sex in Turnersville
The Turnersville industries that see more men than women are Construction (100.0%), Wholesale Trade (100.0%), and Utilities (100.0%), whereas the industries that tend to have a higher number of women are Health Care & Social Assistance (88.1%), Accommodation & Food Services (85.7%), and Educational Services (68.7%).
| Industry | Male | Female |
| Agriculture, Fishing & Hunting | 0 (0.0%) | 0 (0.0%) |
| Mining, Quarrying, & Extraction | 0 (0.0%) | 0 (0.0%) |
| Construction | 106 (100.0%) | 0 (0.0%) |
| Manufacturing | 105 (55.3%) | 85 (44.7%) |
| Wholesale Trade | 43 (100.0%) | 0 (0.0%) |
| Retail Trade | 121 (67.2%) | 59 (32.8%) |
| Transportation & Warehousing | 82 (83.7%) | 16 (16.3%) |
| Utilities | 20 (100.0%) | 0 (0.0%) |
| Information | 23 (100.0%) | 0 (0.0%) |
| Finance & Insurance | 51 (54.3%) | 43 (45.7%) |
| Real Estate, Rental & Leasing | 46 (83.6%) | 9 (16.4%) |
| Professional & Scientific | 115 (46.6%) | 132 (53.4%) |
| Enterprise Management | 0 (0.0%) | 0 (0.0%) |
| Administrative & Support | 26 (100.0%) | 0 (0.0%) |
| Educational Services | 47 (31.3%) | 103 (68.7%) |
| Health Care & Social Assistance | 34 (11.8%) | 253 (88.1%) |
| Arts, Entertainment & Recreation | 16 (100.0%) | 0 (0.0%) |
| Accommodation & Food Services | 11 (14.3%) | 66 (85.7%) |
| Public Administration | 13 (46.4%) | 15 (53.6%) |
| Total | 871 (51.9%) | 807 (48.1%) |
Education in Turnersville
School Enrollment in Turnersville
The most common levels of schooling among the 654 students in Turnersville are college / undergraduate (192 | 29.4%), middle school (159 | 24.3%), and high school (112 | 17.1%).
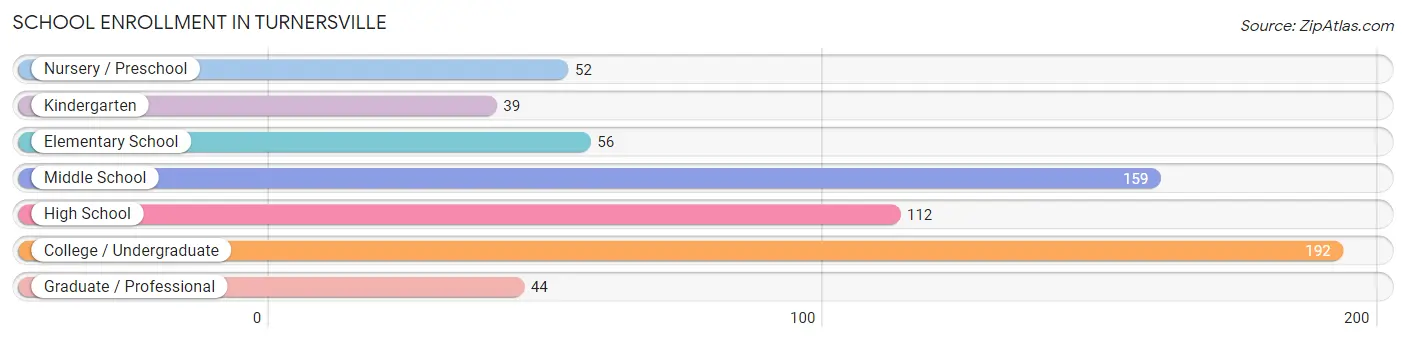
| School Level | # Students | % Students |
| Nursery / Preschool | 52 | 8.0% |
| Kindergarten | 39 | 6.0% |
| Elementary School | 56 | 8.6% |
| Middle School | 159 | 24.3% |
| High School | 112 | 17.1% |
| College / Undergraduate | 192 | 29.4% |
| Graduate / Professional | 44 | 6.7% |
| Total | 654 | 100.0% |
School Enrollment by Age by Funding Source in Turnersville
Out of a total of 654 students who are enrolled in schools in Turnersville, 180 (27.5%) attend a private institution, while the remaining 474 (72.5%) are enrolled in public schools. The age group of 3 to 4 year olds has the highest likelihood of being enrolled in private schools, with 13 (100.0% in the age bracket) enrolled. Conversely, the age group of 18 to 19 year olds has the lowest likelihood of being enrolled in a private school, with 41 (100.0% in the age bracket) attending a public institution.
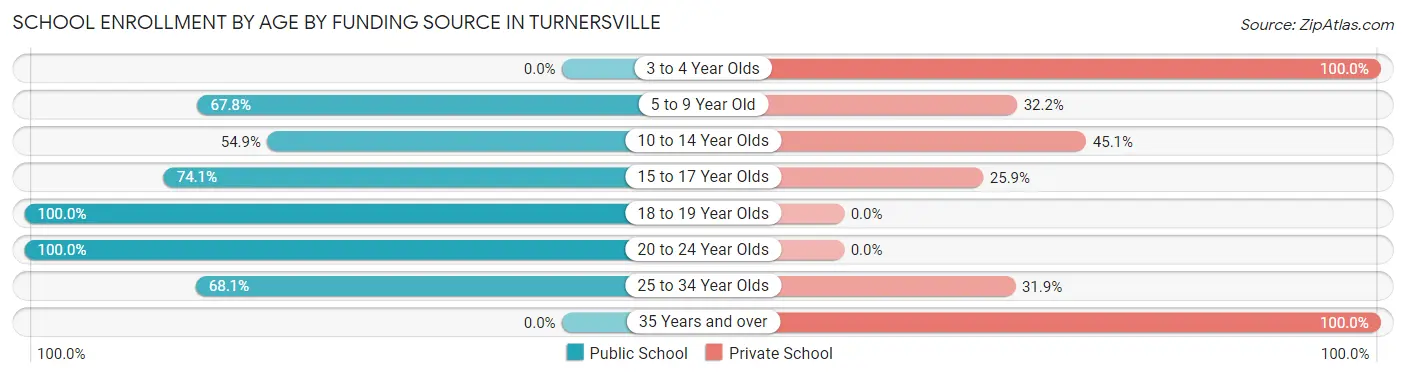
| Age Bracket | Public School | Private School |
| 3 to 4 Year Olds | 0 (0.0%) | 13 (100.0%) |
| 5 to 9 Year Old | 82 (67.8%) | 39 (32.2%) |
| 10 to 14 Year Olds | 101 (54.9%) | 83 (45.1%) |
| 15 to 17 Year Olds | 60 (74.1%) | 21 (25.9%) |
| 18 to 19 Year Olds | 41 (100.0%) | 0 (0.0%) |
| 20 to 24 Year Olds | 158 (100.0%) | 0 (0.0%) |
| 25 to 34 Year Olds | 32 (68.1%) | 15 (31.9%) |
| 35 Years and over | 0 (0.0%) | 9 (100.0%) |
| Total | 474 (72.5%) | 180 (27.5%) |
Educational Attainment by Field of Study in Turnersville
Business (293 | 25.8%), education (182 | 16.1%), science & technology (132 | 11.6%), physical & health sciences (103 | 9.1%), and literature & languages (76 | 6.7%) are the most common fields of study among 1,134 individuals in Turnersville who have obtained a bachelor's degree or higher.
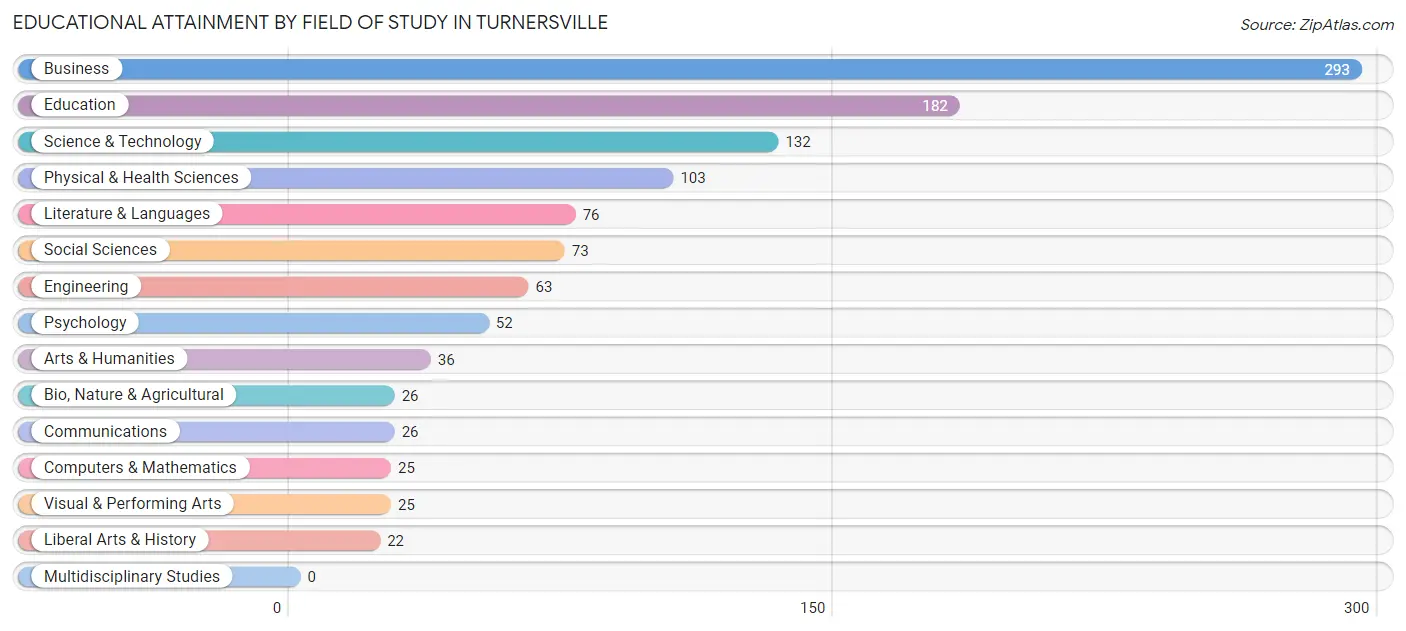
| Field of Study | # Graduates | % Graduates |
| Computers & Mathematics | 25 | 2.2% |
| Bio, Nature & Agricultural | 26 | 2.3% |
| Physical & Health Sciences | 103 | 9.1% |
| Psychology | 52 | 4.6% |
| Social Sciences | 73 | 6.4% |
| Engineering | 63 | 5.6% |
| Multidisciplinary Studies | 0 | 0.0% |
| Science & Technology | 132 | 11.6% |
| Business | 293 | 25.8% |
| Education | 182 | 16.1% |
| Literature & Languages | 76 | 6.7% |
| Liberal Arts & History | 22 | 1.9% |
| Visual & Performing Arts | 25 | 2.2% |
| Communications | 26 | 2.3% |
| Arts & Humanities | 36 | 3.2% |
| Total | 1,134 | 100.0% |
Transportation & Commute in Turnersville
Vehicle Availability by Sex in Turnersville
The most prevalent vehicle ownership categories in Turnersville are males with 2 vehicles (397, accounting for 45.6%) and females with 2 vehicles (215, making up 50.7%).
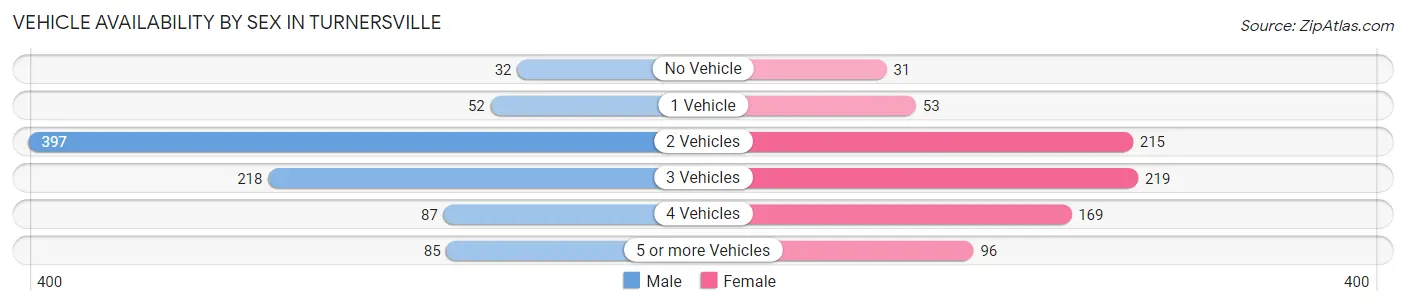
| Vehicles Available | Male | Female |
| No Vehicle | 32 (3.7%) | 31 (4.0%) |
| 1 Vehicle | 52 (6.0%) | 53 (6.8%) |
| 2 Vehicles | 397 (45.6%) | 215 (27.5%) |
| 3 Vehicles | 218 (25.0%) | 219 (28.0%) |
| 4 Vehicles | 87 (10.0%) | 169 (21.6%) |
| 5 or more Vehicles | 85 (9.8%) | 96 (12.3%) |
| Total | 871 (100.0%) | 783 (100.0%) |
Commute Time in Turnersville
The most frequently occuring commute durations in Turnersville are 60 to 89 minutes (290 commuters, 19.8%), 45 to 59 minutes (219 commuters, 14.9%), and 10 to 14 minutes (175 commuters, 11.9%).
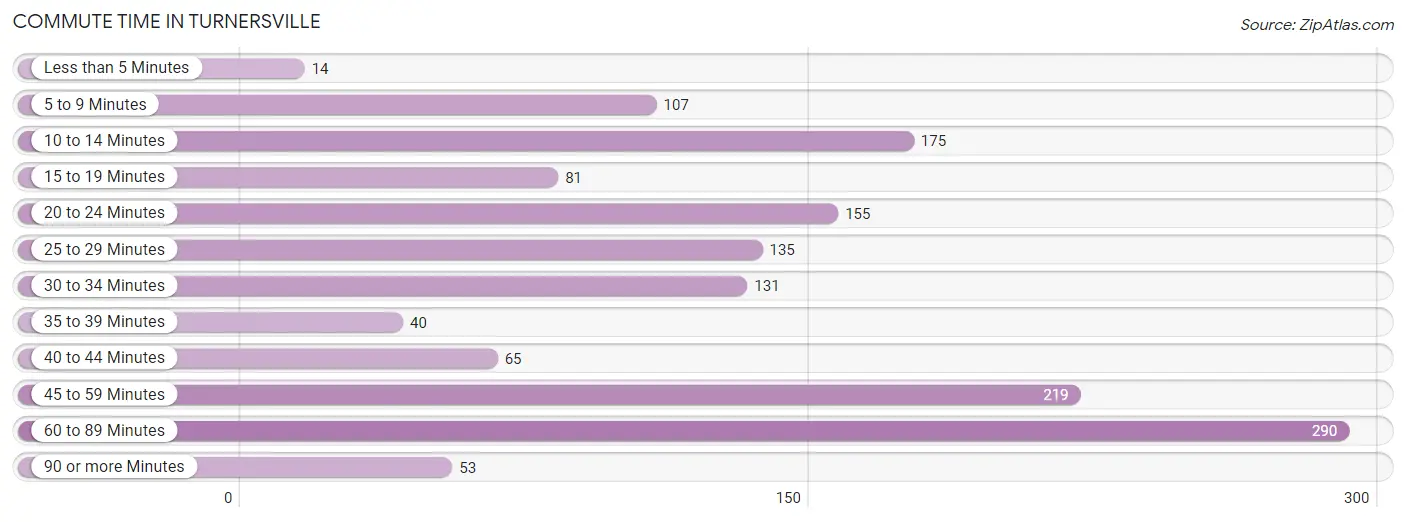
| Commute Time | # Commuters | % Commuters |
| Less than 5 Minutes | 14 | 1.0% |
| 5 to 9 Minutes | 107 | 7.3% |
| 10 to 14 Minutes | 175 | 11.9% |
| 15 to 19 Minutes | 81 | 5.5% |
| 20 to 24 Minutes | 155 | 10.6% |
| 25 to 29 Minutes | 135 | 9.2% |
| 30 to 34 Minutes | 131 | 8.9% |
| 35 to 39 Minutes | 40 | 2.7% |
| 40 to 44 Minutes | 65 | 4.4% |
| 45 to 59 Minutes | 219 | 14.9% |
| 60 to 89 Minutes | 290 | 19.8% |
| 90 or more Minutes | 53 | 3.6% |
Commute Time by Sex in Turnersville
The most common commute times in Turnersville are 45 to 59 minutes (127 commuters, 16.5%) for males and 60 to 89 minutes (206 commuters, 29.6%) for females.
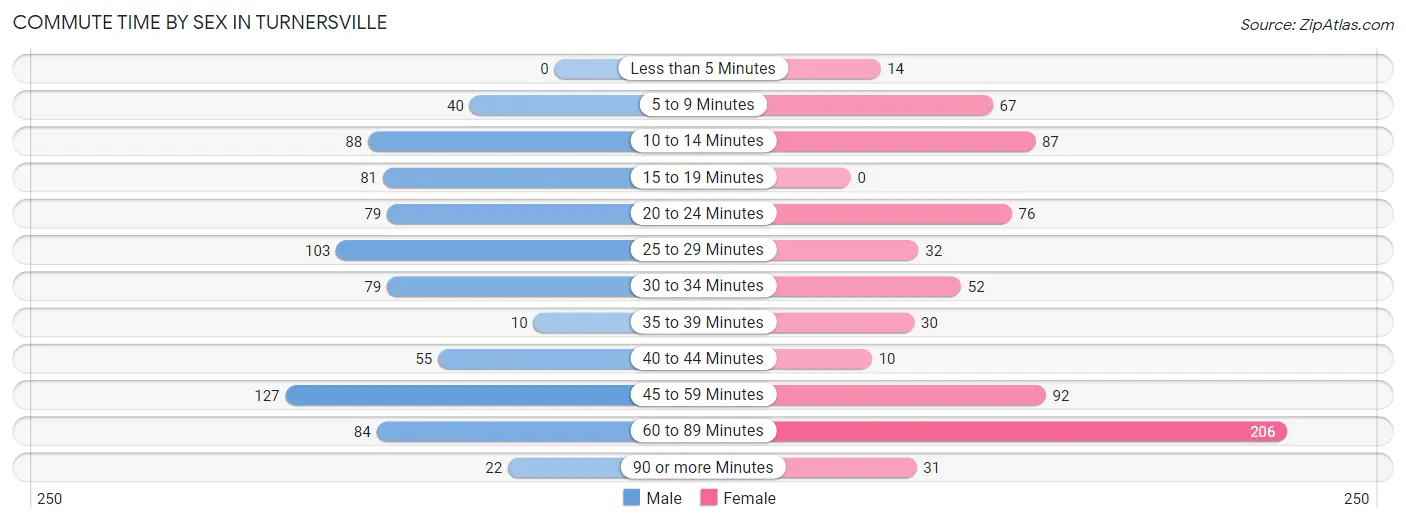
| Commute Time | Male | Female |
| Less than 5 Minutes | 0 (0.0%) | 14 (2.0%) |
| 5 to 9 Minutes | 40 (5.2%) | 67 (9.6%) |
| 10 to 14 Minutes | 88 (11.5%) | 87 (12.5%) |
| 15 to 19 Minutes | 81 (10.5%) | 0 (0.0%) |
| 20 to 24 Minutes | 79 (10.3%) | 76 (10.9%) |
| 25 to 29 Minutes | 103 (13.4%) | 32 (4.6%) |
| 30 to 34 Minutes | 79 (10.3%) | 52 (7.5%) |
| 35 to 39 Minutes | 10 (1.3%) | 30 (4.3%) |
| 40 to 44 Minutes | 55 (7.2%) | 10 (1.4%) |
| 45 to 59 Minutes | 127 (16.5%) | 92 (13.2%) |
| 60 to 89 Minutes | 84 (10.9%) | 206 (29.6%) |
| 90 or more Minutes | 22 (2.9%) | 31 (4.4%) |
Time of Departure to Work by Sex in Turnersville
The most frequent times of departure to work in Turnersville are 7:00 AM to 7:29 AM (182, 23.7%) for males and 8:00 AM to 8:29 AM (164, 23.5%) for females.
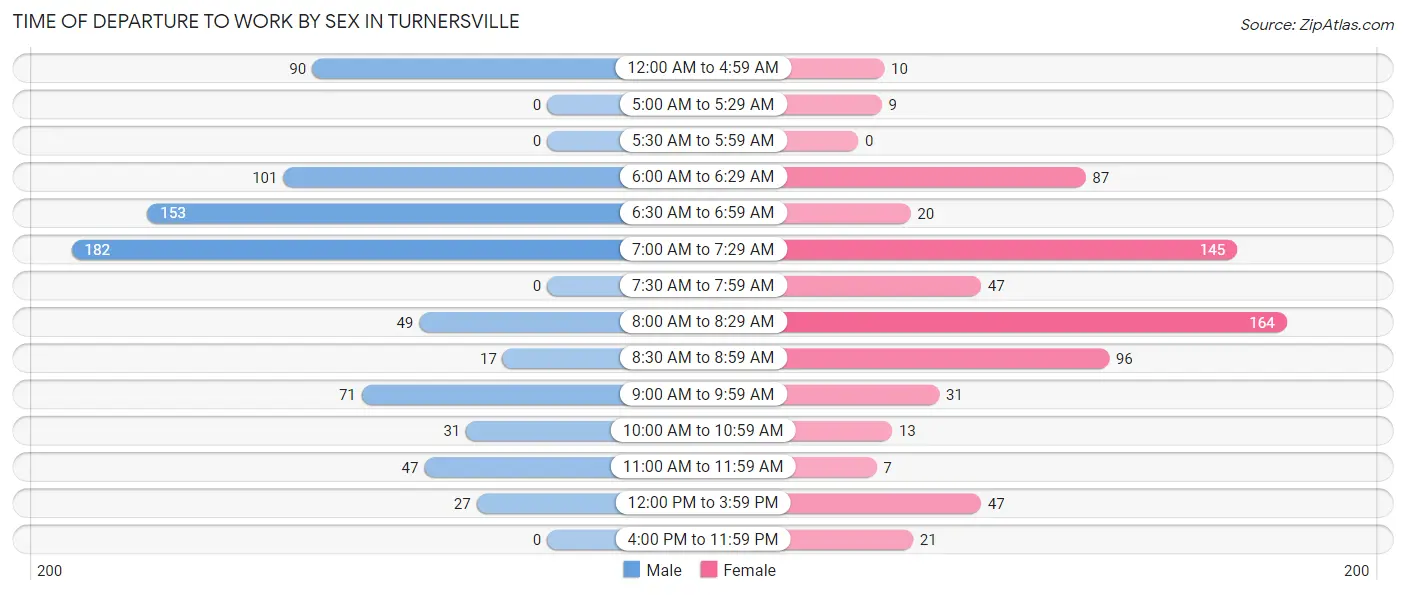
| Time of Departure | Male | Female |
| 12:00 AM to 4:59 AM | 90 (11.7%) | 10 (1.4%) |
| 5:00 AM to 5:29 AM | 0 (0.0%) | 9 (1.3%) |
| 5:30 AM to 5:59 AM | 0 (0.0%) | 0 (0.0%) |
| 6:00 AM to 6:29 AM | 101 (13.2%) | 87 (12.5%) |
| 6:30 AM to 6:59 AM | 153 (19.9%) | 20 (2.9%) |
| 7:00 AM to 7:29 AM | 182 (23.7%) | 145 (20.8%) |
| 7:30 AM to 7:59 AM | 0 (0.0%) | 47 (6.7%) |
| 8:00 AM to 8:29 AM | 49 (6.4%) | 164 (23.5%) |
| 8:30 AM to 8:59 AM | 17 (2.2%) | 96 (13.8%) |
| 9:00 AM to 9:59 AM | 71 (9.2%) | 31 (4.4%) |
| 10:00 AM to 10:59 AM | 31 (4.0%) | 13 (1.9%) |
| 11:00 AM to 11:59 AM | 47 (6.1%) | 7 (1.0%) |
| 12:00 PM to 3:59 PM | 27 (3.5%) | 47 (6.7%) |
| 4:00 PM to 11:59 PM | 0 (0.0%) | 21 (3.0%) |
| Total | 768 (100.0%) | 697 (100.0%) |
Housing Occupancy in Turnersville
Occupancy by Ownership in Turnersville
Of the total 1,055 dwellings in Turnersville, owner-occupied units account for 1,029 (97.5%), while renter-occupied units make up 26 (2.5%).
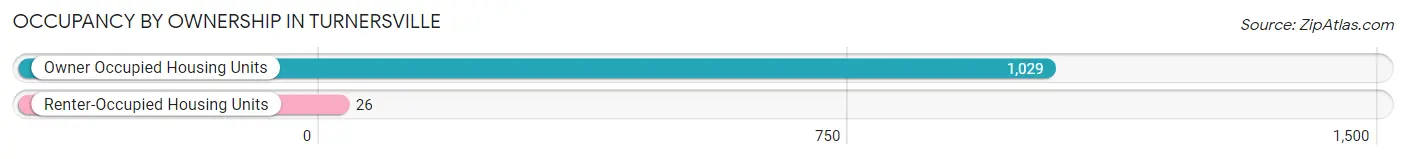
| Occupancy | # Housing Units | % Housing Units |
| Owner Occupied Housing Units | 1,029 | 97.5% |
| Renter-Occupied Housing Units | 26 | 2.5% |
| Total Occupied Housing Units | 1,055 | 100.0% |
Occupancy by Household Size in Turnersville
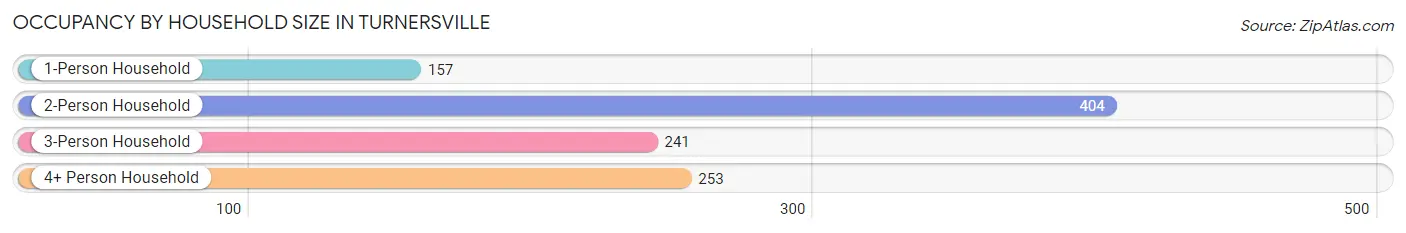
| Household Size | # Housing Units | % Housing Units |
| 1-Person Household | 157 | 14.9% |
| 2-Person Household | 404 | 38.3% |
| 3-Person Household | 241 | 22.8% |
| 4+ Person Household | 253 | 24.0% |
| Total Housing Units | 1,055 | 100.0% |
Occupancy by Ownership by Household Size in Turnersville
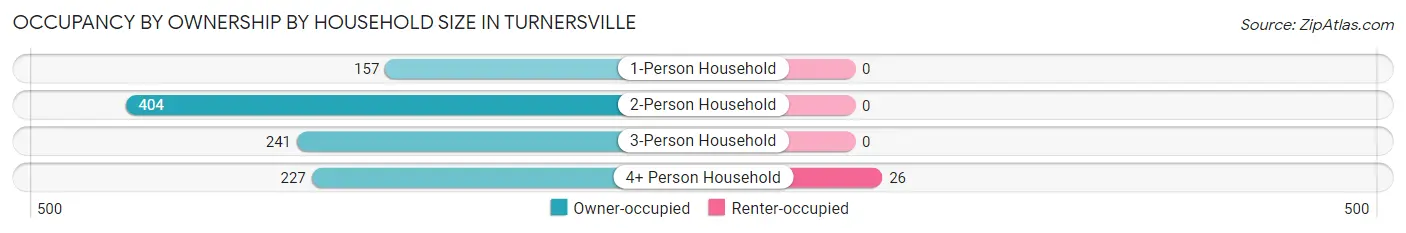
| Household Size | Owner-occupied | Renter-occupied |
| 1-Person Household | 157 (100.0%) | 0 (0.0%) |
| 2-Person Household | 404 (100.0%) | 0 (0.0%) |
| 3-Person Household | 241 (100.0%) | 0 (0.0%) |
| 4+ Person Household | 227 (89.7%) | 26 (10.3%) |
| Total Housing Units | 1,029 (97.5%) | 26 (2.5%) |
Occupancy by Educational Attainment in Turnersville
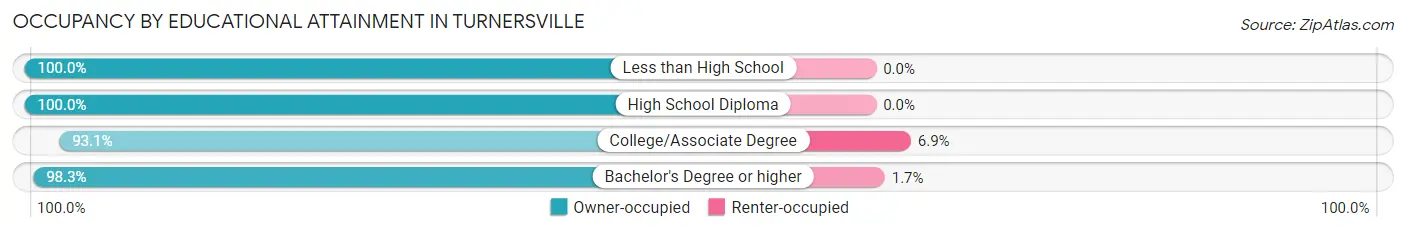
| Household Size | Owner-occupied | Renter-occupied |
| Less than High School | 14 (100.0%) | 0 (0.0%) |
| High School Diploma | 223 (100.0%) | 0 (0.0%) |
| College/Associate Degree | 217 (93.1%) | 16 (6.9%) |
| Bachelor's Degree or higher | 575 (98.3%) | 10 (1.7%) |
Occupancy by Age of Householder in Turnersville
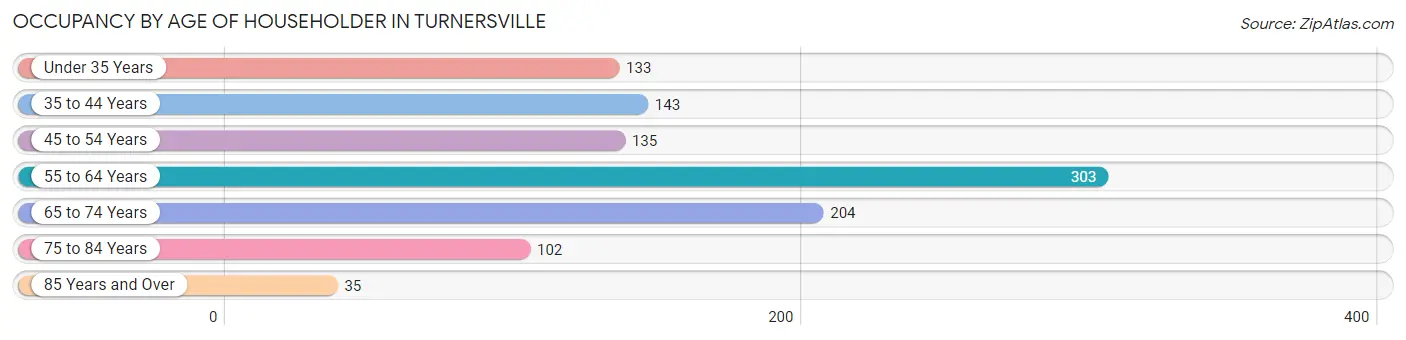
| Age Bracket | # Households | % Households |
| Under 35 Years | 133 | 12.6% |
| 35 to 44 Years | 143 | 13.6% |
| 45 to 54 Years | 135 | 12.8% |
| 55 to 64 Years | 303 | 28.7% |
| 65 to 74 Years | 204 | 19.3% |
| 75 to 84 Years | 102 | 9.7% |
| 85 Years and Over | 35 | 3.3% |
| Total | 1,055 | 100.0% |
Housing Finances in Turnersville
Median Income by Occupancy in Turnersville
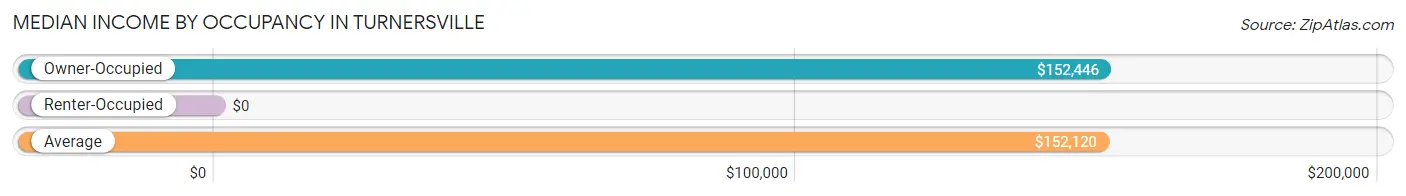
| Occupancy Type | # Households | Median Income |
| Owner-Occupied | 1,029 (97.5%) | $152,446 |
| Renter-Occupied | 26 (2.5%) | $0 |
| Average | 1,055 (100.0%) | $152,120 |
Occupancy by Householder Income Bracket in Turnersville
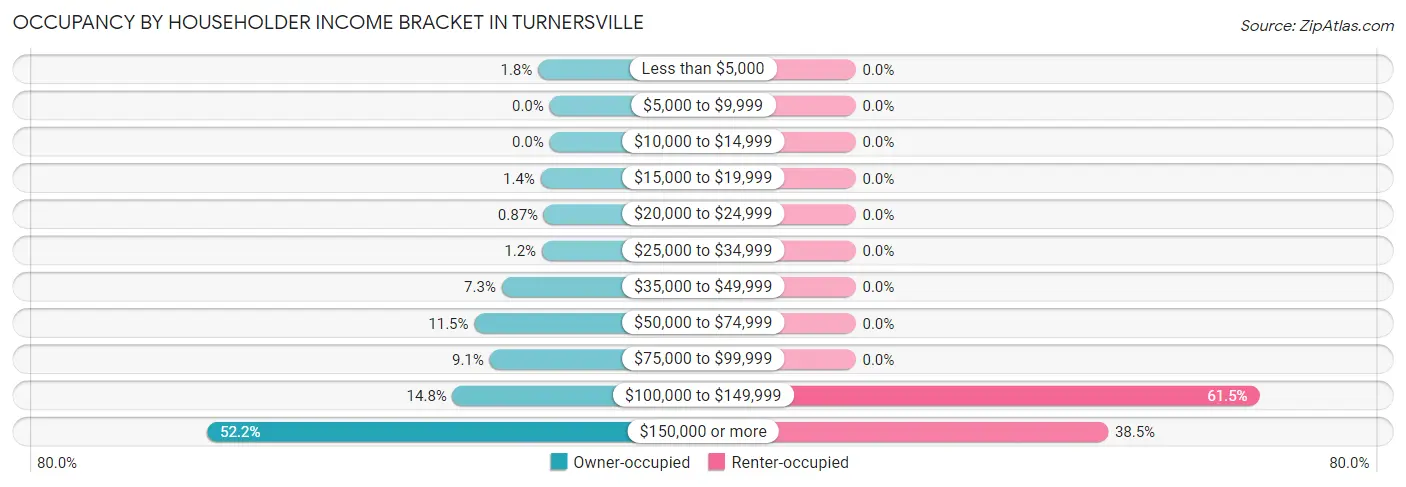
| Income Bracket | Owner-occupied | Renter-occupied |
| Less than $5,000 | 18 (1.8%) | 0 (0.0%) |
| $5,000 to $9,999 | 0 (0.0%) | 0 (0.0%) |
| $10,000 to $14,999 | 0 (0.0%) | 0 (0.0%) |
| $15,000 to $19,999 | 14 (1.4%) | 0 (0.0%) |
| $20,000 to $24,999 | 9 (0.9%) | 0 (0.0%) |
| $25,000 to $34,999 | 12 (1.2%) | 0 (0.0%) |
| $35,000 to $49,999 | 75 (7.3%) | 0 (0.0%) |
| $50,000 to $74,999 | 118 (11.5%) | 0 (0.0%) |
| $75,000 to $99,999 | 94 (9.1%) | 0 (0.0%) |
| $100,000 to $149,999 | 152 (14.8%) | 16 (61.5%) |
| $150,000 or more | 537 (52.2%) | 10 (38.5%) |
| Total | 1,029 (100.0%) | 26 (100.0%) |
Monthly Housing Cost Tiers in Turnersville
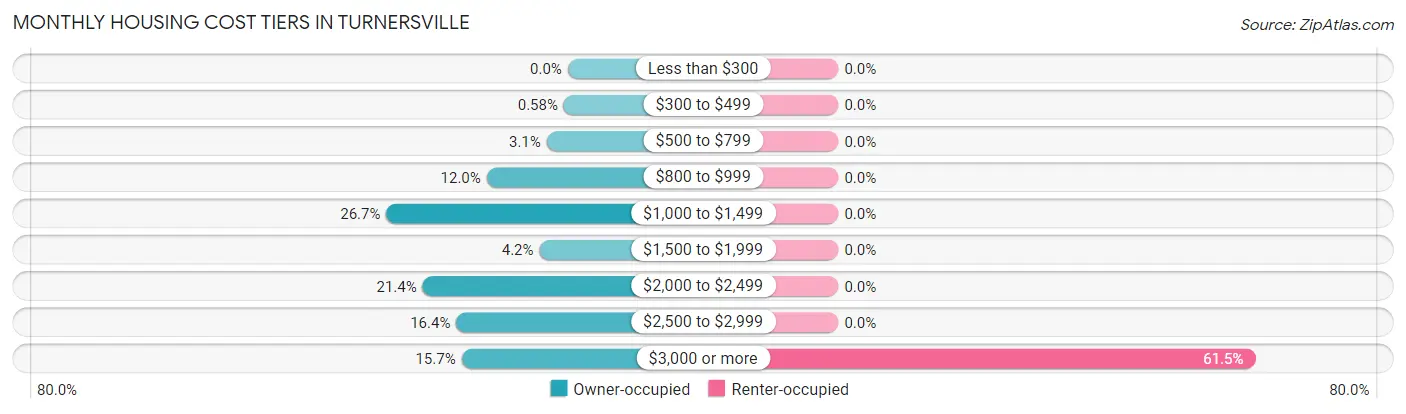
| Monthly Cost | Owner-occupied | Renter-occupied |
| Less than $300 | 0 (0.0%) | 0 (0.0%) |
| $300 to $499 | 6 (0.6%) | 0 (0.0%) |
| $500 to $799 | 32 (3.1%) | 0 (0.0%) |
| $800 to $999 | 123 (11.9%) | 0 (0.0%) |
| $1,000 to $1,499 | 275 (26.7%) | 0 (0.0%) |
| $1,500 to $1,999 | 43 (4.2%) | 0 (0.0%) |
| $2,000 to $2,499 | 220 (21.4%) | 0 (0.0%) |
| $2,500 to $2,999 | 169 (16.4%) | 0 (0.0%) |
| $3,000 or more | 161 (15.7%) | 16 (61.5%) |
| Total | 1,029 (100.0%) | 26 (100.0%) |
Physical Housing Characteristics in Turnersville
Housing Structures in Turnersville
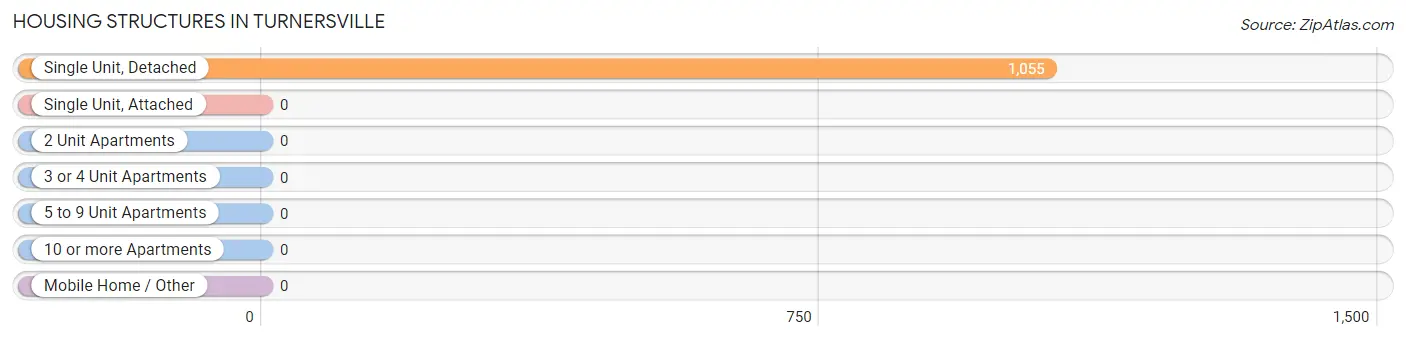
| Structure Type | # Housing Units | % Housing Units |
| Single Unit, Detached | 1,055 | 100.0% |
| Single Unit, Attached | 0 | 0.0% |
| 2 Unit Apartments | 0 | 0.0% |
| 3 or 4 Unit Apartments | 0 | 0.0% |
| 5 to 9 Unit Apartments | 0 | 0.0% |
| 10 or more Apartments | 0 | 0.0% |
| Mobile Home / Other | 0 | 0.0% |
| Total | 1,055 | 100.0% |
Housing Structures by Occupancy in Turnersville
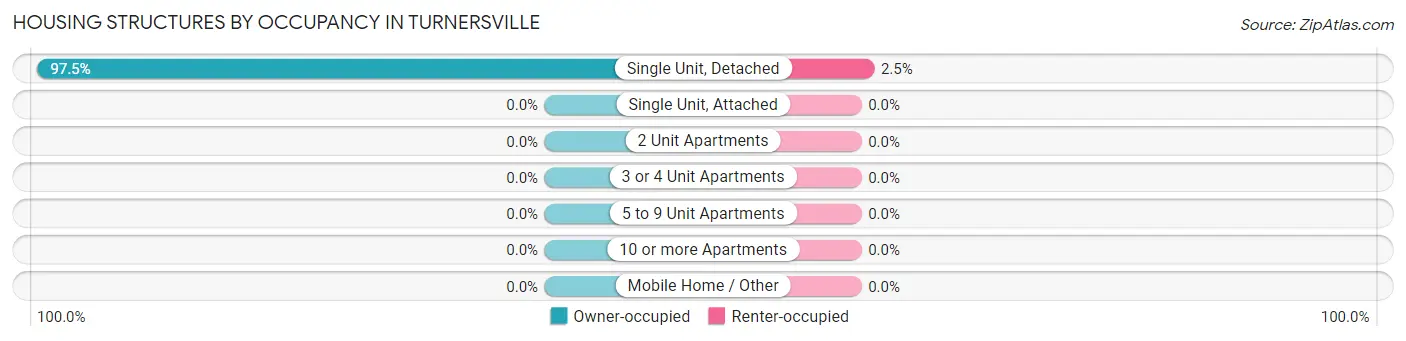
| Structure Type | Owner-occupied | Renter-occupied |
| Single Unit, Detached | 1,029 (97.5%) | 26 (2.5%) |
| Single Unit, Attached | 0 (0.0%) | 0 (0.0%) |
| 2 Unit Apartments | 0 (0.0%) | 0 (0.0%) |
| 3 or 4 Unit Apartments | 0 (0.0%) | 0 (0.0%) |
| 5 to 9 Unit Apartments | 0 (0.0%) | 0 (0.0%) |
| 10 or more Apartments | 0 (0.0%) | 0 (0.0%) |
| Mobile Home / Other | 0 (0.0%) | 0 (0.0%) |
| Total | 1,029 (97.5%) | 26 (2.5%) |
Housing Structures by Number of Rooms in Turnersville
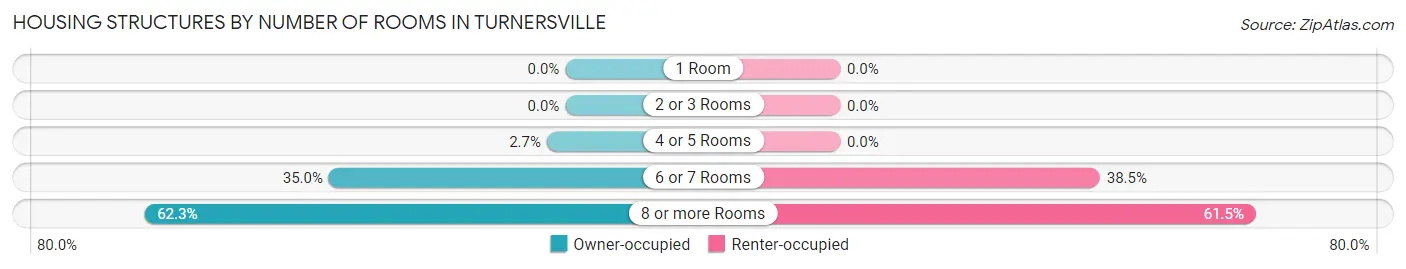
| Number of Rooms | Owner-occupied | Renter-occupied |
| 1 Room | 0 (0.0%) | 0 (0.0%) |
| 2 or 3 Rooms | 0 (0.0%) | 0 (0.0%) |
| 4 or 5 Rooms | 28 (2.7%) | 0 (0.0%) |
| 6 or 7 Rooms | 360 (35.0%) | 10 (38.5%) |
| 8 or more Rooms | 641 (62.3%) | 16 (61.5%) |
| Total | 1,029 (100.0%) | 26 (100.0%) |
Housing Structure by Heating Type in Turnersville
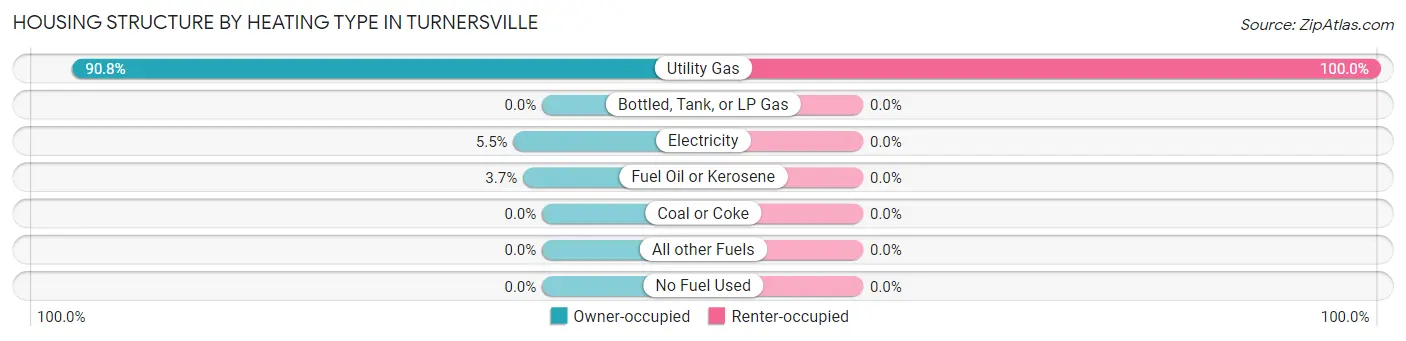
| Heating Type | Owner-occupied | Renter-occupied |
| Utility Gas | 934 (90.8%) | 26 (100.0%) |
| Bottled, Tank, or LP Gas | 0 (0.0%) | 0 (0.0%) |
| Electricity | 57 (5.5%) | 0 (0.0%) |
| Fuel Oil or Kerosene | 38 (3.7%) | 0 (0.0%) |
| Coal or Coke | 0 (0.0%) | 0 (0.0%) |
| All other Fuels | 0 (0.0%) | 0 (0.0%) |
| No Fuel Used | 0 (0.0%) | 0 (0.0%) |
| Total | 1,029 (100.0%) | 26 (100.0%) |
Household Vehicle Usage in Turnersville
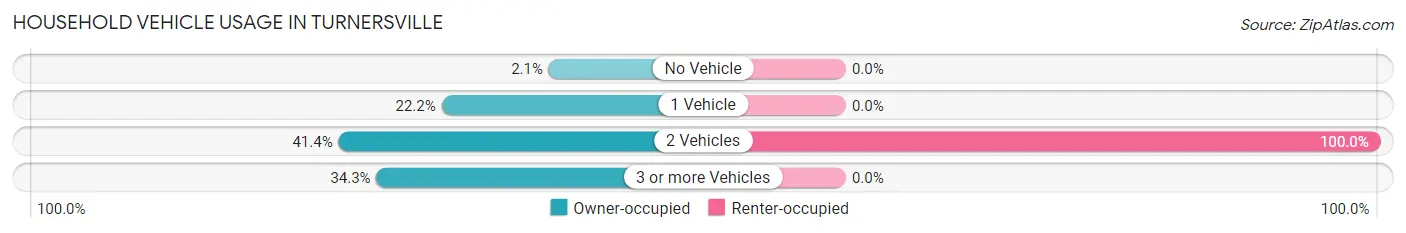
| Vehicles per Household | Owner-occupied | Renter-occupied |
| No Vehicle | 22 (2.1%) | 0 (0.0%) |
| 1 Vehicle | 228 (22.2%) | 0 (0.0%) |
| 2 Vehicles | 426 (41.4%) | 26 (100.0%) |
| 3 or more Vehicles | 353 (34.3%) | 0 (0.0%) |
| Total | 1,029 (100.0%) | 26 (100.0%) |
Real Estate & Mortgages in Turnersville
Real Estate and Mortgage Overview in Turnersville
| Characteristic | Without Mortgage | With Mortgage |
| Housing Units | 391 | 638 |
| Median Property Value | $293,100 | $331,500 |
| Median Household Income | $85,781 | $421 |
| Monthly Housing Costs | $1,070 | $161 |
| Real Estate Taxes | $8,659 | $40 |
Property Value by Mortgage Status in Turnersville
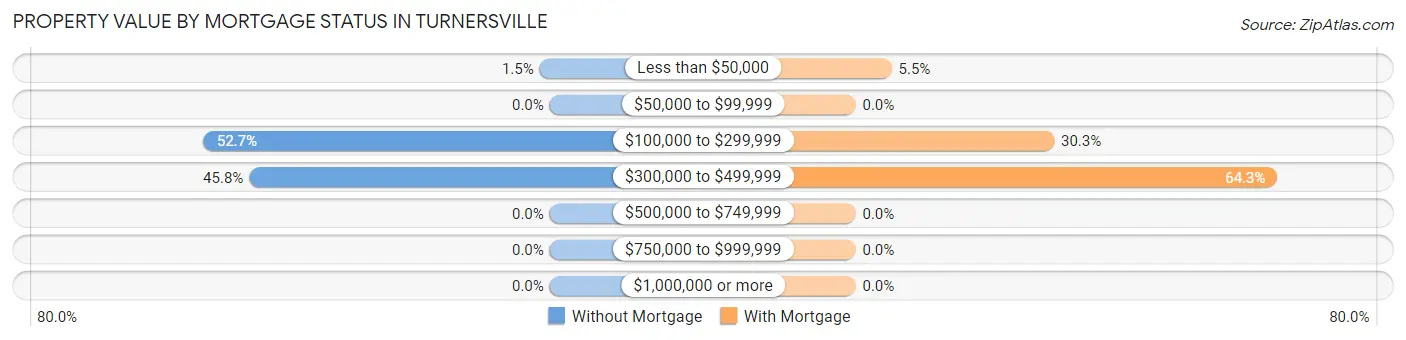
| Property Value | Without Mortgage | With Mortgage |
| Less than $50,000 | 6 (1.5%) | 35 (5.5%) |
| $50,000 to $99,999 | 0 (0.0%) | 0 (0.0%) |
| $100,000 to $299,999 | 206 (52.7%) | 193 (30.2%) |
| $300,000 to $499,999 | 179 (45.8%) | 410 (64.3%) |
| $500,000 to $749,999 | 0 (0.0%) | 0 (0.0%) |
| $750,000 to $999,999 | 0 (0.0%) | 0 (0.0%) |
| $1,000,000 or more | 0 (0.0%) | 0 (0.0%) |
| Total | 391 (100.0%) | 638 (100.0%) |
Household Income by Mortgage Status in Turnersville
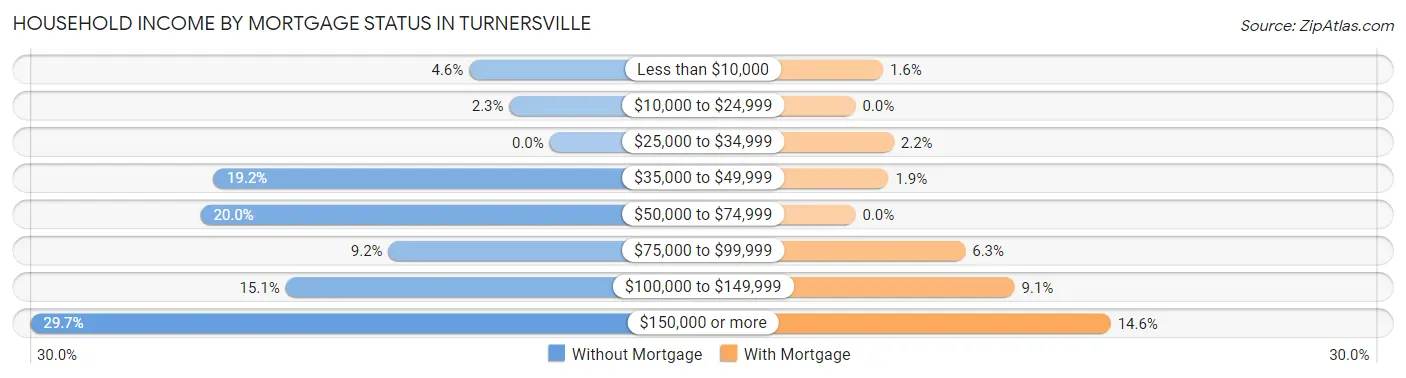
| Household Income | Without Mortgage | With Mortgage |
| Less than $10,000 | 18 (4.6%) | 10 (1.6%) |
| $10,000 to $24,999 | 9 (2.3%) | 0 (0.0%) |
| $25,000 to $34,999 | 0 (0.0%) | 14 (2.2%) |
| $35,000 to $49,999 | 75 (19.2%) | 12 (1.9%) |
| $50,000 to $74,999 | 78 (20.0%) | 0 (0.0%) |
| $75,000 to $99,999 | 36 (9.2%) | 40 (6.3%) |
| $100,000 to $149,999 | 59 (15.1%) | 58 (9.1%) |
| $150,000 or more | 116 (29.7%) | 93 (14.6%) |
| Total | 391 (100.0%) | 638 (100.0%) |
Property Value to Household Income Ratio in Turnersville
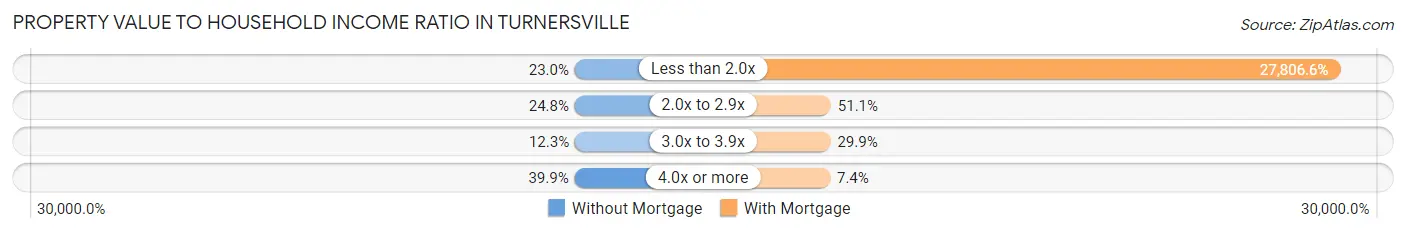
| Value-to-Income Ratio | Without Mortgage | With Mortgage |
| Less than 2.0x | 90 (23.0%) | 177,406 (27,806.6%) |
| 2.0x to 2.9x | 97 (24.8%) | 326 (51.1%) |
| 3.0x to 3.9x | 48 (12.3%) | 191 (29.9%) |
| 4.0x or more | 156 (39.9%) | 47 (7.4%) |
| Total | 391 (100.0%) | 638 (100.0%) |
Real Estate Taxes by Mortgage Status in Turnersville
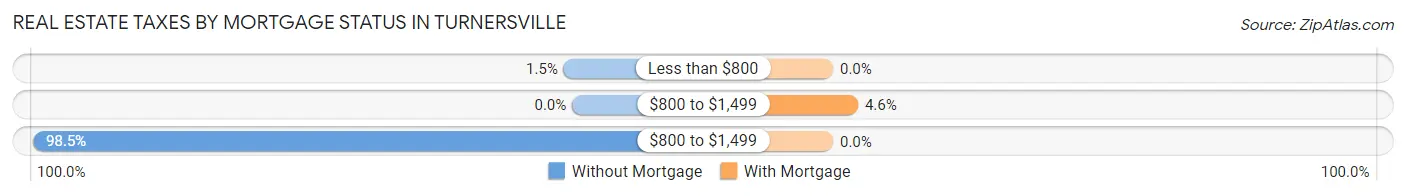
| Property Taxes | Without Mortgage | With Mortgage |
| Less than $800 | 6 (1.5%) | 0 (0.0%) |
| $800 to $1,499 | 0 (0.0%) | 29 (4.5%) |
| $800 to $1,499 | 385 (98.5%) | 0 (0.0%) |
| Total | 391 (100.0%) | 638 (100.0%) |
Health & Disability in Turnersville
Health Insurance Coverage by Age in Turnersville
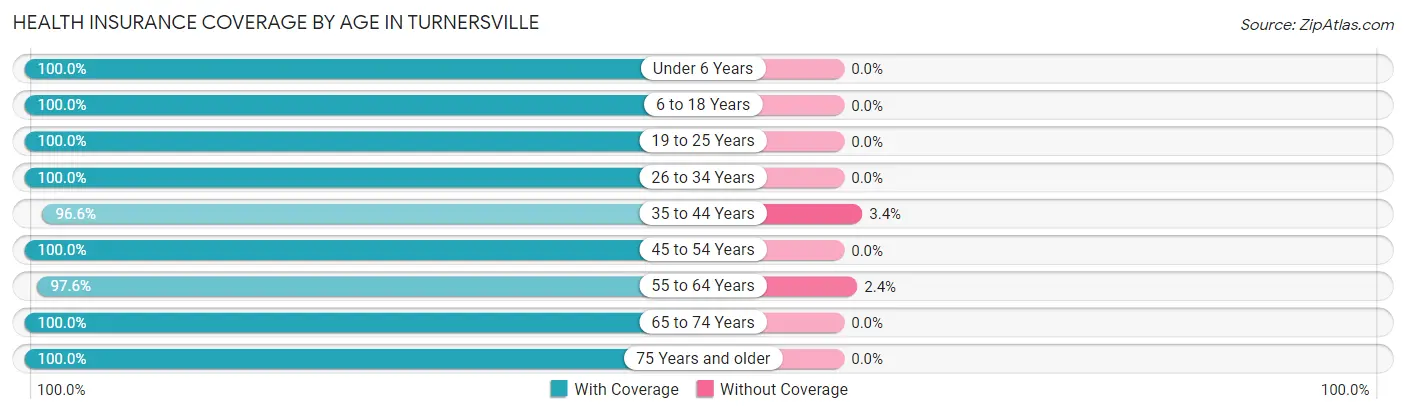
| Age Bracket | With Coverage | Without Coverage |
| Under 6 Years | 252 (100.0%) | 0 (0.0%) |
| 6 to 18 Years | 361 (100.0%) | 0 (0.0%) |
| 19 to 25 Years | 325 (100.0%) | 0 (0.0%) |
| 26 to 34 Years | 334 (100.0%) | 0 (0.0%) |
| 35 to 44 Years | 373 (96.6%) | 13 (3.4%) |
| 45 to 54 Years | 282 (100.0%) | 0 (0.0%) |
| 55 to 64 Years | 519 (97.6%) | 13 (2.4%) |
| 65 to 74 Years | 306 (100.0%) | 0 (0.0%) |
| 75 Years and older | 211 (100.0%) | 0 (0.0%) |
| Total | 2,963 (99.1%) | 26 (0.9%) |
Health Insurance Coverage by Citizenship Status in Turnersville
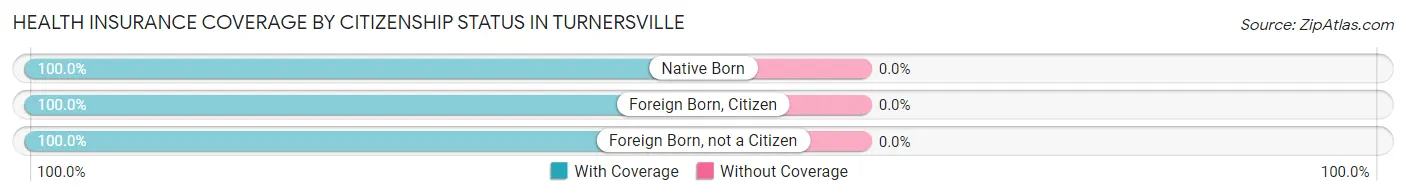
| Citizenship Status | With Coverage | Without Coverage |
| Native Born | 252 (100.0%) | 0 (0.0%) |
| Foreign Born, Citizen | 361 (100.0%) | 0 (0.0%) |
| Foreign Born, not a Citizen | 325 (100.0%) | 0 (0.0%) |
Health Insurance Coverage by Household Income in Turnersville
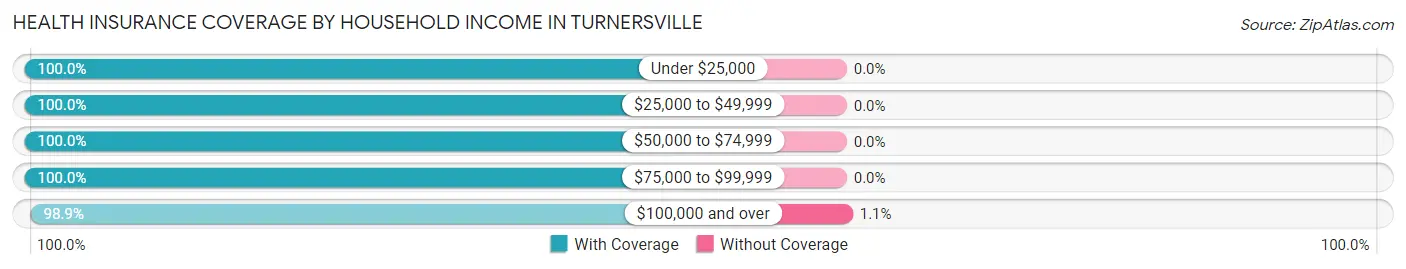
| Household Income | With Coverage | Without Coverage |
| Under $25,000 | 64 (100.0%) | 0 (0.0%) |
| $25,000 to $49,999 | 93 (100.0%) | 0 (0.0%) |
| $50,000 to $74,999 | 253 (100.0%) | 0 (0.0%) |
| $75,000 to $99,999 | 250 (100.0%) | 0 (0.0%) |
| $100,000 and over | 2,298 (98.9%) | 26 (1.1%) |
Public vs Private Health Insurance Coverage by Age in Turnersville
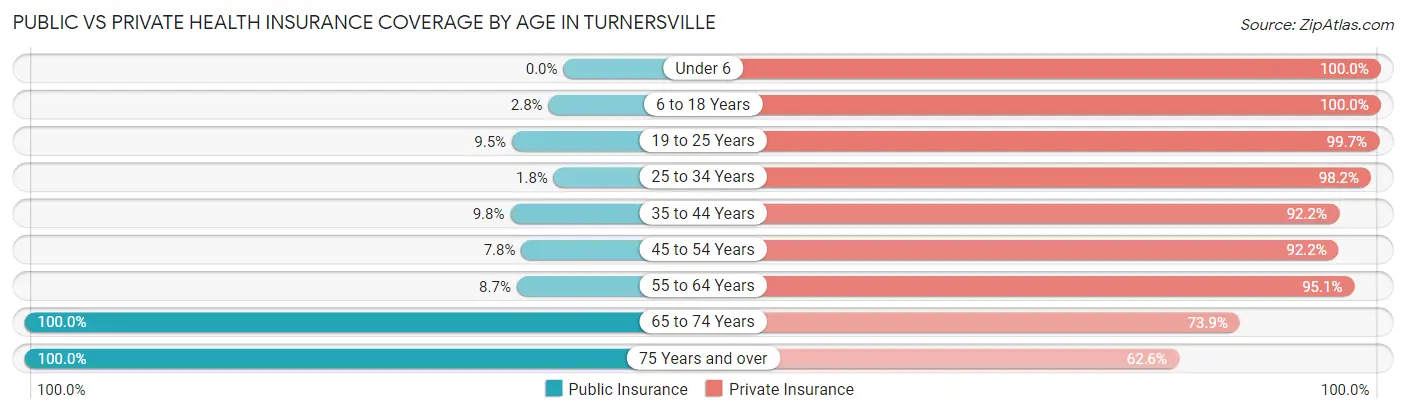
| Age Bracket | Public Insurance | Private Insurance |
| Under 6 | 0 (0.0%) | 252 (100.0%) |
| 6 to 18 Years | 10 (2.8%) | 361 (100.0%) |
| 19 to 25 Years | 31 (9.5%) | 324 (99.7%) |
| 25 to 34 Years | 6 (1.8%) | 328 (98.2%) |
| 35 to 44 Years | 38 (9.8%) | 356 (92.2%) |
| 45 to 54 Years | 22 (7.8%) | 260 (92.2%) |
| 55 to 64 Years | 46 (8.6%) | 506 (95.1%) |
| 65 to 74 Years | 306 (100.0%) | 226 (73.9%) |
| 75 Years and over | 211 (100.0%) | 132 (62.6%) |
| Total | 670 (22.4%) | 2,745 (91.8%) |
Disability Status by Sex by Age in Turnersville
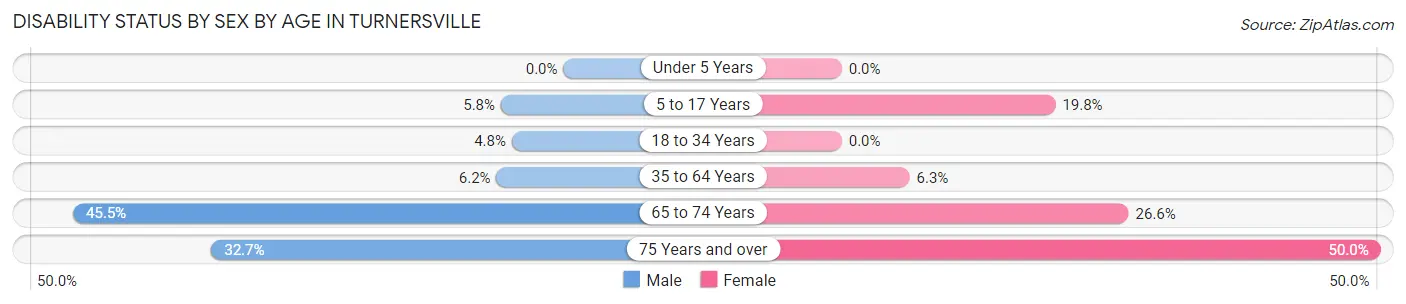
| Age Bracket | Male | Female |
| Under 5 Years | 0 (0.0%) | 0 (0.0%) |
| 5 to 17 Years | 16 (5.8%) | 24 (19.8%) |
| 18 to 34 Years | 15 (4.8%) | 0 (0.0%) |
| 35 to 64 Years | 36 (6.2%) | 39 (6.3%) |
| 65 to 74 Years | 76 (45.5%) | 37 (26.6%) |
| 75 Years and over | 33 (32.7%) | 55 (50.0%) |
Disability Class by Sex by Age in Turnersville
Disability Class: Hearing Difficulty
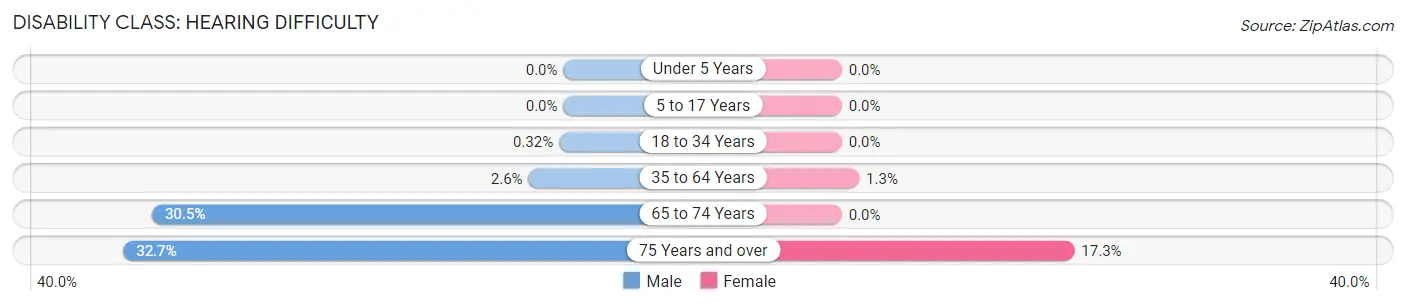
| Age Bracket | Male | Female |
| Under 5 Years | 0 (0.0%) | 0 (0.0%) |
| 5 to 17 Years | 0 (0.0%) | 0 (0.0%) |
| 18 to 34 Years | 1 (0.3%) | 0 (0.0%) |
| 35 to 64 Years | 15 (2.6%) | 8 (1.3%) |
| 65 to 74 Years | 51 (30.5%) | 0 (0.0%) |
| 75 Years and over | 33 (32.7%) | 19 (17.3%) |
Disability Class: Vision Difficulty
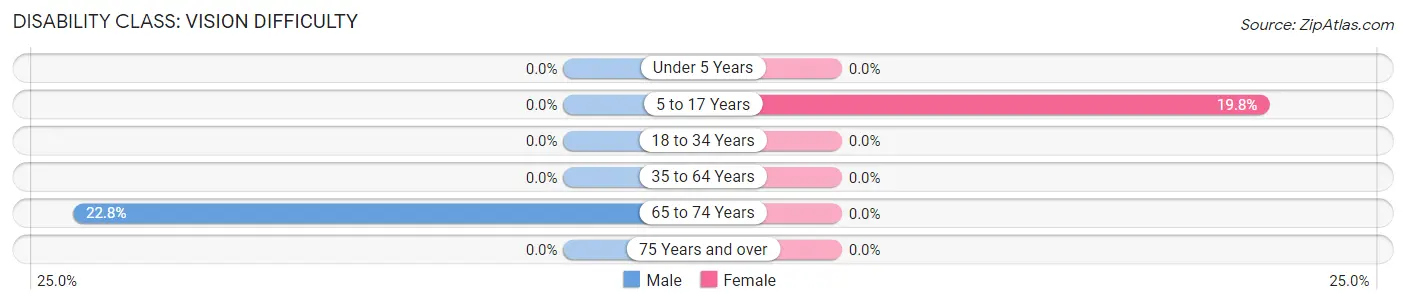
| Age Bracket | Male | Female |
| Under 5 Years | 0 (0.0%) | 0 (0.0%) |
| 5 to 17 Years | 0 (0.0%) | 24 (19.8%) |
| 18 to 34 Years | 0 (0.0%) | 0 (0.0%) |
| 35 to 64 Years | 0 (0.0%) | 0 (0.0%) |
| 65 to 74 Years | 38 (22.8%) | 0 (0.0%) |
| 75 Years and over | 0 (0.0%) | 0 (0.0%) |
Disability Class: Cognitive Difficulty
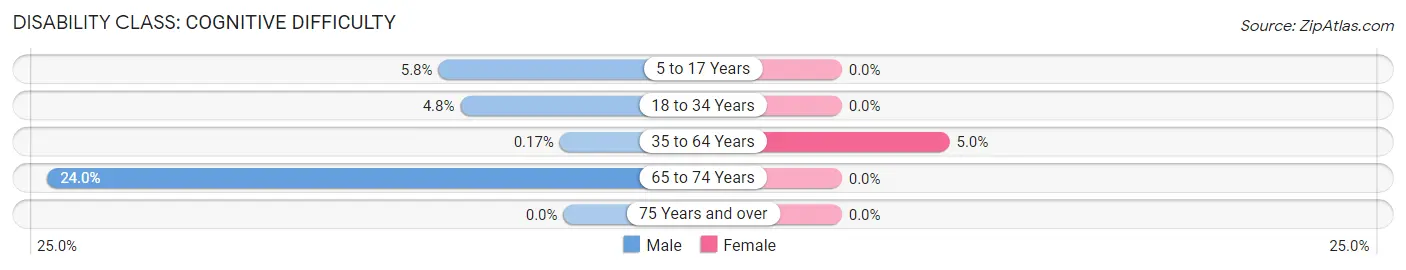
| Age Bracket | Male | Female |
| 5 to 17 Years | 16 (5.8%) | 0 (0.0%) |
| 18 to 34 Years | 15 (4.8%) | 0 (0.0%) |
| 35 to 64 Years | 1 (0.2%) | 31 (5.0%) |
| 65 to 74 Years | 40 (23.9%) | 0 (0.0%) |
| 75 Years and over | 0 (0.0%) | 0 (0.0%) |
Disability Class: Ambulatory Difficulty
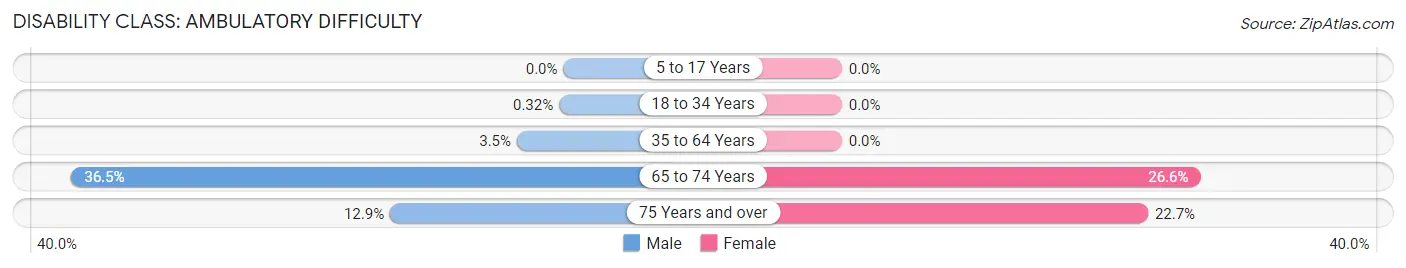
| Age Bracket | Male | Female |
| 5 to 17 Years | 0 (0.0%) | 0 (0.0%) |
| 18 to 34 Years | 1 (0.3%) | 0 (0.0%) |
| 35 to 64 Years | 20 (3.5%) | 0 (0.0%) |
| 65 to 74 Years | 61 (36.5%) | 37 (26.6%) |
| 75 Years and over | 13 (12.9%) | 25 (22.7%) |
Disability Class: Self-Care Difficulty
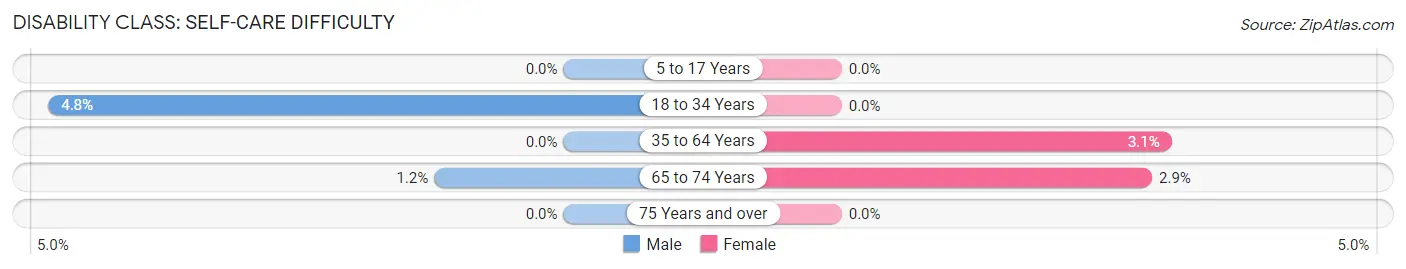
| Age Bracket | Male | Female |
| 5 to 17 Years | 0 (0.0%) | 0 (0.0%) |
| 18 to 34 Years | 15 (4.8%) | 0 (0.0%) |
| 35 to 64 Years | 0 (0.0%) | 19 (3.1%) |
| 65 to 74 Years | 2 (1.2%) | 4 (2.9%) |
| 75 Years and over | 0 (0.0%) | 0 (0.0%) |
Technology Access in Turnersville
Computing Device Access in Turnersville
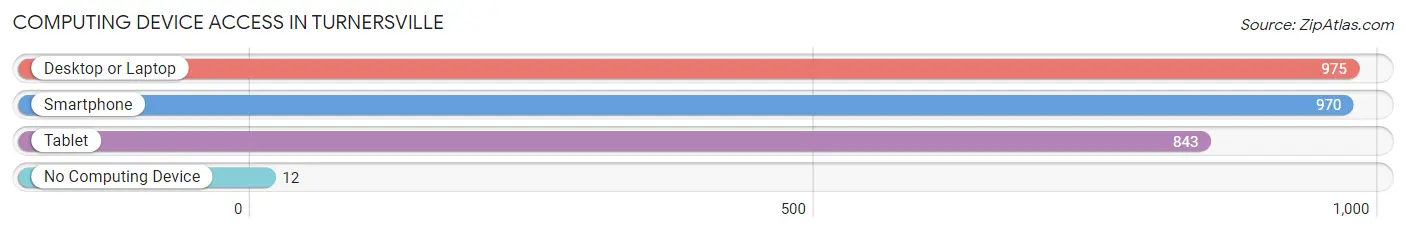
| Device Type | # Households | % Households |
| Desktop or Laptop | 975 | 92.4% |
| Smartphone | 970 | 91.9% |
| Tablet | 843 | 79.9% |
| No Computing Device | 12 | 1.1% |
| Total | 1,055 | 100.0% |
Internet Access in Turnersville
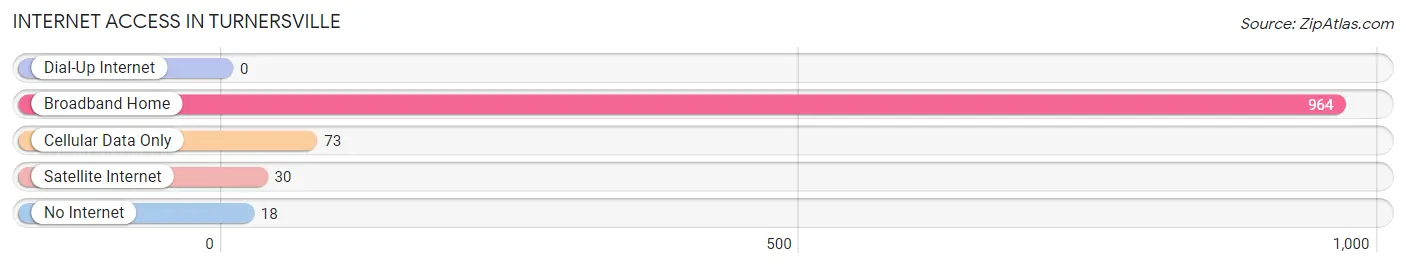
| Internet Type | # Households | % Households |
| Dial-Up Internet | 0 | 0.0% |
| Broadband Home | 964 | 91.4% |
| Cellular Data Only | 73 | 6.9% |
| Satellite Internet | 30 | 2.8% |
| No Internet | 18 | 1.7% |
| Total | 1,055 | 100.0% |
Turnersville Summary
Turnersville is a census-designated place (CDP) located in Washington Township, Gloucester County, New Jersey, United States. As of the 2010 United States Census, the CDP's population was 8,347.
History
The area now known as Turnersville was originally inhabited by the Lenni Lenape Native Americans. The first European settlers arrived in the area in the late 17th century. The area was originally known as “Turner’s Crossroads”, named after the Turner family who owned a large amount of land in the area. The Turners were Quakers who had emigrated from England in the 1680s. The area was officially incorporated as the Township of Washington in 1836.
Geography
Turnersville is located at 39°47'17" North, 75°3'25" West (39.7881, -75.0569). According to the United States Census Bureau, the CDP has a total area of 4.3 square miles, all of which is land.
Economy
Turnersville is home to a variety of businesses, including retail stores, restaurants, and professional services. The area is also home to a number of industrial and manufacturing businesses. The most prominent employer in the area is the Turnersville Auto Mall, which is the largest auto mall in the state of New Jersey.
Demographics
As of the 2010 United States Census, there were 8,347 people, 3,093 households, and 2,092 families residing in the CDP. The population density was 1,937.2 per square mile. The racial makeup of the CDP was 87.2% White, 5.2% African American, 0.2% Native American, 4.2% Asian, 0.1% Pacific Islander, 1.3% from other races, and 1.9% from two or more races. Hispanic or Latino of any race were 5.2% of the population.
The median income for a household in the CDP was $68,958, and the median income for a family was $76,944. Males had a median income of $51,919 versus $41,919 for females. The per capita income for the CDP was $29,945. About 3.2% of families and 4.3% of the population were below the poverty line, including 5.2% of those under age 18 and 4.2% of those age 65 or over.
Common Questions
What is Per Capita Income in Turnersville?
Per Capita income in Turnersville is $58,927.
What is the Median Family Income in Turnersville?
Median Family Income in Turnersville is $175,142.
What is the Median Household income in Turnersville?
Median Household Income in Turnersville is $152,120.
What is Income or Wage Gap in Turnersville?
Income or Wage Gap in Turnersville is 33.6%.
Women in Turnersville earn 66.4 cents for every dollar earned by a man.
What is Inequality or Gini Index in Turnersville?
Inequality or Gini Index in Turnersville is 0.36.
What is the Total Population of Turnersville?
Total Population of Turnersville is 2,989.
What is the Total Male Population of Turnersville?
Total Male Population of Turnersville is 1,534.
What is the Total Female Population of Turnersville?
Total Female Population of Turnersville is 1,455.
What is the Ratio of Males per 100 Females in Turnersville?
There are 105.43 Males per 100 Females in Turnersville.
What is the Ratio of Females per 100 Males in Turnersville?
There are 94.85 Females per 100 Males in Turnersville.
What is the Median Population Age in Turnersville?
Median Population Age in Turnersville is 43.0 Years.
What is the Average Family Size in Turnersville
Average Family Size in Turnersville is 3.2 People.
What is the Average Household Size in Turnersville
Average Household Size in Turnersville is 2.8 People.
How Large is the Labor Force in Turnersville?
There are 1,749 People in the Labor Forcein in Turnersville.
What is the Percentage of People in the Labor Force in Turnersville?
70.4% of People are in the Labor Force in Turnersville.
What is the Unemployment Rate in Turnersville?
Unemployment Rate in Turnersville is 4.1%.