Cities with the Most Immigrants from South Africa in Arizona
RELATED REPORTS & OPTIONS
South Africa
Arizona
Compare Cities
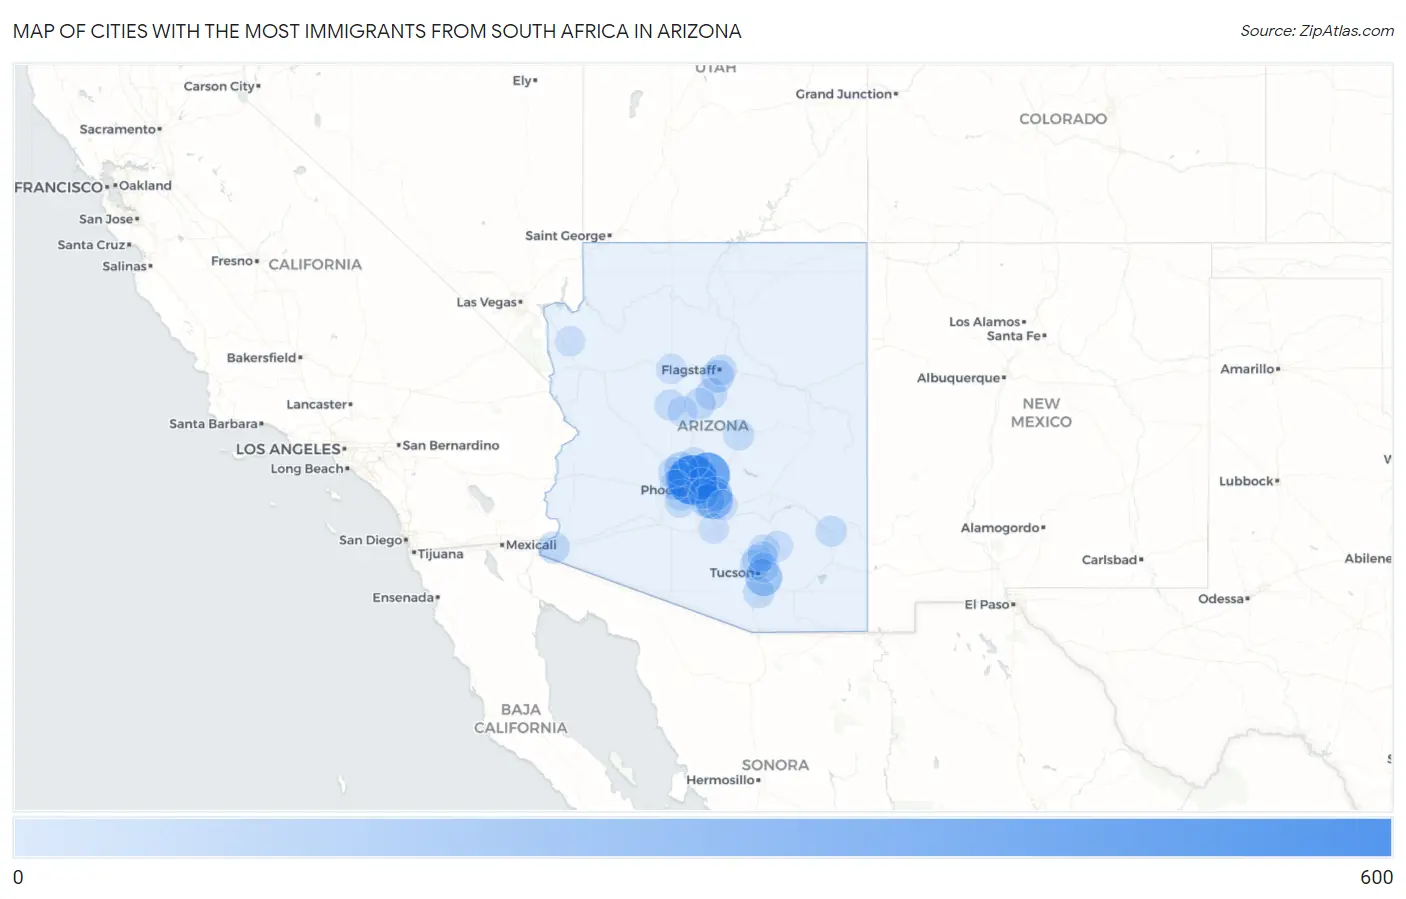
Map of Cities with the Most Immigrants from South Africa in Arizona
0
600
Cities with the Most Immigrants from South Africa in Arizona
| City | South Africa | vs State | vs National | |
| 1. | Phoenix | 568 | 2,667(21.30%)#1 | 117,055(0.49%)#14 |
| 2. | Scottsdale | 425 | 2,667(15.94%)#2 | 117,055(0.36%)#20 |
| 3. | Gilbert | 234 | 2,667(8.77%)#3 | 117,055(0.20%)#56 |
| 4. | Tucson | 194 | 2,667(7.27%)#4 | 117,055(0.17%)#69 |
| 5. | Glendale | 117 | 2,667(4.39%)#5 | 117,055(0.10%)#137 |
| 6. | Mesa | 115 | 2,667(4.31%)#6 | 117,055(0.10%)#142 |
| 7. | Chandler | 106 | 2,667(3.97%)#7 | 117,055(0.09%)#159 |
| 8. | Peoria | 104 | 2,667(3.90%)#8 | 117,055(0.09%)#166 |
| 9. | Kachina Village | 76 | 2,667(2.85%)#9 | 117,055(0.06%)#276 |
| 10. | Paradise Valley | 59 | 2,667(2.21%)#10 | 117,055(0.05%)#375 |
| 11. | Yuma | 48 | 2,667(1.80%)#11 | 117,055(0.04%)#463 |
| 12. | Sedona | 46 | 2,667(1.72%)#12 | 117,055(0.04%)#490 |
| 13. | Surprise | 39 | 2,667(1.46%)#13 | 117,055(0.03%)#568 |
| 14. | Cottonwood | 39 | 2,667(1.46%)#14 | 117,055(0.03%)#580 |
| 15. | Sahuarita | 32 | 2,667(1.20%)#15 | 117,055(0.03%)#698 |
| 16. | Payson | 29 | 2,667(1.09%)#16 | 117,055(0.02%)#762 |
| 17. | Saddlebrooke | 29 | 2,667(1.09%)#17 | 117,055(0.02%)#766 |
| 18. | Safford | 28 | 2,667(1.05%)#18 | 117,055(0.02%)#784 |
| 19. | Williamson | 28 | 2,667(1.05%)#19 | 117,055(0.02%)#786 |
| 20. | Casas Adobes | 26 | 2,667(0.97%)#20 | 117,055(0.02%)#814 |
| 21. | Avondale | 25 | 2,667(0.94%)#21 | 117,055(0.02%)#838 |
| 22. | Kaibab Estates West | 25 | 2,667(0.94%)#22 | 117,055(0.02%)#856 |
| 23. | Flagstaff | 23 | 2,667(0.86%)#23 | 117,055(0.02%)#889 |
| 24. | San Manuel | 22 | 2,667(0.82%)#24 | 117,055(0.02%)#925 |
| 25. | Anthem | 17 | 2,667(0.64%)#25 | 117,055(0.01%)#1,091 |
| 26. | Goodyear | 16 | 2,667(0.60%)#26 | 117,055(0.01%)#1,115 |
| 27. | Oro Valley | 16 | 2,667(0.60%)#27 | 117,055(0.01%)#1,123 |
| 28. | Tempe | 13 | 2,667(0.49%)#28 | 117,055(0.01%)#1,267 |
| 29. | Ash Fork | 13 | 2,667(0.49%)#29 | 117,055(0.01%)#1,330 |
| 30. | Prescott Valley | 12 | 2,667(0.45%)#30 | 117,055(0.01%)#1,337 |
| 31. | Catalina | 12 | 2,667(0.45%)#31 | 117,055(0.01%)#1,366 |
| 32. | Citrus Park | 12 | 2,667(0.45%)#32 | 117,055(0.01%)#1,369 |
| 33. | Casa Grande | 8 | 2,667(0.30%)#33 | 117,055(0.01%)#1,568 |
| 34. | Queen Creek | 5 | 2,667(0.19%)#34 | 117,055(0.00%)#1,762 |
| 35. | Catalina Foothills | 4 | 2,667(0.15%)#35 | 117,055(0.00%)#1,828 |
| 36. | Dolan Springs | 4 | 2,667(0.15%)#36 | 117,055(0.00%)#1,876 |
Common Questions
What are the Top 10 Cities with the Most Immigrants from South Africa in Arizona?
Top 10 Cities with the Most Immigrants from South Africa in Arizona are:
#1
568
#2
425
#3
234
#4
194
#5
117
#6
115
#7
106
#8
104
#9
76
#10
59
What city has the Most Immigrants from South Africa in Arizona?
Phoenix has the Most Immigrants from South Africa in Arizona with 568.
What is the Total Immigrants from South Africa in the State of Arizona?
Total Immigrants from South Africa in Arizona is 2,667.
What is the Total Immigrants from South Africa in the United States?
Total Immigrants from South Africa in the United States is 117,055.