Zip Codes with the Most Immigrants from South Africa in San Rafael, CA
On this page
RELATED REPORTS & OPTIONS
South Africa
Population
Highest PopulationHighest Population DensityLowest Population DensityMale / Female RatioFemale / Male RatioOldest PopulationOldest Population | MaleOldest Population | FemaleYoungest PopulationYoungest Population | MaleYoungest Population | Female
Families and Households
Largest Family SizeLargest Household SizeMost Single FathersMost Single MothersFewest Single FathersFewest Single MothersSmallest Family SizeSmallest Household Size
Female Fertility
Highest Birth Rate | All WomenHighest Birth Rate | Women 35+Highest Birth Rate | Below PovertyHighest Birth Rate | Public IncomeHighest Birth Rate | In Labor ForceLowest Birth Rate | All WomenLowest Birth Rate | Women 35+Lowest Birth Rate | Below PovertyLowest Birth Rate | Public IncomeLowest Birth Rate | In Labor Force
Female Fertility (Unmarried)
Highest Illegitimacy | All WomenHighest Illegitimacy | Women 35+Lowest Illegitimacy | All WomenLowest Illegitimacy | Women 35+
Race (Community Size)
Race (Percentage)
Ancestry (Community Size)
AfricanAmericanArabArgentineanArmenianAustralianAustrianBasqueBelgianBhutaneseBlackfeetBolivianBrazilianBritishBurmeseCanadianCentral AmericanChileanColombianCroatianCubanCzechCzechoslovakianDanishDutchEastern EuropeanEcuadorianEgyptianEnglishEuropeanFinnishFrenchFrench CanadianGermanGreekGuatemalanHonduranHungarianIcelanderIndian (Asian)IranianIrishItalianJapaneseKoreanLebaneseLithuanianMexicanMexican American IndianMongolianNative HawaiianNicaraguanNigerianNorthern EuropeanNorwegianPakistaniPalestinianPeruvianPolishPortuguesePuerto RicanRomanianRussianSalvadoranScandinavianScotch-IrishScottishSerbianSlovakSouth AmericanSpaniardSpanishSri LankanSubsaharan AfricanSwedishSwissSyrianThaiTurkishUkrainianWelsh
Ancestry (Percentage)
AfricanAmericanArabArgentineanArmenianAustralianAustrianBasqueBelgianBhutaneseBlackfeetBolivianBrazilianBritishBurmeseCanadianCentral AmericanChileanColombianCroatianCubanCzechCzechoslovakianDanishDutchEastern EuropeanEcuadorianEgyptianEnglishEuropeanFinnishFrenchFrench CanadianGermanGreekGuatemalanHonduranHungarianIcelanderIndian (Asian)IranianIrishItalianJapaneseKoreanLebaneseLithuanianMexicanMexican American IndianMongolianNative HawaiianNicaraguanNigerianNorthern EuropeanNorwegianPakistaniPalestinianPeruvianPolishPortuguesePuerto RicanRomanianRussianSalvadoranScandinavianScotch-IrishScottishSerbianSlovakSouth AmericanSpaniardSpanishSri LankanSubsaharan AfricanSwedishSwissSyrianThaiTurkishUkrainianWelsh
Immigrant Origin (Total)
AfricaArgentinaAsiaAustraliaAustriaBelarusBoliviaBrazilCanadaCaribbeanCentral AmericaChinaColombiaCubaDenmarkEastern AfricaEastern AsiaEastern EuropeEgyptEl SalvadorEnglandEuropeFijiFranceGermanyGreeceGuatemalaHondurasHong KongIndiaIranIrelandIsraelItalyJapanKenyaKoreaLatin AmericaMexicoNetherlandsNicaraguaNorthern AfricaNorthern EuropeOceaniaPeruPhilippinesPortugalRomaniaRussiaScotlandSouth AfricaSouth AmericaSouth Central AsiaSouth Eastern AsiaSouthern EuropeSpainSwedenSwitzerlandTaiwanThailandVietnamWestern AfricaWestern AsiaWestern Europe
Immigrant Origin (Percentage)
AfricaArgentinaAsiaAustraliaAustriaBelarusBoliviaBrazilCanadaCaribbeanCentral AmericaChinaColombiaCubaDenmarkEastern AfricaEastern AsiaEastern EuropeEgyptEl SalvadorEnglandEuropeFijiFranceGermanyGreeceGuatemalaHondurasHong KongIndiaIranIrelandIsraelItalyJapanKenyaKoreaLatin AmericaMexicoNetherlandsNicaraguaNorthern AfricaNorthern EuropeOceaniaPeruPhilippinesPortugalRomaniaRussiaScotlandSouth AfricaSouth AmericaSouth Central AsiaSouth Eastern AsiaSouthern EuropeSpainSwedenSwitzerlandTaiwanThailandVietnamWestern AfricaWestern AsiaWestern Europe
Income
Highest Per Capita IncomeHighest Earnings | MaleHighest Earnings | FemaleHighest Wage/Income Gap ($)Highest Wage/Income Gap (%)Highest Inequality / Gini IndexLowest Per Capita IncomeLowest Earnings | MaleLowest Earnings | FemaleLowest Wage/Income Gap ($)Lowest Wage/Income Gap (%)Lowest Inequality / Gini Index
Income (Families)
Highest Family IncomeLowest Family IncomeFamily Income | $0-10kFamily Income | $100k+Family Income | $200k+
Income (Households)
Highest Household IncomeLowest Household IncomeHousehold Income | $0-10kHousehold Income | $200k+Household Income | $100k+
Poverty
Highest PovertyHighest Poverty | MaleHighest Poverty | FemaleHighest Poverty | Female 18-24Highest Poverty | Female 25-34Highest Poverty | Child 0-5Highest Poverty | Child 0-16Highest Poverty | Boys 0-16Highest Poverty | Girls 0-16Highest Poverty | Seniors 65+Highest Poverty | Seniors 75+ Lowest PovertyLowest Poverty | MaleLowest Poverty | FemaleLowest Poverty | Child 0-5Lowest Poverty | Child 0-16Lowest Poverty | Boys 0-16Lowest Poverty | Girls 0-16Lowest Poverty | Seniors 65+Lowest Poverty | Seniors 75+
Poverty (Families)
Highest Family PovertyHighest Poverty | Married CoupleHighest Poverty | Single MaleHighest Poverty | Single FemaleHighest Poverty | Single FatherLowest Family PovertyLowest Poverty | Married CoupleLowest Poverty | Single MaleLowest Poverty | Single FemaleLowest Poverty | Single Father
Unemployment
Highest UnemploymentHighest Unemployment | MaleHighest Unemployment | FemaleHighest Unemployment | Youth < 25Highest Unemployment | Senior > 65Lowest UnemploymentLowest Unemployment | MaleLowest Unemployment | FemaleLowest Unemployment | Youth < 25Lowest Unemployment | Senior > 65
Employment Occupations
Architecture & EngineeringArts, Media & EntertainmentBusiness & FinancialCleaning & MaintenanceCommunity & Social Service Computer & MathematicsComputer, Engineering & ScienceConstruction & ExtractionEducation Instruction & LibraryEducation, Arts & MediaFarming, Fishing & ForestryFirefighting & PreventionFood Preparation & ServingHealth Diagnosing & TreatingHealth TechnologistsHealthcare SupportInstallation, Maintenance & RepairLaw EnforcementLegal Services & SupportLife, Physical & Social ScienceManagementMaterial MovingOffice & AdministrationPersonal Care and ServiceProductionSales & RelatedSecurity & ProtectionTransportation
Employment Industries
Accommodation & Food ServicesAdministrative & Support ServicesAgriculture, Fishing & HuntingArts, Entertainment & RecreationConstructionEducational ServicesFinance & InsuranceHealth Care & Social AssistanceInformation & TechnologyManufacturingProfessional & Scientific ServicesPublic AdministrationReal Estate, Rental & LeasingRetail TradeTransportation & WarehousingUtilitiesWholesale Trade
Employer Class
Private Company EmployeesSelf-Employed / IncorporatedSelf-Employed / Not IncorporatedNot-for-profit OrganizationsLocal Government EmployeesState Government EmployeesFederal Government EmployeesUnpaid Family Workers
Commute Time
Longest CommuteLongest Commute | MaleLongest Commute | FemaleShortest CommuteShortest Commute | MaleShortest Commute | Female
Commute Means
School Enrollment
In Private SchoolNursery / PreschoolKindergartenElementary SchoolMiddle SchoolHigh SchoolCollegeUniversity
Education by Degree Field
Computers and MathematicsBio, Nature & AgriculturalPhysical and Health SciencesPsychologySocial SciencesEngineeringMultidisciplinary StudiesScience and EngineeringBusinessEducationLiterature and LanguagesLiberal Arts and HistoryVisual and Performing ArtsCommunicationsArts and Humanities
Occupancy
Finances
Highest Median Housing CostsHighest Property PricesHighest Owner Housing CostsHighest Renter Housing CostsHighest Housing Costs / IncomeLowest Median Housing CostsLowest Property PricesLowest Owner Housing CostsLowest Renter Housing CostsLowest Housing Costs / Income
Physical Characteristics
San Rafael
States
AlabamaAlaskaArizonaArkansasCaliforniaColoradoConnecticutDelawareDistrict Of ColumbiaFloridaGeorgiaHawaiiIdahoIllinoisIndianaIowaKansasKentuckyLouisianaMaineMarylandMassachusettsMichiganMinnesotaMississippiMissouriMontanaNebraskaNevadaNew HampshireNew JerseyNew MexicoNew YorkNorth CarolinaNorth DakotaOhioOklahomaOregonPennsylvaniaPuerto RicoRhode IslandSouth CarolinaSouth DakotaTennesseeTexasUtahVermontVirginiaWashingtonWest VirginiaWisconsinWyoming
California Cities
AlamedaAlhambraAnaheimBakersfieldBerkeleyBeverly HillsBurbankCanyon CountryCarlsbadCitrus HeightsClovisConcordCoronaCosta MesaDanvilleElk GroveEncinoEscondidoFairfieldFremontGlendaleHuntington BeachIrvineLivermoreLong BeachLos AltosLos AngelesLos GatosMercedMission ViejoMonterey ParkMountain ViewNewport BeachNorth HollywoodNovatoOaklandOceansideOrangePalm DesertPalm SpringsPalo AltoPasadenaPetalumaReddingRedondo BeachRedwood CityRiversideRosevilleSacramentoSan ClementeSan DiegoSan FranciscoSan JoseSan Luis ObispoSan MarcosSan MateoSan RafaelSan RamonSanta AnaSanta BarbaraSanta ClaraSanta MonicaSanta RosaStocktonSunnyvaleThousand OaksTorranceTustinVan NuysVenturaVistaWalnut CreekWoodland HillsYorba Linda
Compare Zip Codes
Comparison Subject
Compare StatesCompare CitiesCompare Zip Codes
Map of Zip Codes with the Most Immigrants from South Africa in San Rafael
20
87
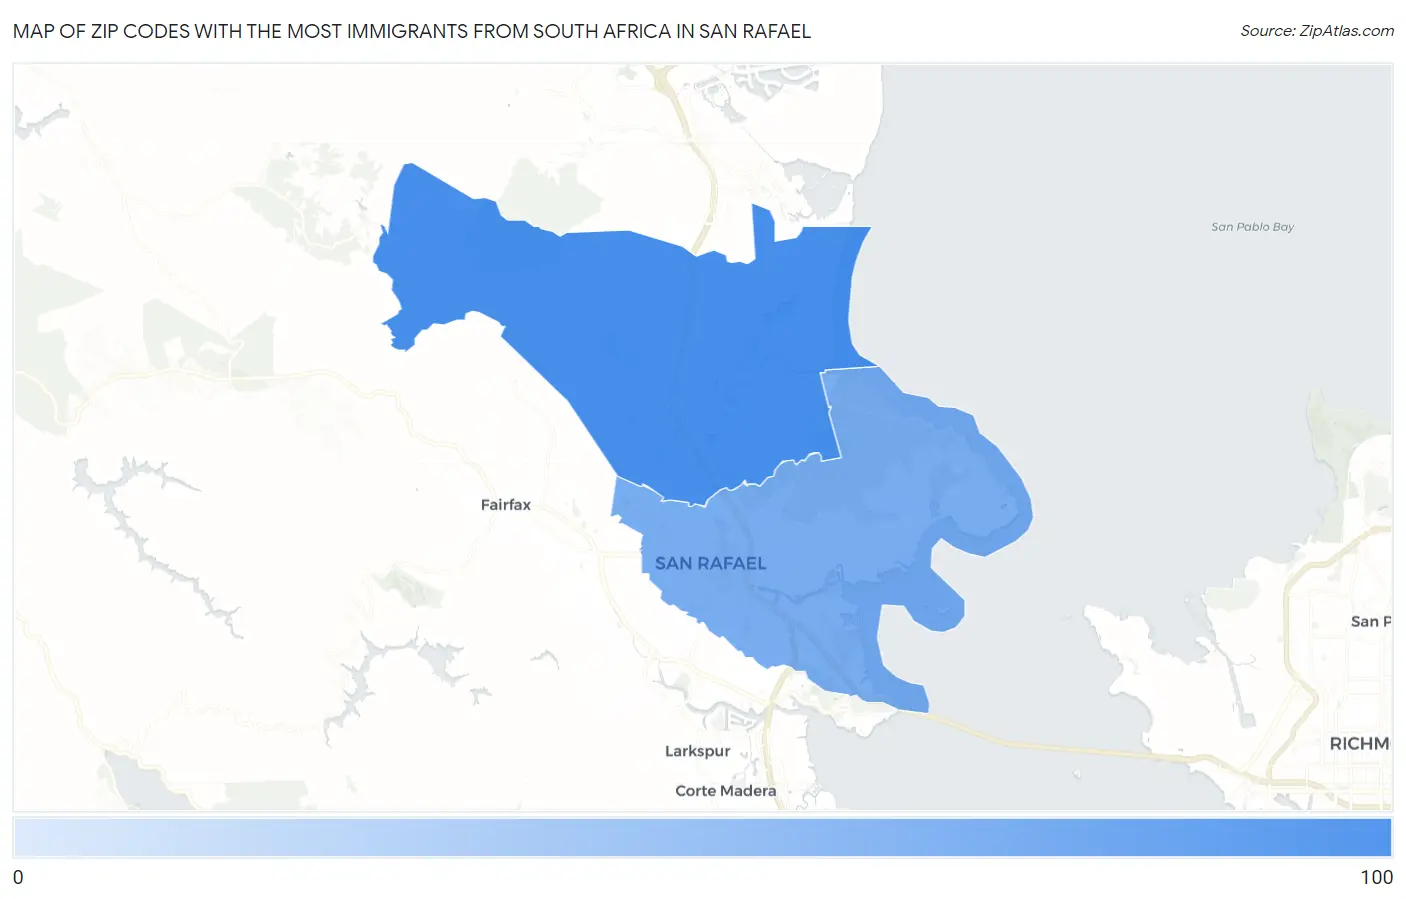
Zip Codes with the Most Immigrants from South Africa in San Rafael, CA
| Zip Code | South Africa | vs State | vs National | |
| 1. | 94903 | 87 | 20,614(0.42%)#55 | 117,055(0.07%)#247 |
| 2. | 94901 | 20 | 20,614(0.10%)#301 | 117,055(0.02%)#1,705 |
1
Common Questions
What are the Top Zip Codes with the Most Immigrants from South Africa in San Rafael, CA?
Top Zip Codes with the Most Immigrants from South Africa in San Rafael, CA are:
What zip code has the Most Immigrants from South Africa in San Rafael, CA?
94903 has the Most Immigrants from South Africa in San Rafael, CA with 87.
What is the Total Immigrants from South Africa in San Rafael, CA?
Total Immigrants from South Africa in San Rafael is 91.
What is the Total Immigrants from South Africa in California?
Total Immigrants from South Africa in California is 20,614.
What is the Total Immigrants from South Africa in the United States?
Total Immigrants from South Africa in the United States is 117,055.