Salida, CA Map & Demographics
Salida Map
Salida Overview
$34,601
PER CAPITA INCOME
$96,505
AVG FAMILY INCOME
$90,476
AVG HOUSEHOLD INCOME
50.7%
WAGE / INCOME GAP [ % ]
49.3¢/ $1
WAGE / INCOME GAP [ $ ]
0.41
INEQUALITY / GINI INDEX
14,849
TOTAL POPULATION
7,712
MALE POPULATION
7,137
FEMALE POPULATION
108.06
MALES / 100 FEMALES
92.54
FEMALES / 100 MALES
31.9
MEDIAN AGE
3.9
AVG FAMILY SIZE
3.4
AVG HOUSEHOLD SIZE
8,305
LABOR FORCE [ PEOPLE ]
68.9%
PERCENT IN LABOR FORCE
10.7%
UNEMPLOYMENT RATE
Salida Zip Codes
Salida Area Codes
Income in Salida
Income Overview in Salida
Per Capita Income in Salida is $34,601, while median incomes of families and households are $96,505 and $90,476 respectively.
| Characteristic | Number | Measure |
| Per Capita Income | 14,849 | $34,601 |
| Median Family Income | 3,452 | $96,505 |
| Mean Family Income | 3,452 | $121,815 |
| Median Household Income | 4,350 | $90,476 |
| Mean Household Income | 4,350 | $112,548 |
| Income Deficit | 3,452 | $0 |
| Wage / Income Gap (%) | 14,849 | 50.66% |
| Wage / Income Gap ($) | 14,849 | 49.34¢ per $1 |
| Gini / Inequality Index | 14,849 | 0.41 |
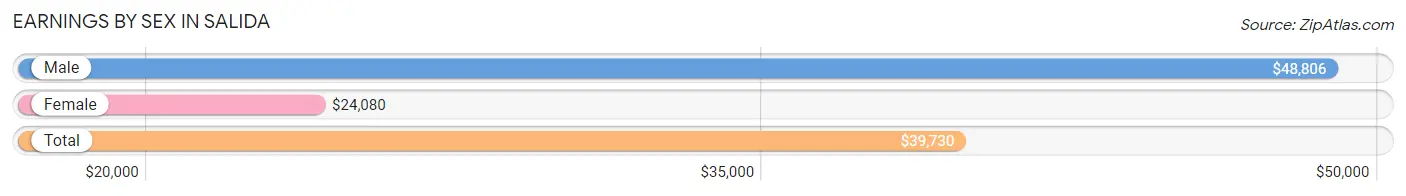
Earnings by Sex in Salida
Average Earnings in Salida are $39,730, $48,806 for men and $24,080 for women, a difference of 50.7%.
| Sex | Number | Average Earnings |
| Male | 4,894 (56.4%) | $48,806 |
| Female | 3,779 (43.6%) | $24,080 |
| Total | 8,673 (100.0%) | $39,730 |
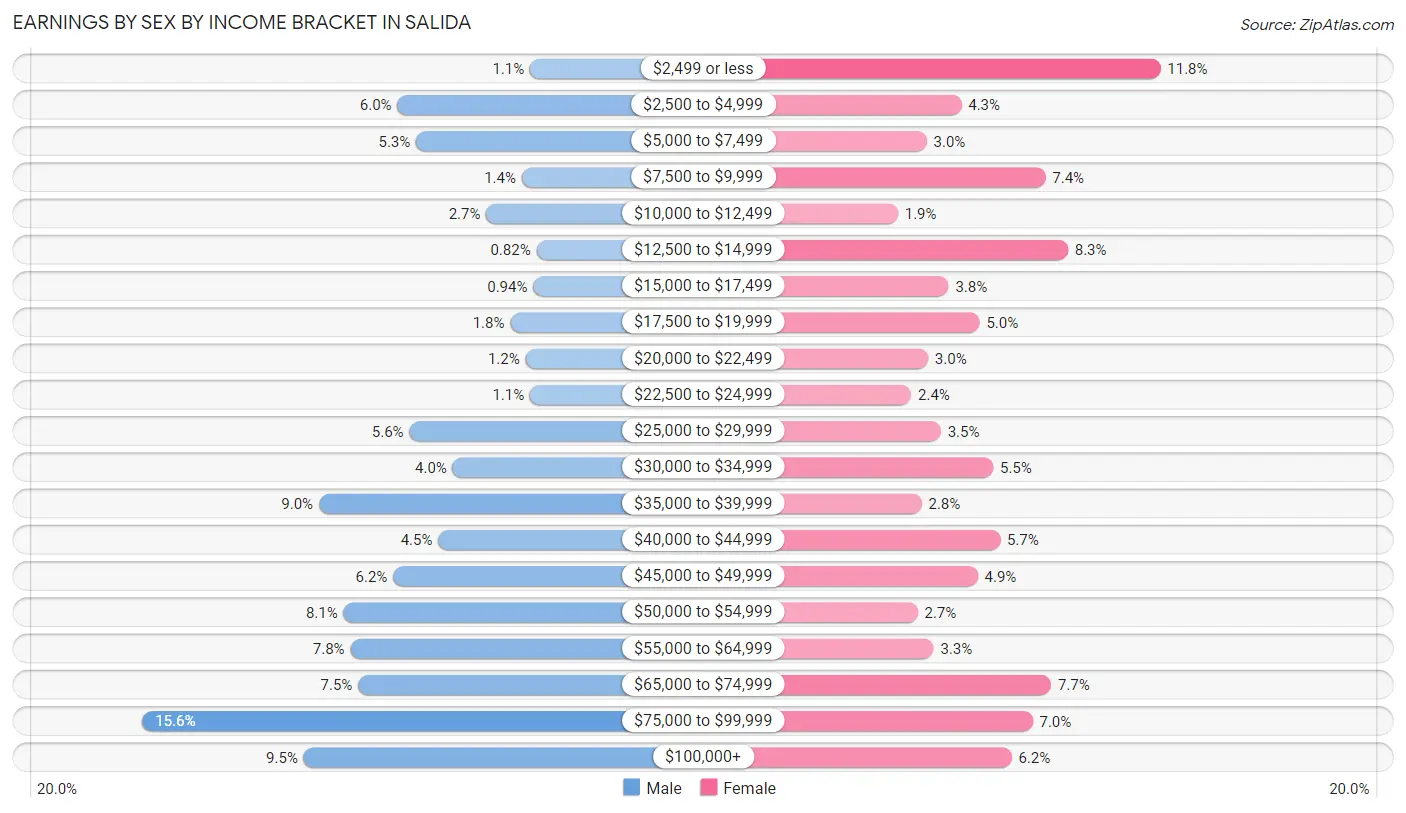
Earnings by Sex by Income Bracket in Salida
The most common earnings brackets in Salida are $75,000 to $99,999 for men (763 | 15.6%) and $2,499 or less for women (444 | 11.7%).
| Income | Male | Female |
| $2,499 or less | 52 (1.1%) | 444 (11.7%) |
| $2,500 to $4,999 | 295 (6.0%) | 162 (4.3%) |
| $5,000 to $7,499 | 261 (5.3%) | 113 (3.0%) |
| $7,500 to $9,999 | 67 (1.4%) | 281 (7.4%) |
| $10,000 to $12,499 | 132 (2.7%) | 72 (1.9%) |
| $12,500 to $14,999 | 40 (0.8%) | 313 (8.3%) |
| $15,000 to $17,499 | 46 (0.9%) | 144 (3.8%) |
| $17,500 to $19,999 | 88 (1.8%) | 188 (5.0%) |
| $20,000 to $22,499 | 60 (1.2%) | 115 (3.0%) |
| $22,500 to $24,999 | 52 (1.1%) | 91 (2.4%) |
| $25,000 to $29,999 | 273 (5.6%) | 133 (3.5%) |
| $30,000 to $34,999 | 194 (4.0%) | 207 (5.5%) |
| $35,000 to $39,999 | 439 (9.0%) | 106 (2.8%) |
| $40,000 to $44,999 | 220 (4.5%) | 217 (5.7%) |
| $45,000 to $49,999 | 303 (6.2%) | 185 (4.9%) |
| $50,000 to $54,999 | 394 (8.1%) | 100 (2.6%) |
| $55,000 to $64,999 | 381 (7.8%) | 123 (3.3%) |
| $65,000 to $74,999 | 367 (7.5%) | 289 (7.6%) |
| $75,000 to $99,999 | 763 (15.6%) | 263 (7.0%) |
| $100,000+ | 467 (9.5%) | 233 (6.2%) |
| Total | 4,894 (100.0%) | 3,779 (100.0%) |
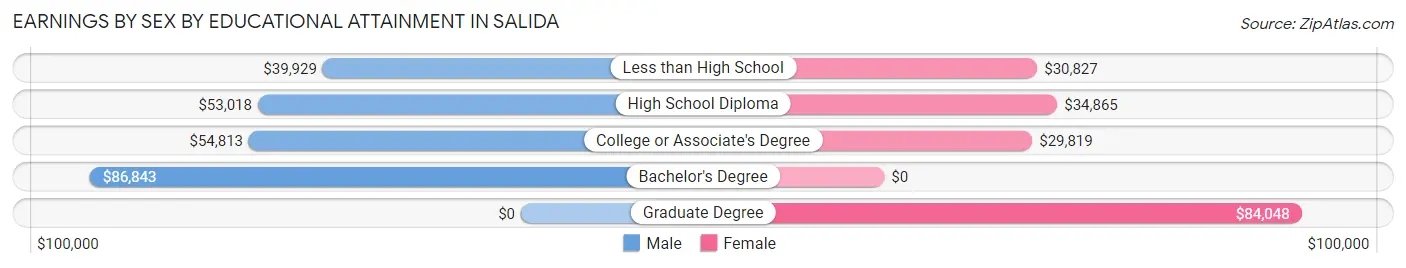
Earnings by Sex by Educational Attainment in Salida
Average earnings in Salida are $54,381 for men and $33,731 for women, a difference of 38.0%. Men with an educational attainment of bachelor's degree enjoy the highest average annual earnings of $86,843, while those with less than high school education earn the least with $39,929. Women with an educational attainment of graduate degree earn the most with the average annual earnings of $84,048, while those with college or associate's degree education have the smallest earnings of $29,819.
| Educational Attainment | Male Income | Female Income |
| Less than High School | $39,929 | $30,827 |
| High School Diploma | $53,018 | $34,865 |
| College or Associate's Degree | $54,813 | $29,819 |
| Bachelor's Degree | $86,843 | $0 |
| Graduate Degree | - | - |
| Total | $54,381 | $33,731 |
Family Income in Salida
Family Income Brackets in Salida
According to the Salida family income data, there are 846 families falling into the $100,000 to $149,999 income range, which is the most common income bracket and makes up 24.5% of all families.
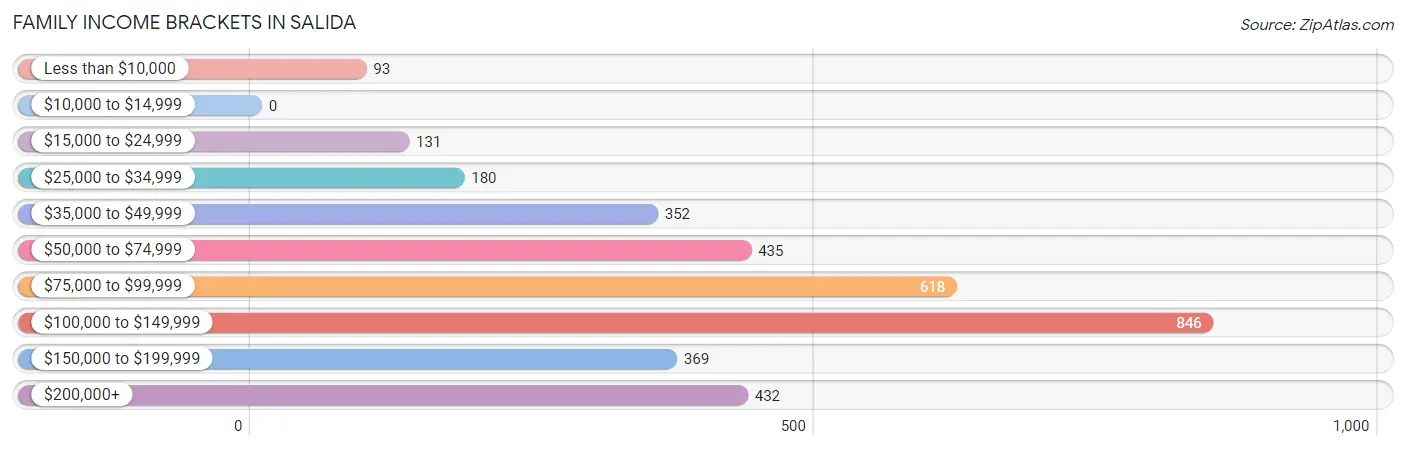
| Income Bracket | # Families | % Families |
| Less than $10,000 | 93 | 2.7% |
| $10,000 to $14,999 | 0 | 0.0% |
| $15,000 to $24,999 | 131 | 3.8% |
| $25,000 to $34,999 | 180 | 5.2% |
| $35,000 to $49,999 | 352 | 10.2% |
| $50,000 to $74,999 | 435 | 12.6% |
| $75,000 to $99,999 | 618 | 17.9% |
| $100,000 to $149,999 | 846 | 24.5% |
| $150,000 to $199,999 | 369 | 10.7% |
| $200,000+ | 432 | 12.5% |
Family Income by Famaliy Size in Salida
5-person families (465 | 13.5%) account for the highest median family income in Salida with $146,086 per family, while 2-person families (1,039 | 30.1%) have the highest median income of $39,972 per family member.
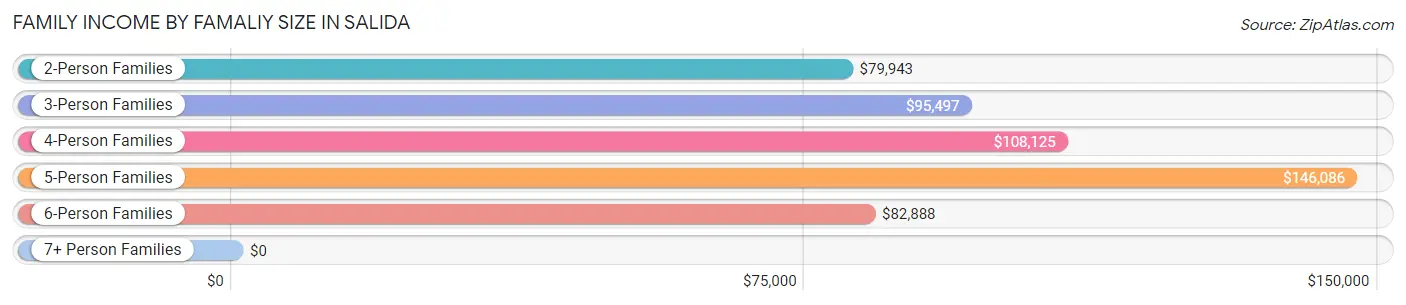
| Income Bracket | # Families | Median Income |
| 2-Person Families | 1,039 (30.1%) | $79,943 |
| 3-Person Families | 927 (26.9%) | $95,497 |
| 4-Person Families | 613 (17.8%) | $108,125 |
| 5-Person Families | 465 (13.5%) | $146,086 |
| 6-Person Families | 223 (6.5%) | $82,888 |
| 7+ Person Families | 185 (5.4%) | $0 |
| Total | 3,452 (100.0%) | $96,505 |
Family Income by Number of Earners in Salida
The median family income in Salida is $96,505, with families comprising 3+ earners (932) having the highest median family income of $157,857, while families with no earners (278) have the lowest median family income of $37,941, accounting for 27.0% and 8.1% of families, respectively.
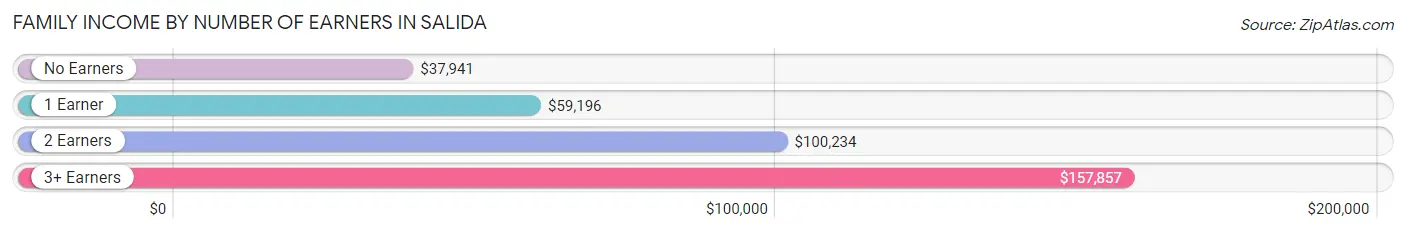
| Number of Earners | # Families | Median Income |
| No Earners | 278 (8.1%) | $37,941 |
| 1 Earner | 745 (21.6%) | $59,196 |
| 2 Earners | 1,497 (43.4%) | $100,234 |
| 3+ Earners | 932 (27.0%) | $157,857 |
| Total | 3,452 (100.0%) | $96,505 |
Household Income in Salida
Household Income Brackets in Salida
With 900 households falling in the category, the $75,000 to $99,999 income range is the most frequent in Salida, accounting for 20.7% of all households. In contrast, only 22 households (0.5%) fall into the $10,000 to $14,999 income bracket, making it the least populous group.
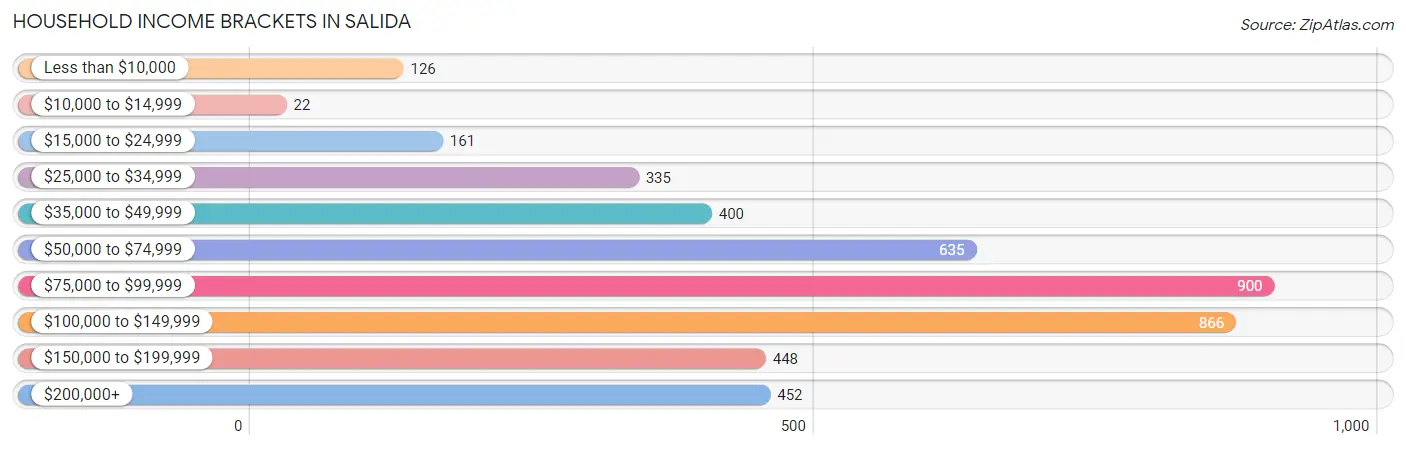
| Income Bracket | # Households | % Households |
| Less than $10,000 | 126 | 2.9% |
| $10,000 to $14,999 | 22 | 0.5% |
| $15,000 to $24,999 | 161 | 3.7% |
| $25,000 to $34,999 | 335 | 7.7% |
| $35,000 to $49,999 | 400 | 9.2% |
| $50,000 to $74,999 | 635 | 14.6% |
| $75,000 to $99,999 | 900 | 20.7% |
| $100,000 to $149,999 | 866 | 19.9% |
| $150,000 to $199,999 | 448 | 10.3% |
| $200,000+ | 452 | 10.4% |
Household Income by Householder Age in Salida
The median household income in Salida is $90,476, with the highest median household income of $108,388 found in the 45 to 64 years age bracket for the primary householder. A total of 2,081 households (47.8%) fall into this category. Meanwhile, the 65+ years age bracket for the primary householder has the lowest median household income of $45,957, with 786 households (18.1%) in this group.
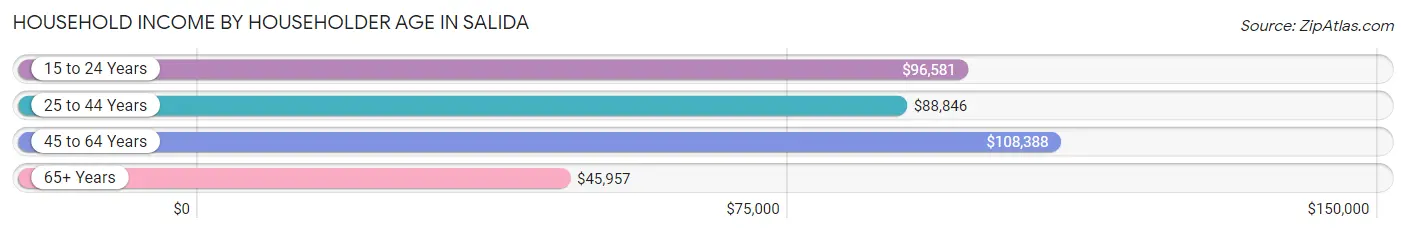
| Income Bracket | # Households | Median Income |
| 15 to 24 Years | 151 (3.5%) | $96,581 |
| 25 to 44 Years | 1,332 (30.6%) | $88,846 |
| 45 to 64 Years | 2,081 (47.8%) | $108,388 |
| 65+ Years | 786 (18.1%) | $45,957 |
| Total | 4,350 (100.0%) | $90,476 |
Poverty in Salida
Income Below Poverty by Sex and Age in Salida
With 9.5% poverty level for males and 7.0% for females among the residents of Salida, under 5 year old males and 5 year old females are the most vulnerable to poverty, with 277 males (43.4%) and 46 females (42.2%) in their respective age groups living below the poverty level.
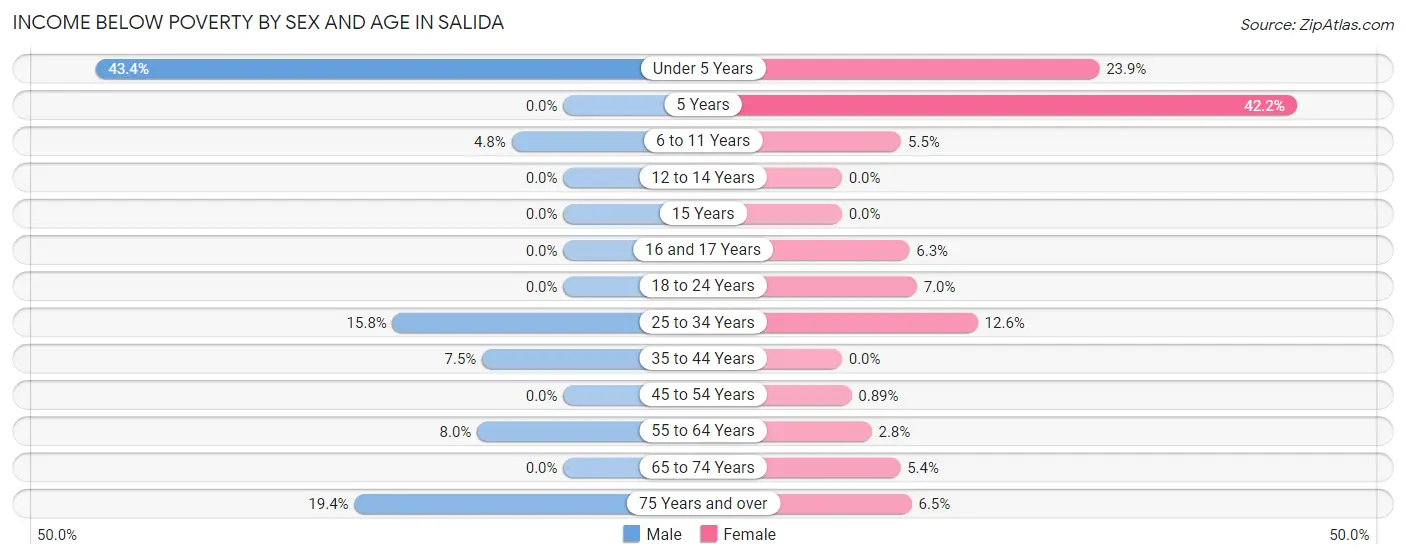
| Age Bracket | Male | Female |
| Under 5 Years | 277 (43.4%) | 75 (23.9%) |
| 5 Years | 0 (0.0%) | 46 (42.2%) |
| 6 to 11 Years | 22 (4.8%) | 23 (5.5%) |
| 12 to 14 Years | 0 (0.0%) | 0 (0.0%) |
| 15 Years | 0 (0.0%) | 0 (0.0%) |
| 16 and 17 Years | 0 (0.0%) | 17 (6.3%) |
| 18 to 24 Years | 0 (0.0%) | 64 (7.0%) |
| 25 to 34 Years | 228 (15.8%) | 194 (12.6%) |
| 35 to 44 Years | 57 (7.5%) | 0 (0.0%) |
| 45 to 54 Years | 0 (0.0%) | 6 (0.9%) |
| 55 to 64 Years | 90 (8.0%) | 21 (2.8%) |
| 65 to 74 Years | 0 (0.0%) | 33 (5.4%) |
| 75 Years and over | 57 (19.4%) | 20 (6.5%) |
| Total | 731 (9.5%) | 499 (7.0%) |
Income Above Poverty by Sex and Age in Salida
According to the poverty statistics in Salida, males aged 5 years and females aged 12 to 14 years are the age groups that are most secure financially, with 100.0% of males and 100.0% of females in these age groups living above the poverty line.
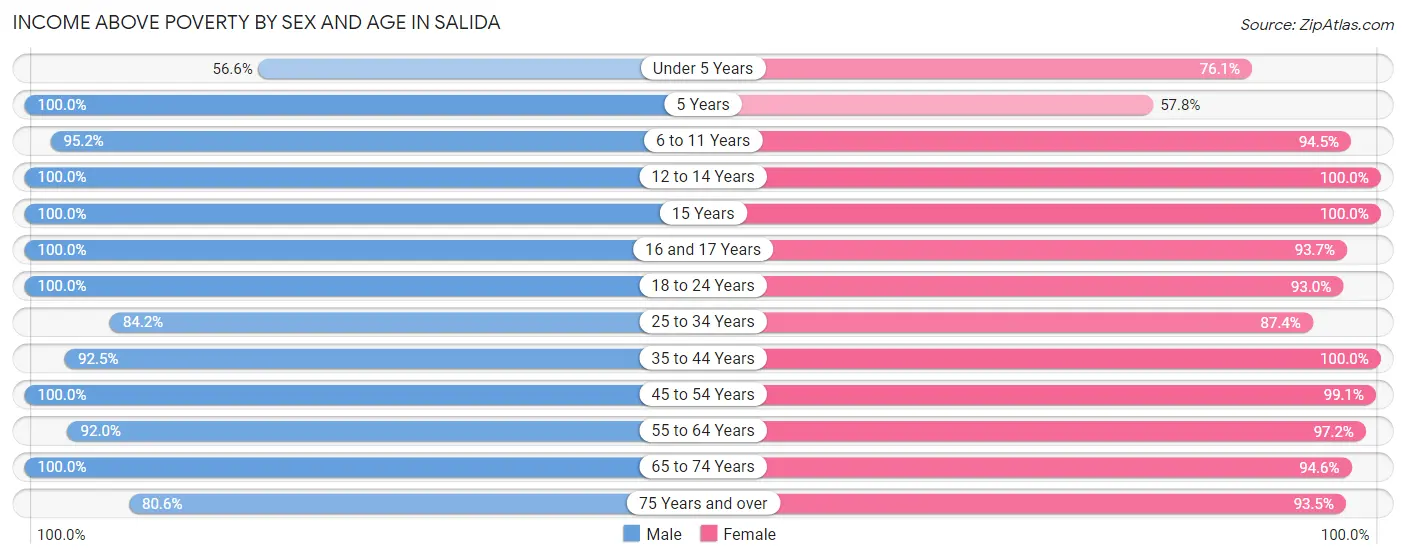
| Age Bracket | Male | Female |
| Under 5 Years | 361 (56.6%) | 239 (76.1%) |
| 5 Years | 71 (100.0%) | 63 (57.8%) |
| 6 to 11 Years | 436 (95.2%) | 395 (94.5%) |
| 12 to 14 Years | 256 (100.0%) | 495 (100.0%) |
| 15 Years | 17 (100.0%) | 20 (100.0%) |
| 16 and 17 Years | 14 (100.0%) | 254 (93.7%) |
| 18 to 24 Years | 1,153 (100.0%) | 855 (93.0%) |
| 25 to 34 Years | 1,211 (84.2%) | 1,344 (87.4%) |
| 35 to 44 Years | 700 (92.5%) | 699 (100.0%) |
| 45 to 54 Years | 1,037 (100.0%) | 670 (99.1%) |
| 55 to 64 Years | 1,035 (92.0%) | 739 (97.2%) |
| 65 to 74 Years | 453 (100.0%) | 576 (94.6%) |
| 75 Years and over | 237 (80.6%) | 289 (93.5%) |
| Total | 6,981 (90.5%) | 6,638 (93.0%) |
Income Below Poverty Among Married-Couple Families in Salida
The poverty statistics for married-couple families in Salida show that 8.5% or 223 of the total 2,636 families live below the poverty line. Families with 3 or 4 children have the highest poverty rate of 15.4%, comprising of 48 families. On the other hand, families with no children have the lowest poverty rate of 3.8%, which includes 57 families.
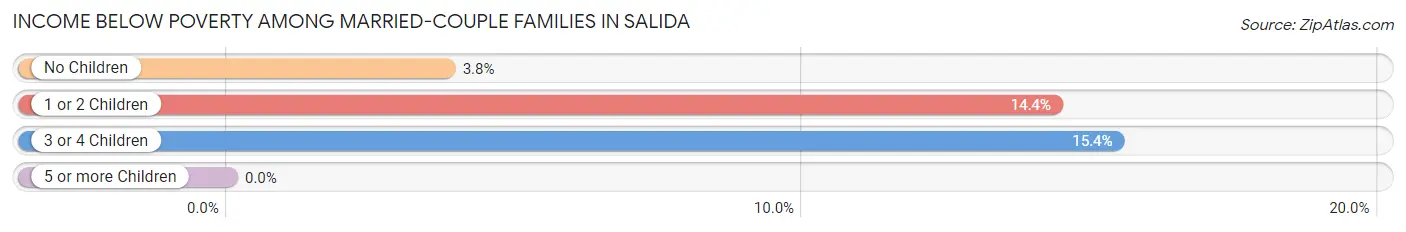
| Children | Above Poverty | Below Poverty |
| No Children | 1,446 (96.2%) | 57 (3.8%) |
| 1 or 2 Children | 704 (85.6%) | 118 (14.4%) |
| 3 or 4 Children | 263 (84.6%) | 48 (15.4%) |
| 5 or more Children | 0 (0.0%) | 0 (0.0%) |
| Total | 2,413 (91.5%) | 223 (8.5%) |
Income Below Poverty Among Single-Parent Households in Salida
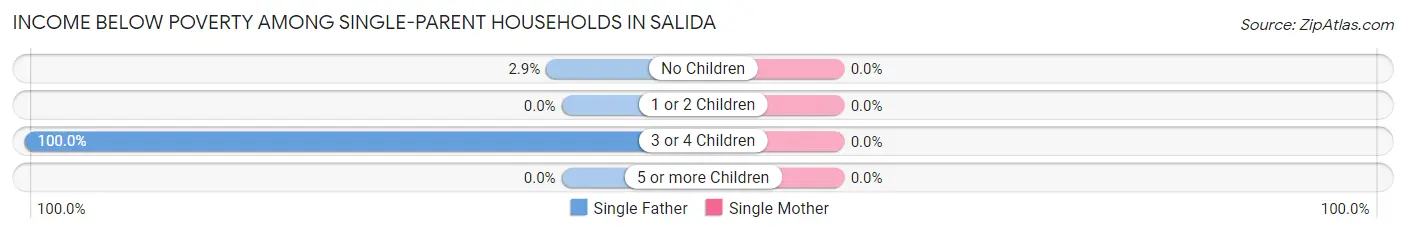
| Children | Single Father | Single Mother |
| No Children | 10 (2.9%) | 0 (0.0%) |
| 1 or 2 Children | 0 (0.0%) | 0 (0.0%) |
| 3 or 4 Children | 25 (100.0%) | 0 (0.0%) |
| 5 or more Children | 0 (0.0%) | 0 (0.0%) |
| Total | 35 (5.5%) | 0 (0.0%) |
Income Below Poverty Among Married-Couple vs Single-Parent Households in Salida
The poverty data for Salida shows that 223 of the married-couple family households (8.5%) and 35 of the single-parent households (4.3%) are living below the poverty level. Within the married-couple family households, those with 3 or 4 children have the highest poverty rate, with 48 households (15.4%) falling below the poverty line. Among the single-parent households, those with 3 or 4 children have the highest poverty rate, with 25 household (100.0%) living below poverty.
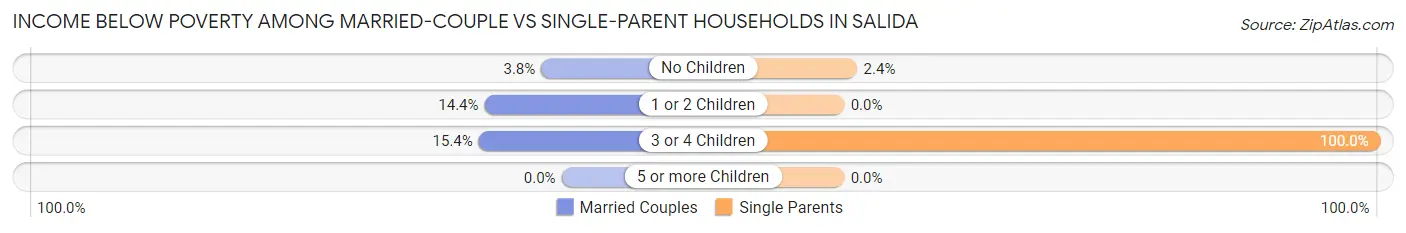
| Children | Married-Couple Families | Single-Parent Households |
| No Children | 57 (3.8%) | 10 (2.4%) |
| 1 or 2 Children | 118 (14.4%) | 0 (0.0%) |
| 3 or 4 Children | 48 (15.4%) | 25 (100.0%) |
| 5 or more Children | 0 (0.0%) | 0 (0.0%) |
| Total | 223 (8.5%) | 35 (4.3%) |
Race in Salida
The most populous races in Salida are White / Caucasian (8,179 | 55.1%), Hispanic or Latino (7,956 | 53.6%), and Some other Race (2,613 | 17.6%).
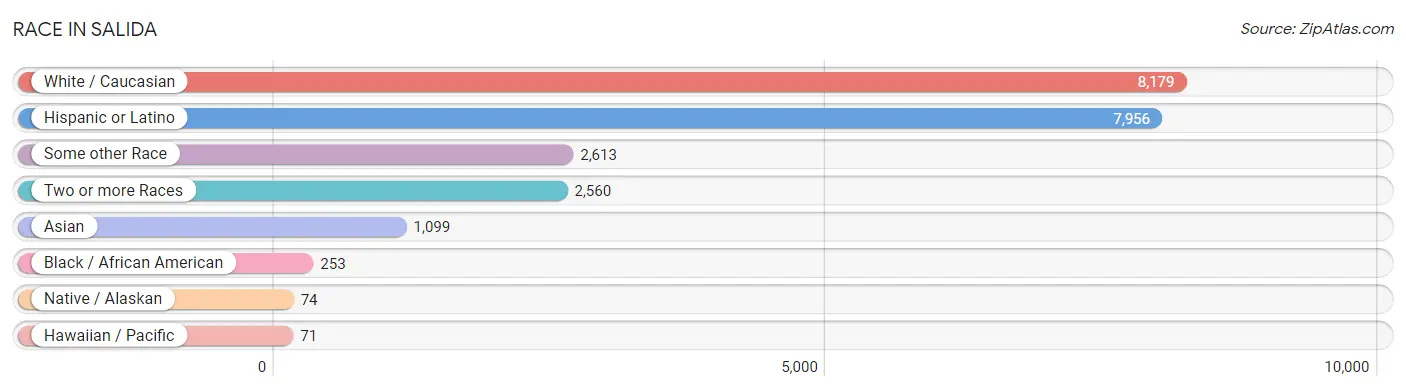
| Race | # Population | % Population |
| Asian | 1,099 | 7.4% |
| Black / African American | 253 | 1.7% |
| Hawaiian / Pacific | 71 | 0.5% |
| Hispanic or Latino | 7,956 | 53.6% |
| Native / Alaskan | 74 | 0.5% |
| White / Caucasian | 8,179 | 55.1% |
| Two or more Races | 2,560 | 17.2% |
| Some other Race | 2,613 | 17.6% |
| Total | 14,849 | 100.0% |
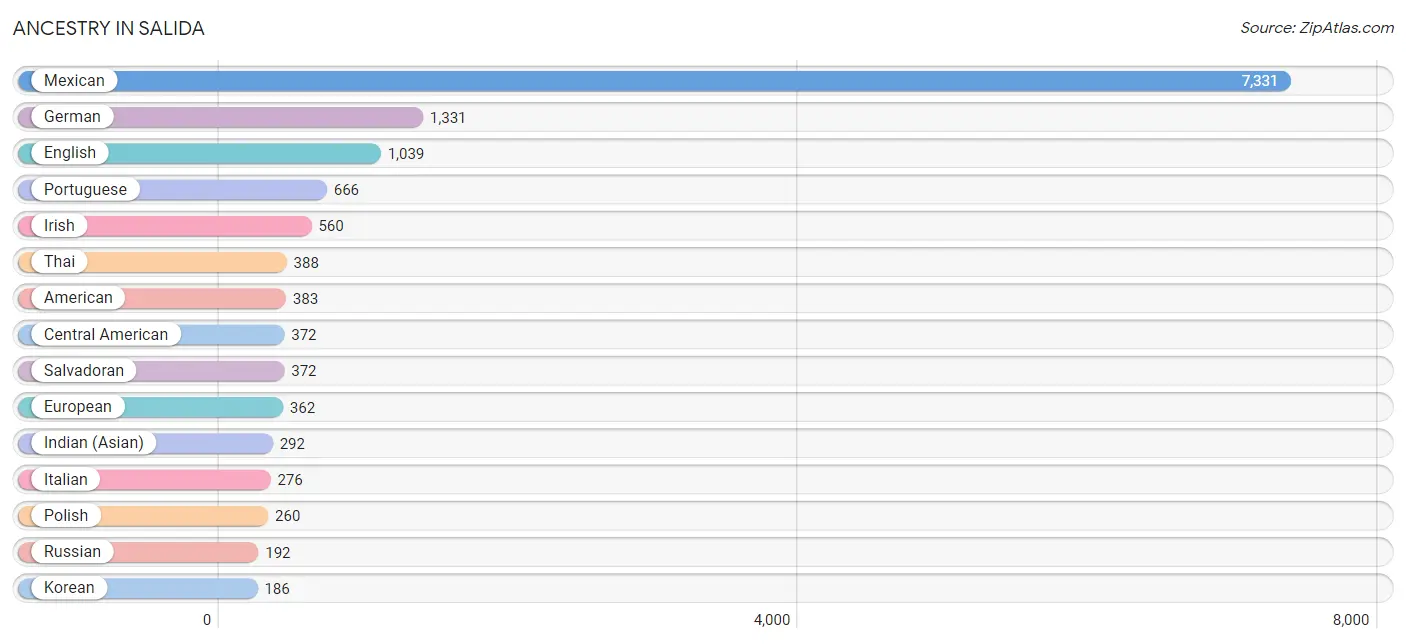
Ancestry in Salida
The most populous ancestries reported in Salida are Mexican (7,331 | 49.4%), German (1,331 | 9.0%), English (1,039 | 7.0%), Portuguese (666 | 4.5%), and Irish (560 | 3.8%), together accounting for 73.6% of all Salida residents.
| Ancestry | # Population | % Population |
| African | 46 | 0.3% |
| American | 383 | 2.6% |
| Apache | 42 | 0.3% |
| Arab | 23 | 0.2% |
| Bhutanese | 6 | 0.0% |
| British | 10 | 0.1% |
| Burmese | 16 | 0.1% |
| Central American | 372 | 2.5% |
| Central American Indian | 8 | 0.1% |
| Cherokee | 69 | 0.5% |
| Choctaw | 129 | 0.9% |
| Cuban | 7 | 0.1% |
| Czech | 19 | 0.1% |
| Dutch | 85 | 0.6% |
| English | 1,039 | 7.0% |
| European | 362 | 2.4% |
| Finnish | 46 | 0.3% |
| French | 106 | 0.7% |
| French Canadian | 46 | 0.3% |
| German | 1,331 | 9.0% |
| Indian (Asian) | 292 | 2.0% |
| Irish | 560 | 3.8% |
| Italian | 276 | 1.9% |
| Korean | 186 | 1.3% |
| Malaysian | 29 | 0.2% |
| Mexican | 7,331 | 49.4% |
| Native Hawaiian | 22 | 0.2% |
| Navajo | 15 | 0.1% |
| Northern European | 7 | 0.1% |
| Norwegian | 6 | 0.0% |
| Polish | 260 | 1.8% |
| Portuguese | 666 | 4.5% |
| Pueblo | 23 | 0.2% |
| Puerto Rican | 97 | 0.6% |
| Russian | 192 | 1.3% |
| Salvadoran | 372 | 2.5% |
| Samoan | 39 | 0.3% |
| Scotch-Irish | 107 | 0.7% |
| Scottish | 171 | 1.1% |
| Spaniard | 62 | 0.4% |
| Spanish | 27 | 0.2% |
| Sri Lankan | 25 | 0.2% |
| Subsaharan African | 46 | 0.3% |
| Swedish | 28 | 0.2% |
| Swiss | 32 | 0.2% |
| Thai | 388 | 2.6% |
| Ukrainian | 55 | 0.4% |
| Welsh | 43 | 0.3% |
| Yugoslavian | 20 | 0.1% | View All 49 Rows |
Immigrants in Salida
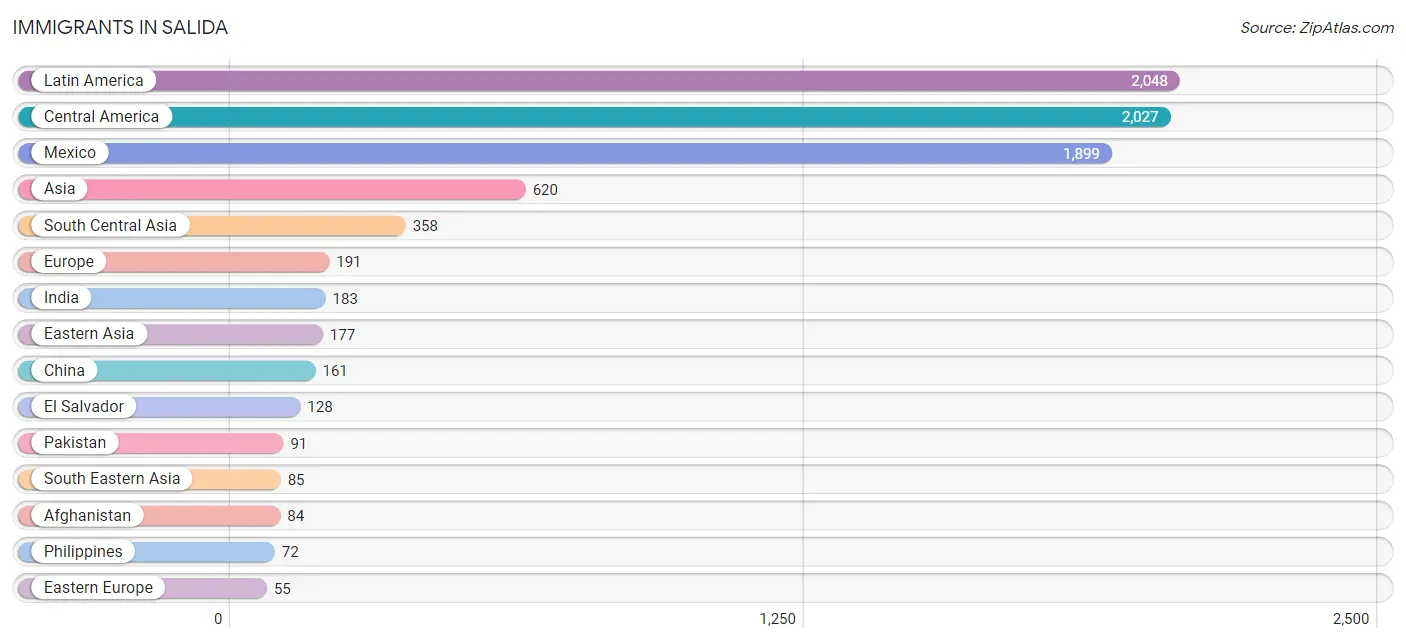
The most numerous immigrant groups reported in Salida came from Latin America (2,048 | 13.8%), Central America (2,027 | 13.7%), Mexico (1,899 | 12.8%), Asia (620 | 4.2%), and South Central Asia (358 | 2.4%), together accounting for 46.8% of all Salida residents.
| Immigration Origin | # Population | % Population |
| Afghanistan | 84 | 0.6% |
| Asia | 620 | 4.2% |
| Caribbean | 21 | 0.1% |
| Central America | 2,027 | 13.7% |
| China | 161 | 1.1% |
| Cuba | 21 | 0.1% |
| Eastern Asia | 177 | 1.2% |
| Eastern Europe | 55 | 0.4% |
| El Salvador | 128 | 0.9% |
| Europe | 191 | 1.3% |
| Fiji | 21 | 0.1% |
| France | 23 | 0.2% |
| Hong Kong | 23 | 0.2% |
| India | 183 | 1.2% |
| Korea | 16 | 0.1% |
| Laos | 3 | 0.0% |
| Latin America | 2,048 | 13.8% |
| Mexico | 1,899 | 12.8% |
| Netherlands | 13 | 0.1% |
| Northern Europe | 45 | 0.3% |
| Oceania | 21 | 0.1% |
| Pakistan | 91 | 0.6% |
| Philippines | 72 | 0.5% |
| Portugal | 55 | 0.4% |
| Scotland | 45 | 0.3% |
| South Central Asia | 358 | 2.4% |
| South Eastern Asia | 85 | 0.6% |
| Southern Europe | 55 | 0.4% |
| Ukraine | 55 | 0.4% |
| Vietnam | 10 | 0.1% |
| Western Europe | 36 | 0.2% | View All 31 Rows |
Sex and Age in Salida
Sex and Age in Salida
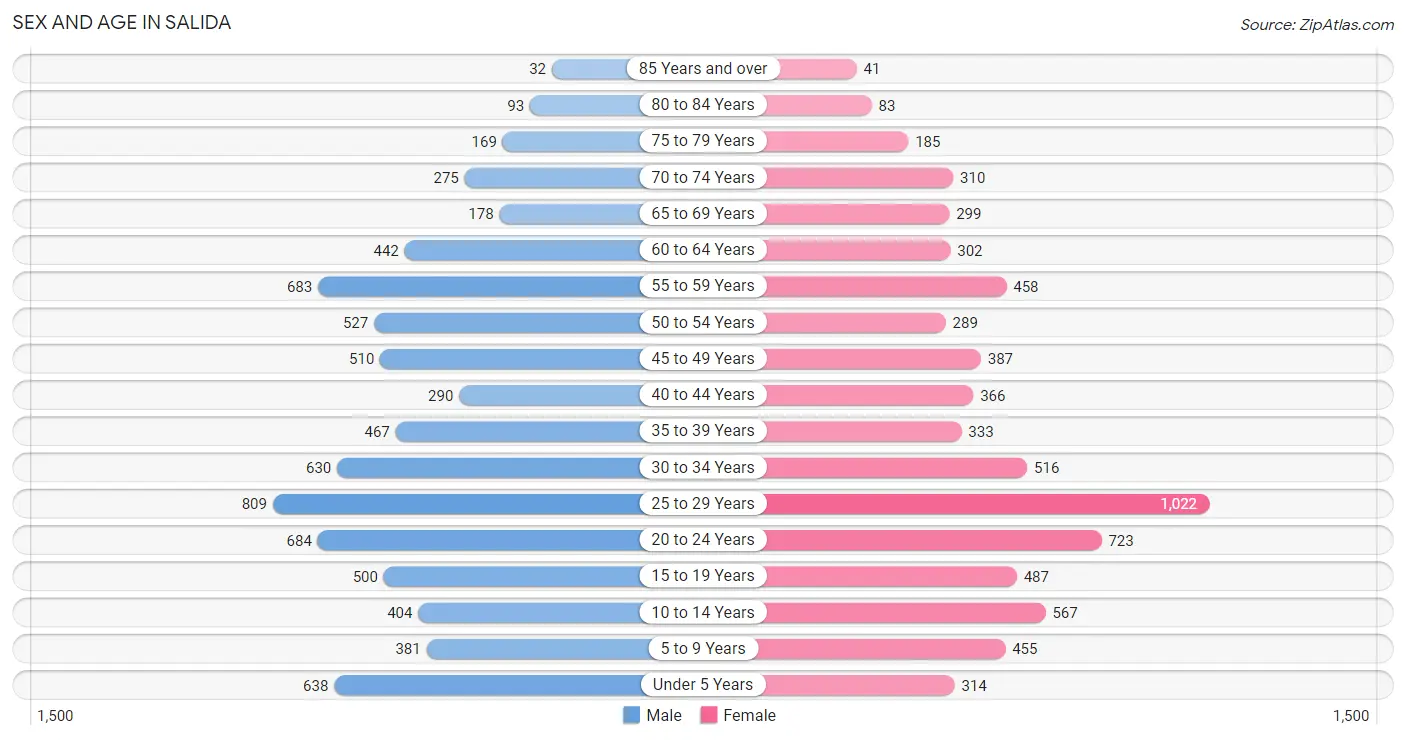
The most populous age groups in Salida are 25 to 29 Years (809 | 10.5%) for men and 25 to 29 Years (1,022 | 14.3%) for women.
| Age Bracket | Male | Female |
| Under 5 Years | 638 (8.3%) | 314 (4.4%) |
| 5 to 9 Years | 381 (4.9%) | 455 (6.4%) |
| 10 to 14 Years | 404 (5.2%) | 567 (7.9%) |
| 15 to 19 Years | 500 (6.5%) | 487 (6.8%) |
| 20 to 24 Years | 684 (8.9%) | 723 (10.1%) |
| 25 to 29 Years | 809 (10.5%) | 1,022 (14.3%) |
| 30 to 34 Years | 630 (8.2%) | 516 (7.2%) |
| 35 to 39 Years | 467 (6.1%) | 333 (4.7%) |
| 40 to 44 Years | 290 (3.8%) | 366 (5.1%) |
| 45 to 49 Years | 510 (6.6%) | 387 (5.4%) |
| 50 to 54 Years | 527 (6.8%) | 289 (4.1%) |
| 55 to 59 Years | 683 (8.9%) | 458 (6.4%) |
| 60 to 64 Years | 442 (5.7%) | 302 (4.2%) |
| 65 to 69 Years | 178 (2.3%) | 299 (4.2%) |
| 70 to 74 Years | 275 (3.6%) | 310 (4.3%) |
| 75 to 79 Years | 169 (2.2%) | 185 (2.6%) |
| 80 to 84 Years | 93 (1.2%) | 83 (1.2%) |
| 85 Years and over | 32 (0.4%) | 41 (0.6%) |
| Total | 7,712 (100.0%) | 7,137 (100.0%) |
Families and Households in Salida
Median Family Size in Salida
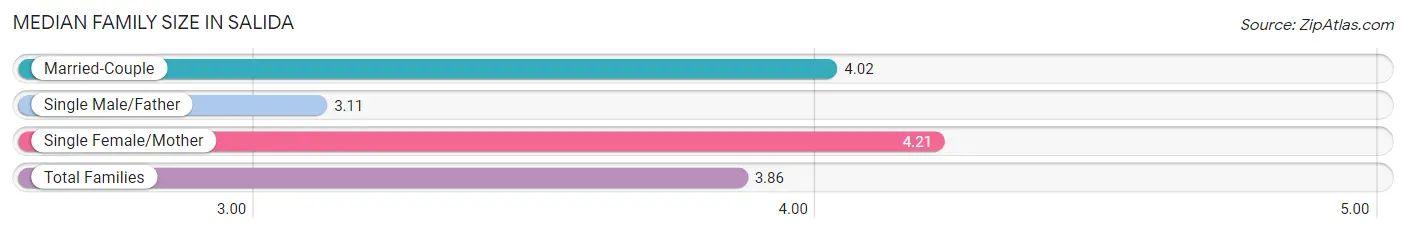
The median family size in Salida is 3.86 persons per family, with single female/mother families (184 | 5.3%) accounting for the largest median family size of 4.21 persons per family. On the other hand, single male/father families (632 | 18.3%) represent the smallest median family size with 3.11 persons per family.
| Family Type | # Families | Family Size |
| Married-Couple | 2,636 (76.4%) | 4.02 |
| Single Male/Father | 632 (18.3%) | 3.11 |
| Single Female/Mother | 184 (5.3%) | 4.21 |
| Total Families | 3,452 (100.0%) | 3.86 |
Median Household Size in Salida
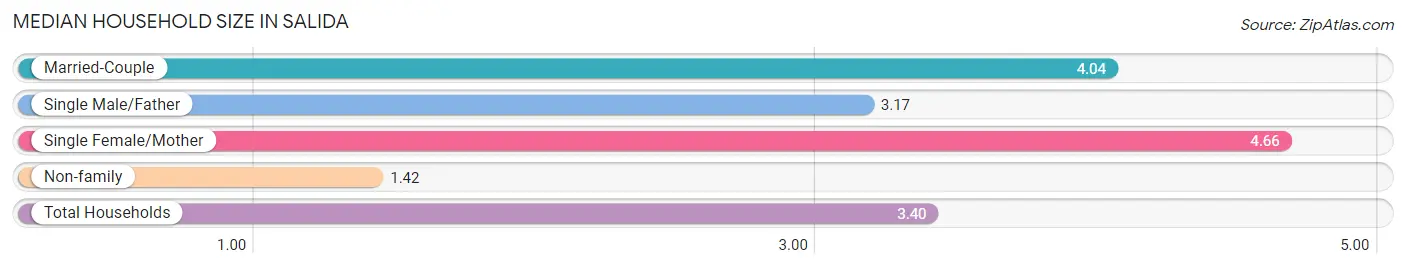
The median household size in Salida is 3.40 persons per household, with single female/mother households (184 | 4.2%) accounting for the largest median household size of 4.66 persons per household. non-family households (898 | 20.6%) represent the smallest median household size with 1.42 persons per household.
| Household Type | # Households | Household Size |
| Married-Couple | 2,636 (60.6%) | 4.04 |
| Single Male/Father | 632 (14.5%) | 3.17 |
| Single Female/Mother | 184 (4.2%) | 4.66 |
| Non-family | 898 (20.6%) | 1.42 |
| Total Households | 4,350 (100.0%) | 3.40 |
Household Size by Marriage Status in Salida
Out of a total of 4,350 households in Salida, 3,452 (79.4%) are family households, while 898 (20.6%) are nonfamily households. The most numerous type of family households are 2-person households, comprising 1,039, and the most common type of nonfamily households are 1-person households, comprising 687.
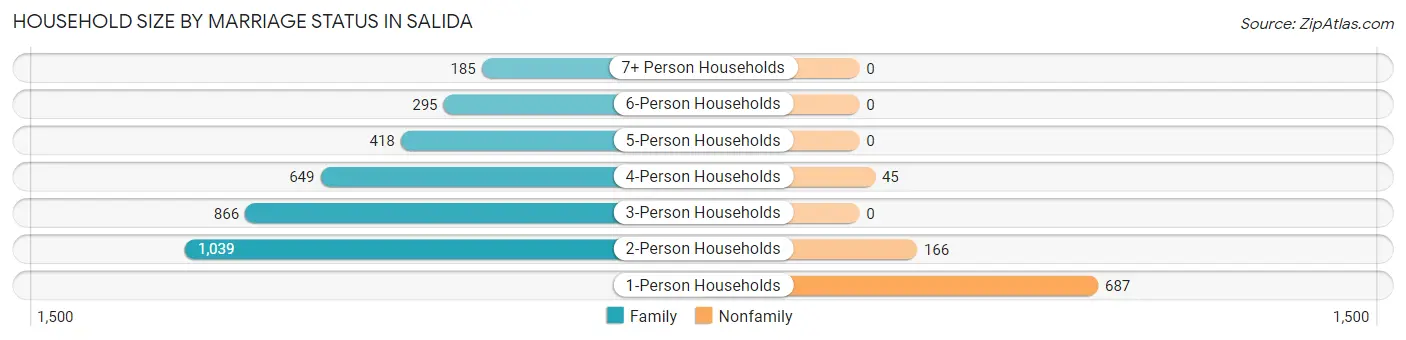
| Household Size | Family Households | Nonfamily Households |
| 1-Person Households | - | 687 (15.8%) |
| 2-Person Households | 1,039 (23.9%) | 166 (3.8%) |
| 3-Person Households | 866 (19.9%) | 0 (0.0%) |
| 4-Person Households | 649 (14.9%) | 45 (1.0%) |
| 5-Person Households | 418 (9.6%) | 0 (0.0%) |
| 6-Person Households | 295 (6.8%) | 0 (0.0%) |
| 7+ Person Households | 185 (4.3%) | 0 (0.0%) |
| Total | 3,452 (79.4%) | 898 (20.6%) |
Female Fertility in Salida
Fertility by Age in Salida
Average fertility rate in Salida is 60.0 births per 1,000 women. Women in the age bracket of 20 to 34 years have the highest fertility rate with 80.0 births per 1,000 women. Women in the age bracket of 20 to 34 years acount for 76.8% of all women with births.
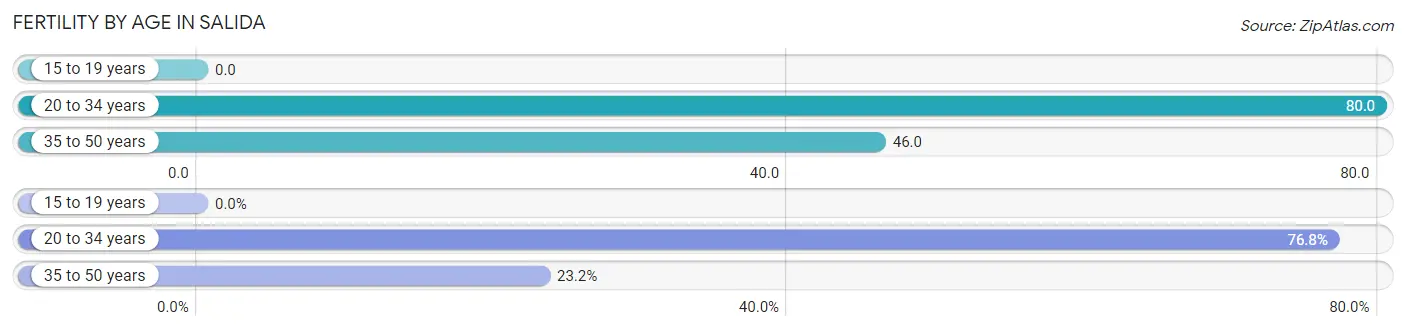
| Age Bracket | Women with Births | Births / 1,000 Women |
| 15 to 19 years | 0 (0.0%) | 0.0 |
| 20 to 34 years | 182 (76.8%) | 80.0 |
| 35 to 50 years | 55 (23.2%) | 46.0 |
| Total | 237 (100.0%) | 60.0 |
Fertility by Age by Marriage Status in Salida
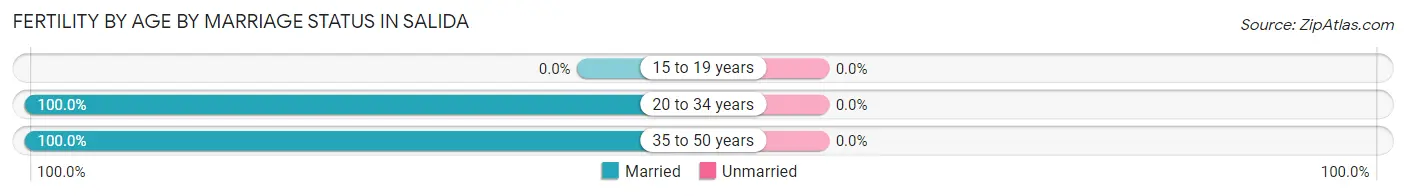
| Age Bracket | Married | Unmarried |
| 15 to 19 years | 0 (0.0%) | 0 (0.0%) |
| 20 to 34 years | 182 (100.0%) | 0 (0.0%) |
| 35 to 50 years | 55 (100.0%) | 0 (0.0%) |
| Total | 237 (100.0%) | 0 (0.0%) |
Fertility by Education in Salida
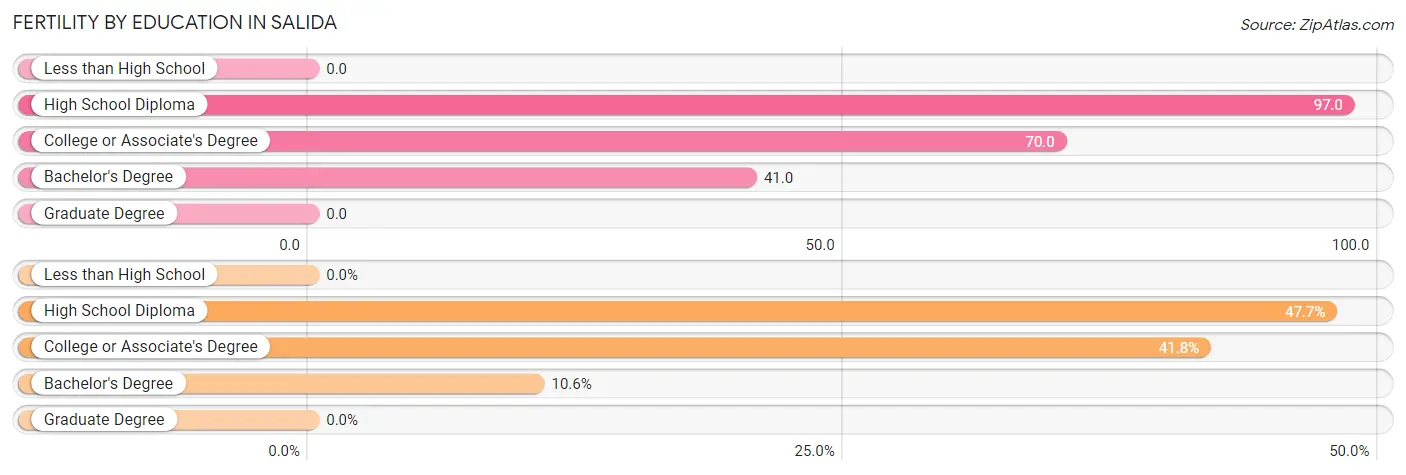
| Educational Attainment | Women with Births | Births / 1,000 Women |
| Less than High School | 0 (0.0%) | 0.0 |
| High School Diploma | 113 (47.7%) | 97.0 |
| College or Associate's Degree | 99 (41.8%) | 70.0 |
| Bachelor's Degree | 25 (10.5%) | 41.0 |
| Graduate Degree | 0 (0.0%) | 0.0 |
| Total | 237 (100.0%) | 60.0 |
Fertility by Education by Marriage Status in Salida
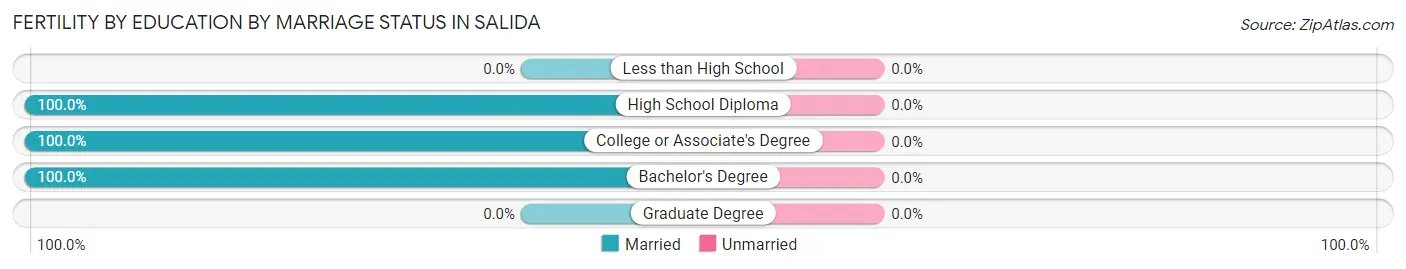
| Educational Attainment | Married | Unmarried |
| Less than High School | 0 (0.0%) | 0 (0.0%) |
| High School Diploma | 113 (100.0%) | 0 (0.0%) |
| College or Associate's Degree | 99 (100.0%) | 0 (0.0%) |
| Bachelor's Degree | 25 (100.0%) | 0 (0.0%) |
| Graduate Degree | 0 (0.0%) | 0 (0.0%) |
| Total | 237 (100.0%) | 0 (0.0%) |
Employment Characteristics in Salida
Employment by Class of Employer in Salida
Among the 7,132 employed individuals in Salida, private company employees (5,006 | 70.2%), local government employees (916 | 12.8%), and not-for-profit organizations (394 | 5.5%) make up the most common classes of employment.
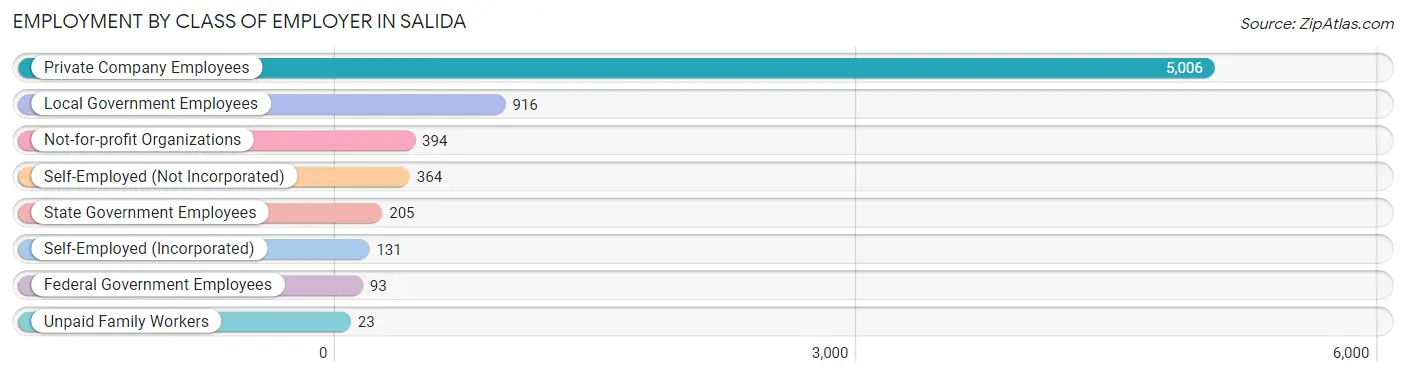
| Employer Class | # Employees | % Employees |
| Private Company Employees | 5,006 | 70.2% |
| Self-Employed (Incorporated) | 131 | 1.8% |
| Self-Employed (Not Incorporated) | 364 | 5.1% |
| Not-for-profit Organizations | 394 | 5.5% |
| Local Government Employees | 916 | 12.8% |
| State Government Employees | 205 | 2.9% |
| Federal Government Employees | 93 | 1.3% |
| Unpaid Family Workers | 23 | 0.3% |
| Total | 7,132 | 100.0% |
Employment Status by Age in Salida
According to the labor force statistics for Salida, out of the total population over 16 years of age (12,053), 68.9% or 8,305 individuals are in the labor force, with 10.7% or 889 of them unemployed. The age group with the highest labor force participation rate is 45 to 54 years, with 88.6% or 1,518 individuals in the labor force. Within the labor force, the 25 to 29 years age range has the highest percentage of unemployed individuals, with 31.0% or 448 of them being unemployed.
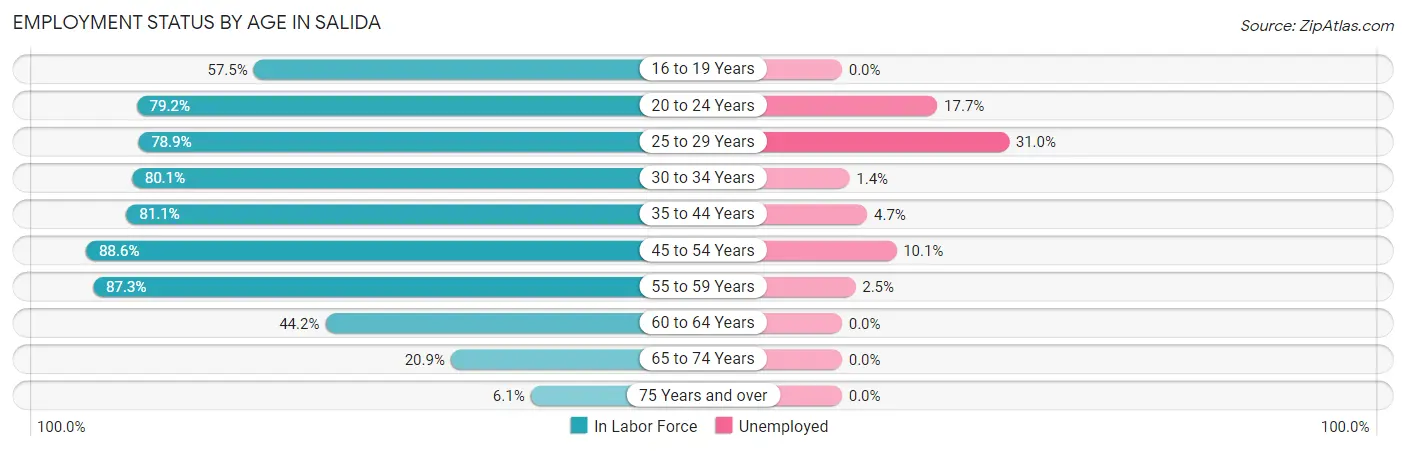
| Age Bracket | In Labor Force | Unemployed |
| 16 to 19 Years | 546 (57.5%) | 0 (0.0%) |
| 20 to 24 Years | 1,114 (79.2%) | 197 (17.7%) |
| 25 to 29 Years | 1,445 (78.9%) | 448 (31.0%) |
| 30 to 34 Years | 918 (80.1%) | 13 (1.4%) |
| 35 to 44 Years | 1,181 (81.1%) | 56 (4.7%) |
| 45 to 54 Years | 1,518 (88.6%) | 153 (10.1%) |
| 55 to 59 Years | 996 (87.3%) | 25 (2.5%) |
| 60 to 64 Years | 329 (44.2%) | 0 (0.0%) |
| 65 to 74 Years | 222 (20.9%) | 0 (0.0%) |
| 75 Years and over | 37 (6.1%) | 0 (0.0%) |
| Total | 8,305 (68.9%) | 889 (10.7%) |
Employment Status by Educational Attainment in Salida
According to labor force statistics for Salida, 79.5% of individuals (6,385) out of the total population between 25 and 64 years of age (8,031) are in the labor force, with 10.9% or 696 of them being unemployed. The group with the highest labor force participation rate are those with the educational attainment of bachelor's degree or higher, with 92.2% or 1,365 individuals in the labor force. Within the labor force, individuals with bachelor's degree or higher education have the highest percentage of unemployment, with 19.2% or 262 of them being unemployed.
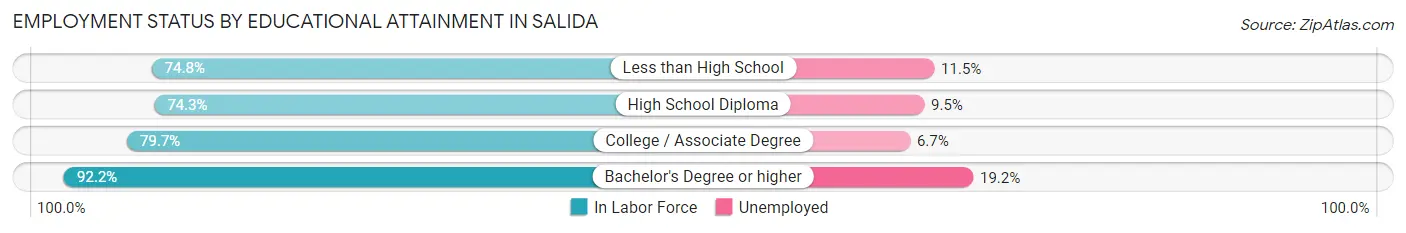
| Educational Attainment | In Labor Force | Unemployed |
| Less than High School | 808 (74.8%) | 124 (11.5%) |
| High School Diploma | 2,031 (74.3%) | 260 (9.5%) |
| College / Associate Degree | 2,181 (79.7%) | 183 (6.7%) |
| Bachelor's Degree or higher | 1,365 (92.2%) | 284 (19.2%) |
| Total | 6,385 (79.5%) | 875 (10.9%) |
Employment Occupations by Sex in Salida
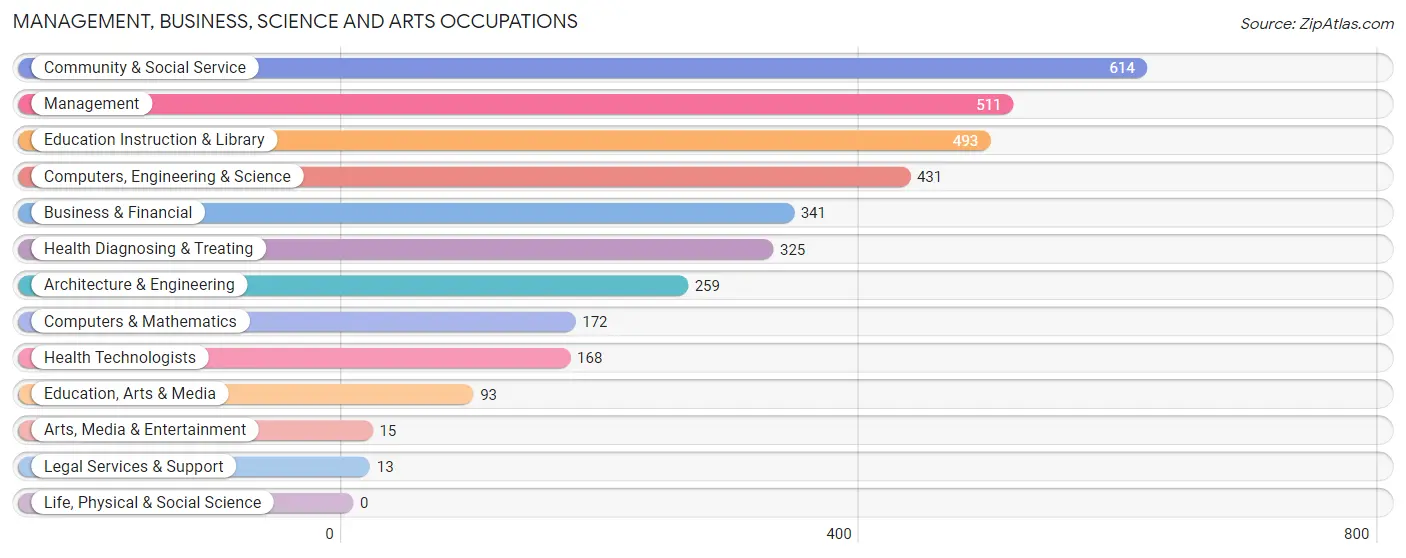
Management, Business, Science and Arts Occupations
The most common Management, Business, Science and Arts occupations in Salida are Community & Social Service (614 | 8.3%), Management (511 | 6.9%), Education Instruction & Library (493 | 6.7%), Computers, Engineering & Science (431 | 5.8%), and Business & Financial (341 | 4.6%).
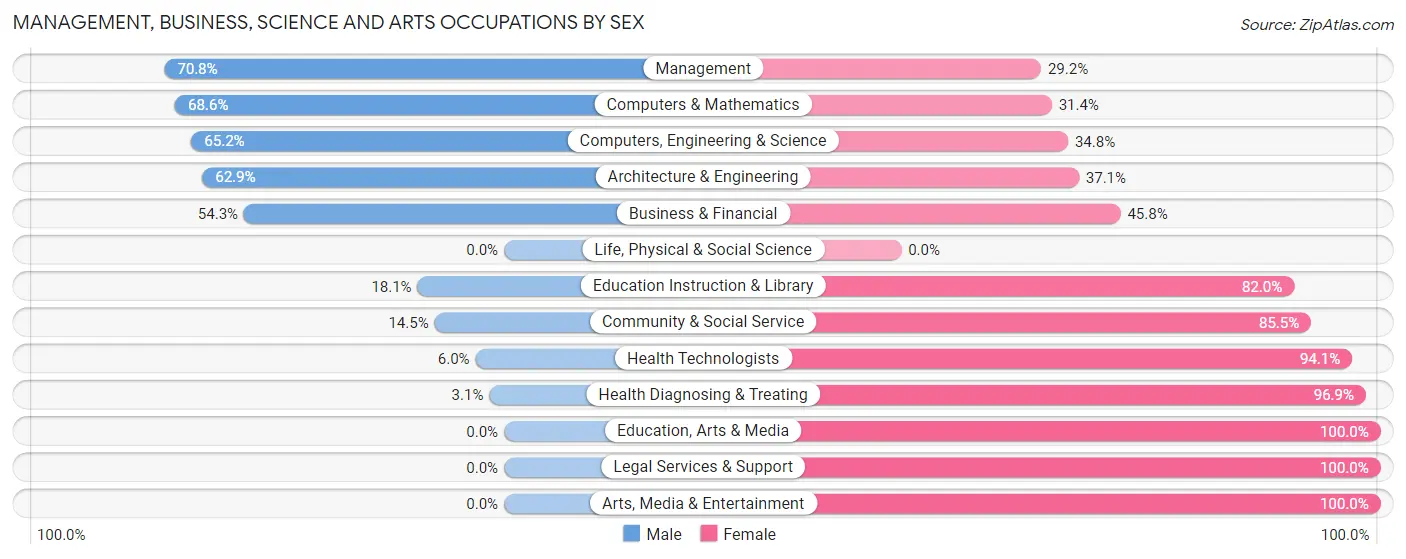
Management, Business, Science and Arts Occupations by Sex
Within the Management, Business, Science and Arts occupations in Salida, the most male-oriented occupations are Management (70.8%), Computers & Mathematics (68.6%), and Computers, Engineering & Science (65.2%), while the most female-oriented occupations are Education, Arts & Media (100.0%), Legal Services & Support (100.0%), and Arts, Media & Entertainment (100.0%).
| Occupation | Male | Female |
| Management | 362 (70.8%) | 149 (29.2%) |
| Business & Financial | 185 (54.2%) | 156 (45.8%) |
| Computers, Engineering & Science | 281 (65.2%) | 150 (34.8%) |
| Computers & Mathematics | 118 (68.6%) | 54 (31.4%) |
| Architecture & Engineering | 163 (62.9%) | 96 (37.1%) |
| Life, Physical & Social Science | 0 (0.0%) | 0 (0.0%) |
| Community & Social Service | 89 (14.5%) | 525 (85.5%) |
| Education, Arts & Media | 0 (0.0%) | 93 (100.0%) |
| Legal Services & Support | 0 (0.0%) | 13 (100.0%) |
| Education Instruction & Library | 89 (18.0%) | 404 (82.0%) |
| Arts, Media & Entertainment | 0 (0.0%) | 15 (100.0%) |
| Health Diagnosing & Treating | 10 (3.1%) | 315 (96.9%) |
| Health Technologists | 10 (5.9%) | 158 (94.1%) |
| Total (Category) | 927 (41.7%) | 1,295 (58.3%) |
| Total (Overall) | 4,534 (61.2%) | 2,879 (38.8%) |
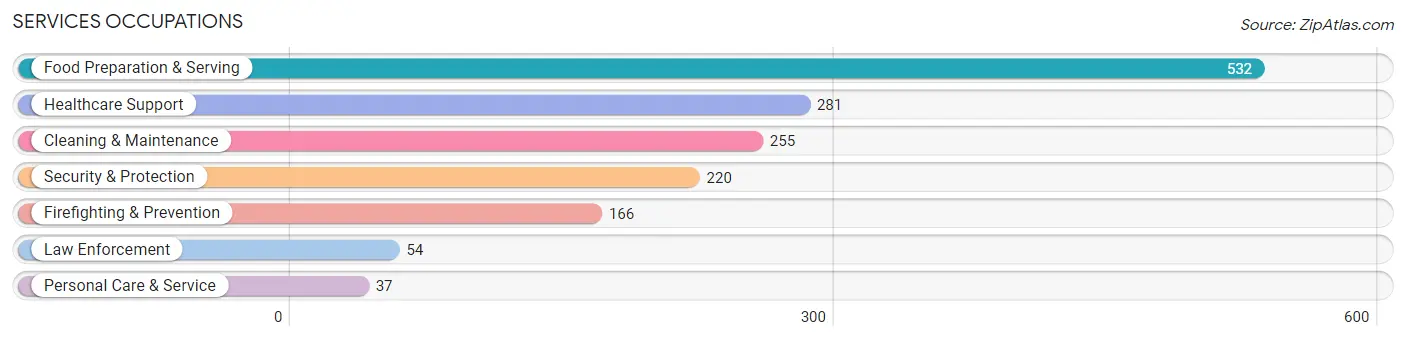
Services Occupations
The most common Services occupations in Salida are Food Preparation & Serving (532 | 7.2%), Healthcare Support (281 | 3.8%), Cleaning & Maintenance (255 | 3.4%), Security & Protection (220 | 3.0%), and Firefighting & Prevention (166 | 2.2%).
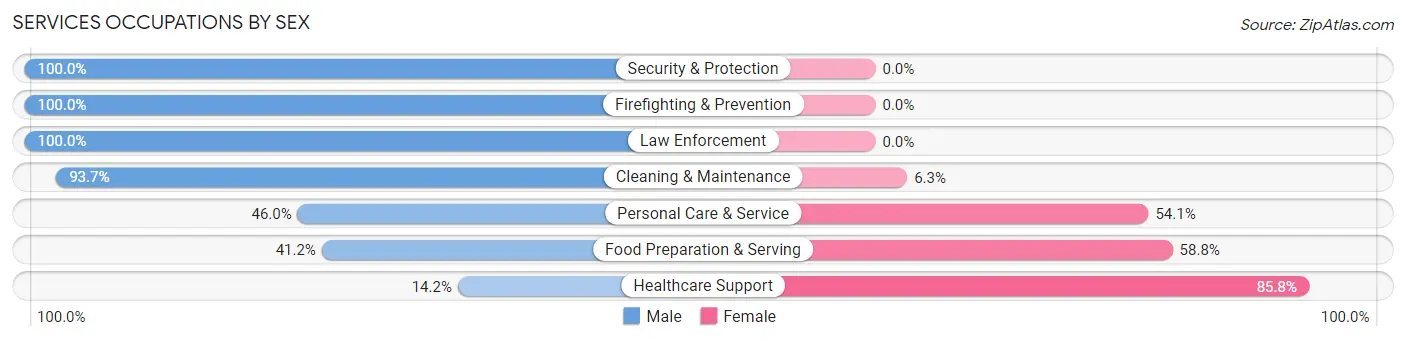
Services Occupations by Sex
Within the Services occupations in Salida, the most male-oriented occupations are Security & Protection (100.0%), Firefighting & Prevention (100.0%), and Law Enforcement (100.0%), while the most female-oriented occupations are Healthcare Support (85.8%), Food Preparation & Serving (58.8%), and Personal Care & Service (54.0%).
| Occupation | Male | Female |
| Healthcare Support | 40 (14.2%) | 241 (85.8%) |
| Security & Protection | 220 (100.0%) | 0 (0.0%) |
| Firefighting & Prevention | 166 (100.0%) | 0 (0.0%) |
| Law Enforcement | 54 (100.0%) | 0 (0.0%) |
| Food Preparation & Serving | 219 (41.2%) | 313 (58.8%) |
| Cleaning & Maintenance | 239 (93.7%) | 16 (6.3%) |
| Personal Care & Service | 17 (46.0%) | 20 (54.0%) |
| Total (Category) | 735 (55.5%) | 590 (44.5%) |
| Total (Overall) | 4,534 (61.2%) | 2,879 (38.8%) |
Sales and Office Occupations
The most common Sales and Office occupations in Salida are Office & Administration (856 | 11.6%), and Sales & Related (676 | 9.1%).
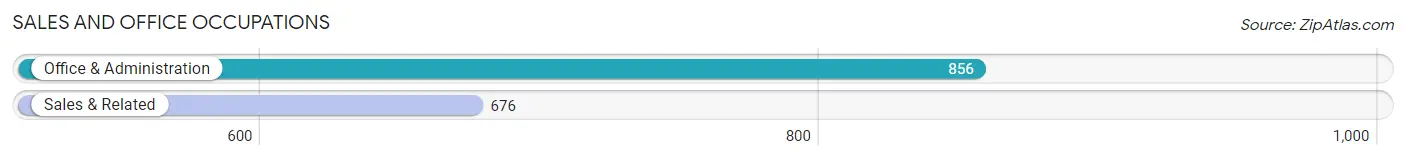
Sales and Office Occupations by Sex
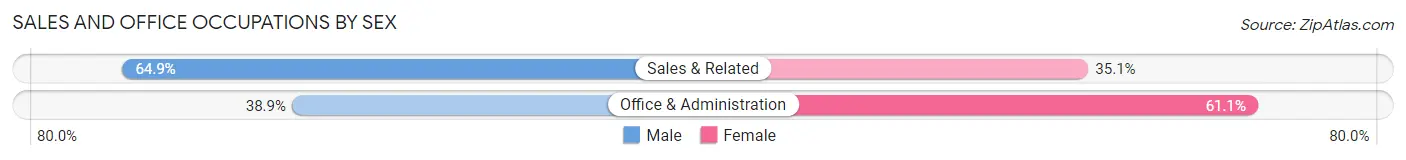
| Occupation | Male | Female |
| Sales & Related | 439 (64.9%) | 237 (35.1%) |
| Office & Administration | 333 (38.9%) | 523 (61.1%) |
| Total (Category) | 772 (50.4%) | 760 (49.6%) |
| Total (Overall) | 4,534 (61.2%) | 2,879 (38.8%) |
Natural Resources, Construction and Maintenance Occupations
The most common Natural Resources, Construction and Maintenance occupations in Salida are Construction & Extraction (713 | 9.6%), Installation, Maintenance & Repair (450 | 6.1%), and Farming, Fishing & Forestry (181 | 2.4%).
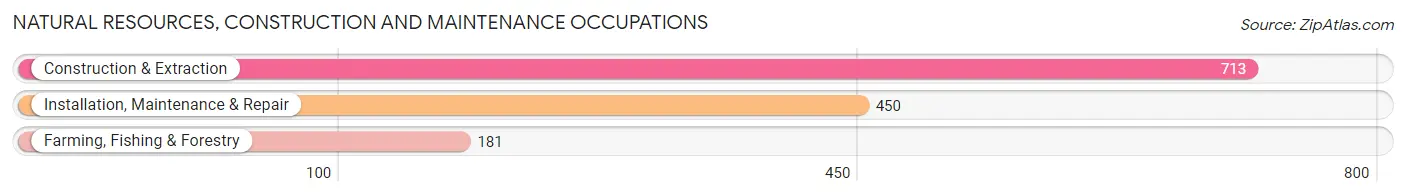
Natural Resources, Construction and Maintenance Occupations by Sex
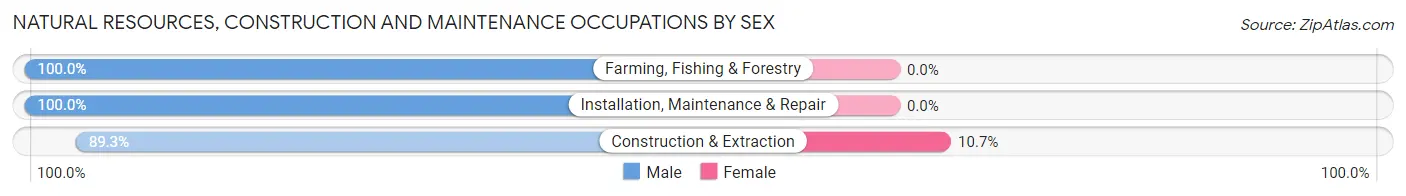
| Occupation | Male | Female |
| Farming, Fishing & Forestry | 181 (100.0%) | 0 (0.0%) |
| Construction & Extraction | 637 (89.3%) | 76 (10.7%) |
| Installation, Maintenance & Repair | 450 (100.0%) | 0 (0.0%) |
| Total (Category) | 1,268 (94.4%) | 76 (5.7%) |
| Total (Overall) | 4,534 (61.2%) | 2,879 (38.8%) |
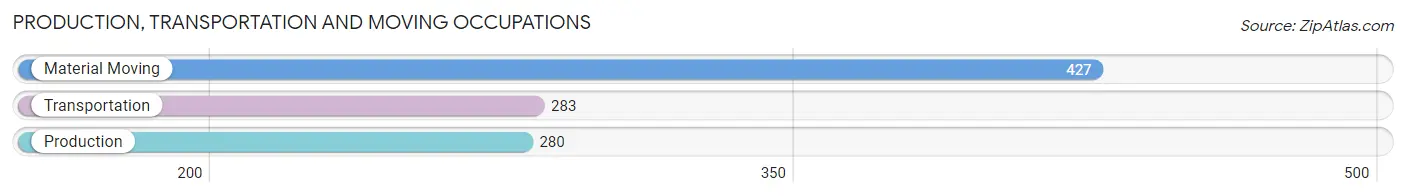
Production, Transportation and Moving Occupations
The most common Production, Transportation and Moving occupations in Salida are Material Moving (427 | 5.8%), Transportation (283 | 3.8%), and Production (280 | 3.8%).
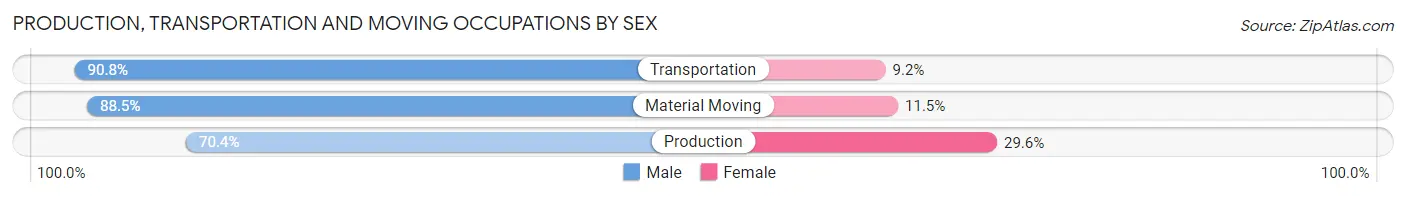
Production, Transportation and Moving Occupations by Sex
| Occupation | Male | Female |
| Production | 197 (70.4%) | 83 (29.6%) |
| Transportation | 257 (90.8%) | 26 (9.2%) |
| Material Moving | 378 (88.5%) | 49 (11.5%) |
| Total (Category) | 832 (84.0%) | 158 (16.0%) |
| Total (Overall) | 4,534 (61.2%) | 2,879 (38.8%) |
Employment Industries by Sex in Salida
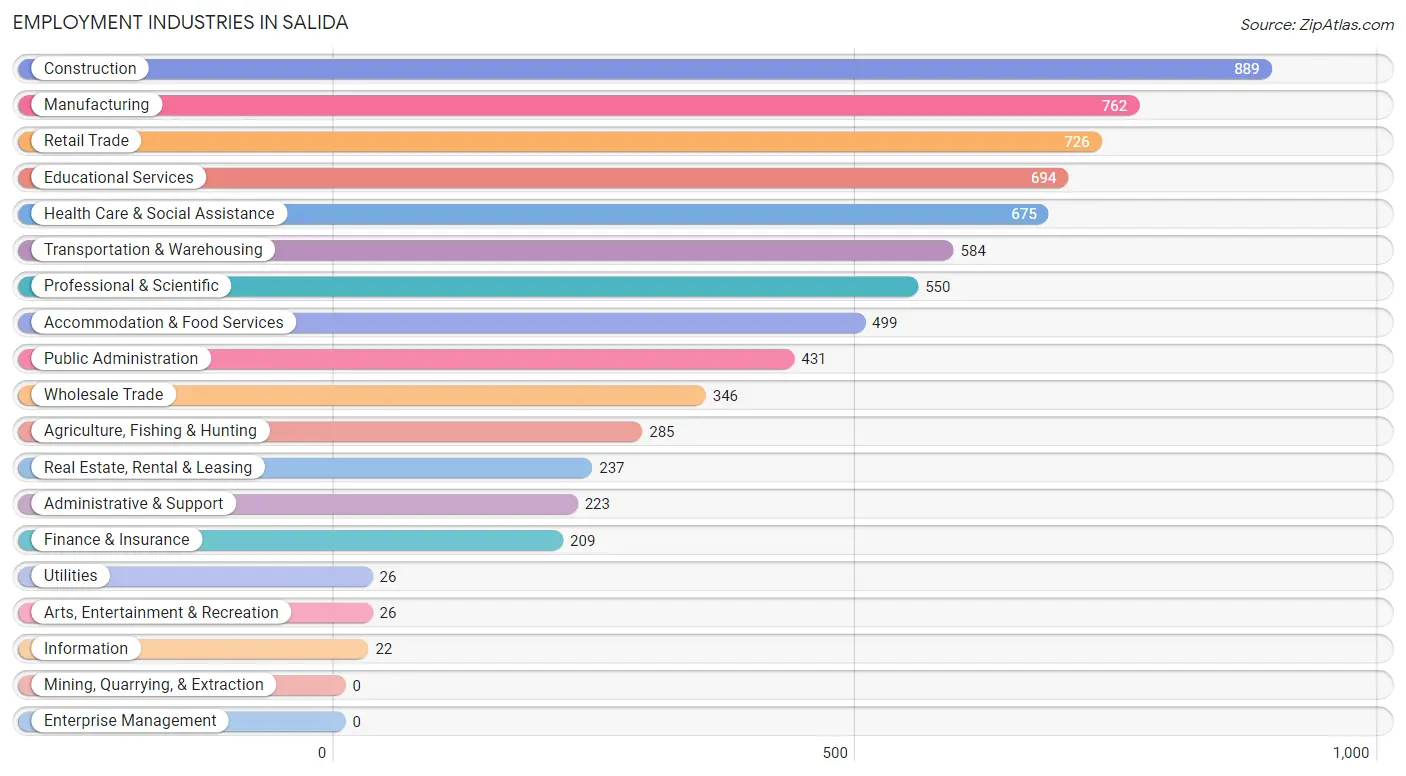
Employment Industries in Salida
The major employment industries in Salida include Construction (889 | 12.0%), Manufacturing (762 | 10.3%), Retail Trade (726 | 9.8%), Educational Services (694 | 9.4%), and Health Care & Social Assistance (675 | 9.1%).
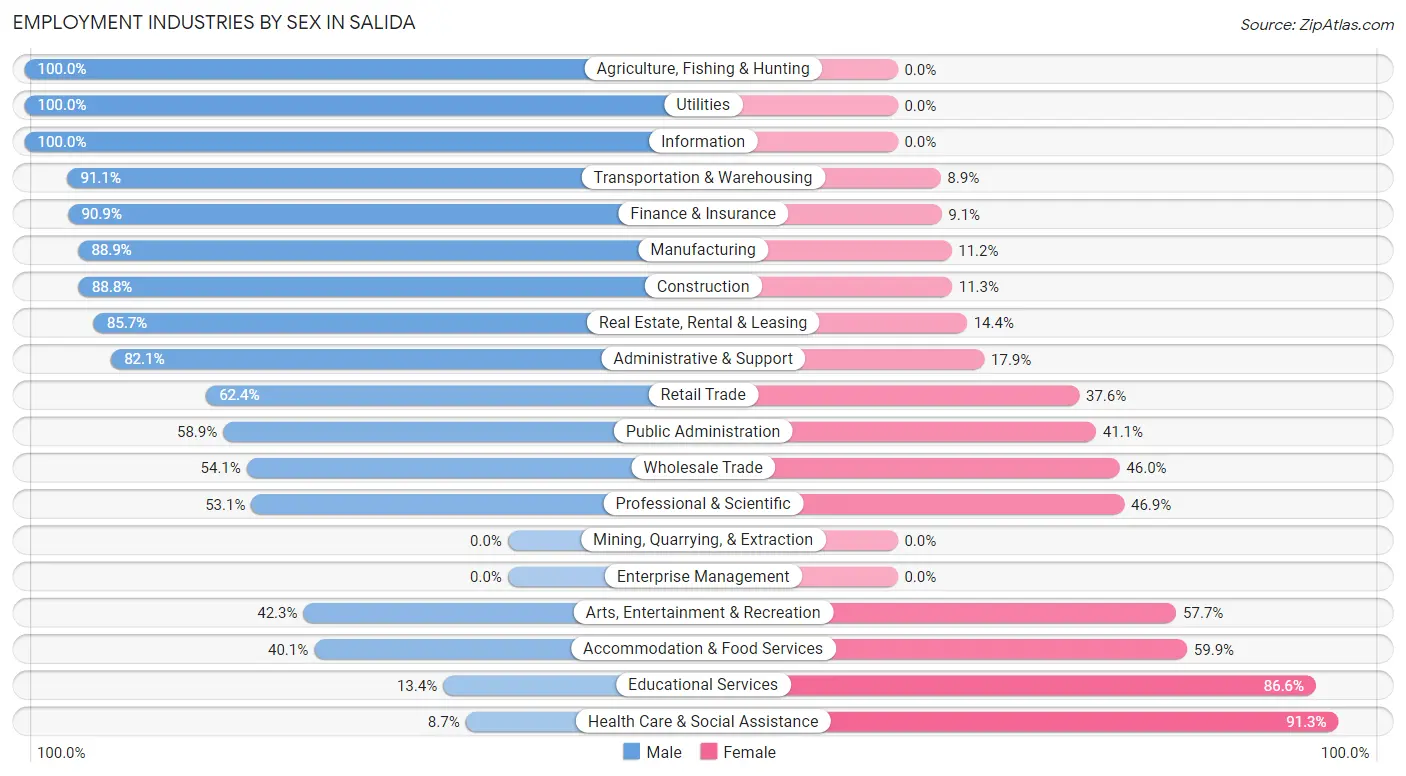
Employment Industries by Sex in Salida
The Salida industries that see more men than women are Agriculture, Fishing & Hunting (100.0%), Utilities (100.0%), and Information (100.0%), whereas the industries that tend to have a higher number of women are Health Care & Social Assistance (91.3%), Educational Services (86.6%), and Accommodation & Food Services (59.9%).
| Industry | Male | Female |
| Agriculture, Fishing & Hunting | 285 (100.0%) | 0 (0.0%) |
| Mining, Quarrying, & Extraction | 0 (0.0%) | 0 (0.0%) |
| Construction | 789 (88.7%) | 100 (11.3%) |
| Manufacturing | 677 (88.8%) | 85 (11.2%) |
| Wholesale Trade | 187 (54.0%) | 159 (46.0%) |
| Retail Trade | 453 (62.4%) | 273 (37.6%) |
| Transportation & Warehousing | 532 (91.1%) | 52 (8.9%) |
| Utilities | 26 (100.0%) | 0 (0.0%) |
| Information | 22 (100.0%) | 0 (0.0%) |
| Finance & Insurance | 190 (90.9%) | 19 (9.1%) |
| Real Estate, Rental & Leasing | 203 (85.7%) | 34 (14.3%) |
| Professional & Scientific | 292 (53.1%) | 258 (46.9%) |
| Enterprise Management | 0 (0.0%) | 0 (0.0%) |
| Administrative & Support | 183 (82.1%) | 40 (17.9%) |
| Educational Services | 93 (13.4%) | 601 (86.6%) |
| Health Care & Social Assistance | 59 (8.7%) | 616 (91.3%) |
| Arts, Entertainment & Recreation | 11 (42.3%) | 15 (57.7%) |
| Accommodation & Food Services | 200 (40.1%) | 299 (59.9%) |
| Public Administration | 254 (58.9%) | 177 (41.1%) |
| Total | 4,534 (61.2%) | 2,879 (38.8%) |
Education in Salida
School Enrollment in Salida
The most common levels of schooling among the 4,022 students in Salida are college / undergraduate (1,498 | 37.2%), middle school (892 | 22.2%), and elementary school (616 | 15.3%).
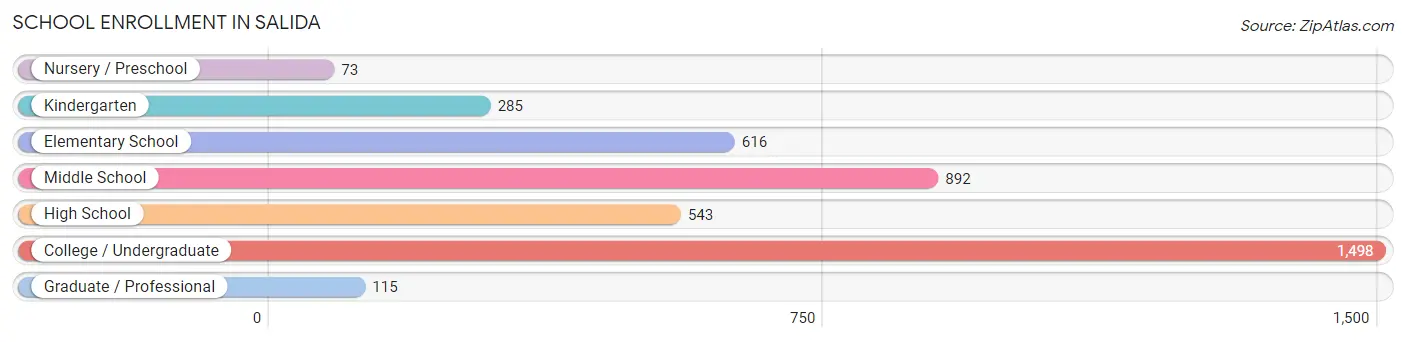
| School Level | # Students | % Students |
| Nursery / Preschool | 73 | 1.8% |
| Kindergarten | 285 | 7.1% |
| Elementary School | 616 | 15.3% |
| Middle School | 892 | 22.2% |
| High School | 543 | 13.5% |
| College / Undergraduate | 1,498 | 37.2% |
| Graduate / Professional | 115 | 2.9% |
| Total | 4,022 | 100.0% |
School Enrollment by Age by Funding Source in Salida
Out of a total of 4,022 students who are enrolled in schools in Salida, 374 (9.3%) attend a private institution, while the remaining 3,648 (90.7%) are enrolled in public schools. The age group of 35 years and over has the highest likelihood of being enrolled in private schools, with 53 (22.8% in the age bracket) enrolled. Conversely, the age group of 3 to 4 year olds has the lowest likelihood of being enrolled in a private school, with 128 (100.0% in the age bracket) attending a public institution.
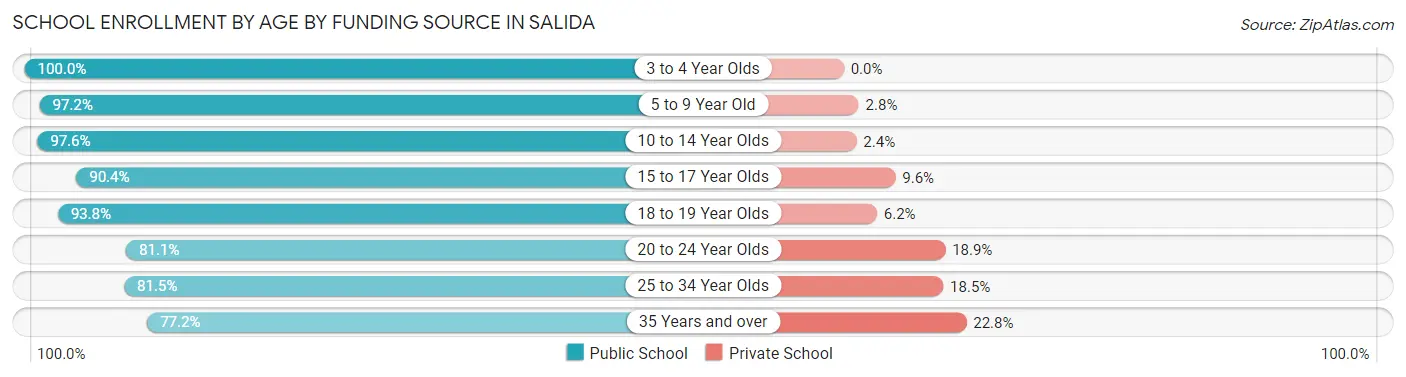
| Age Bracket | Public School | Private School |
| 3 to 4 Year Olds | 128 (100.0%) | 0 (0.0%) |
| 5 to 9 Year Old | 801 (97.2%) | 23 (2.8%) |
| 10 to 14 Year Olds | 948 (97.6%) | 23 (2.4%) |
| 15 to 17 Year Olds | 291 (90.4%) | 31 (9.6%) |
| 18 to 19 Year Olds | 349 (93.8%) | 23 (6.2%) |
| 20 to 24 Year Olds | 553 (81.1%) | 129 (18.9%) |
| 25 to 34 Year Olds | 400 (81.5%) | 91 (18.5%) |
| 35 Years and over | 179 (77.2%) | 53 (22.8%) |
| Total | 3,648 (90.7%) | 374 (9.3%) |
Educational Attainment by Field of Study in Salida
Business (397 | 24.1%), education (307 | 18.6%), engineering (209 | 12.7%), liberal arts & history (170 | 10.3%), and computers & mathematics (115 | 7.0%) are the most common fields of study among 1,647 individuals in Salida who have obtained a bachelor's degree or higher.
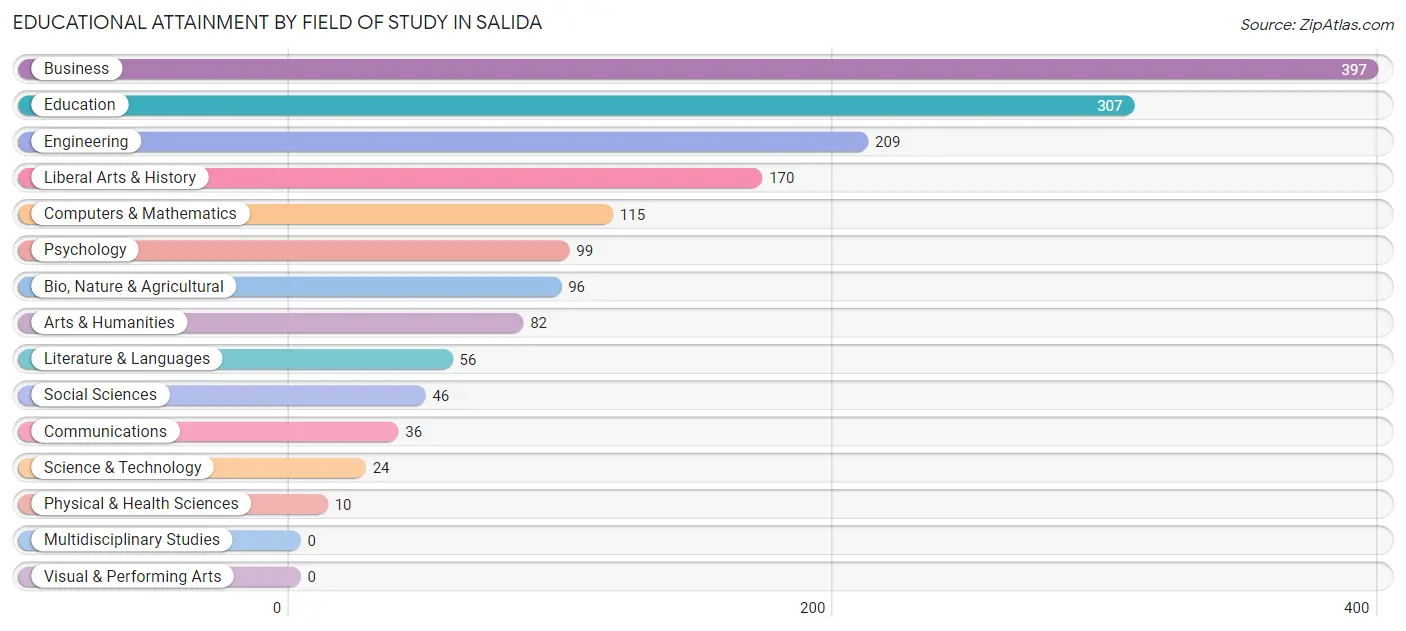
| Field of Study | # Graduates | % Graduates |
| Computers & Mathematics | 115 | 7.0% |
| Bio, Nature & Agricultural | 96 | 5.8% |
| Physical & Health Sciences | 10 | 0.6% |
| Psychology | 99 | 6.0% |
| Social Sciences | 46 | 2.8% |
| Engineering | 209 | 12.7% |
| Multidisciplinary Studies | 0 | 0.0% |
| Science & Technology | 24 | 1.5% |
| Business | 397 | 24.1% |
| Education | 307 | 18.6% |
| Literature & Languages | 56 | 3.4% |
| Liberal Arts & History | 170 | 10.3% |
| Visual & Performing Arts | 0 | 0.0% |
| Communications | 36 | 2.2% |
| Arts & Humanities | 82 | 5.0% |
| Total | 1,647 | 100.0% |
Transportation & Commute in Salida
Vehicle Availability by Sex in Salida
The most prevalent vehicle ownership categories in Salida are males with 3 vehicles (1,581, accounting for 36.1%) and females with 3 vehicles (539, making up 57.5%).
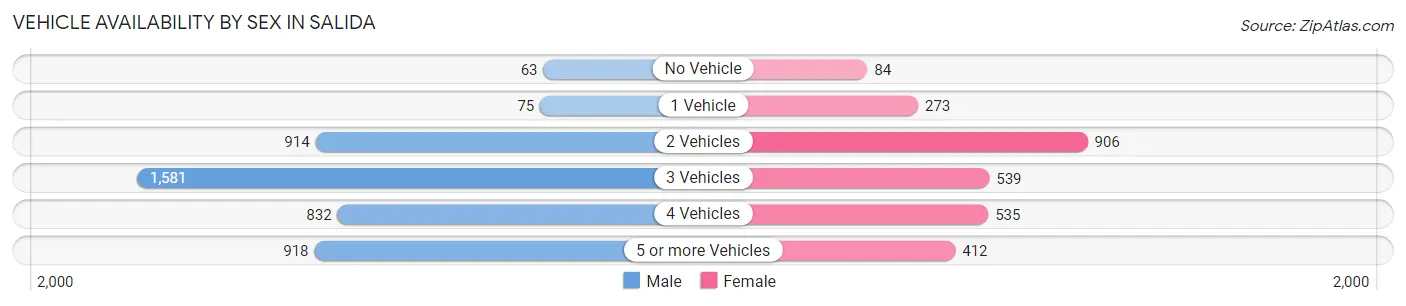
| Vehicles Available | Male | Female |
| No Vehicle | 63 (1.4%) | 84 (3.1%) |
| 1 Vehicle | 75 (1.7%) | 273 (9.9%) |
| 2 Vehicles | 914 (20.8%) | 906 (33.0%) |
| 3 Vehicles | 1,581 (36.1%) | 539 (19.6%) |
| 4 Vehicles | 832 (19.0%) | 535 (19.5%) |
| 5 or more Vehicles | 918 (20.9%) | 412 (15.0%) |
| Total | 4,383 (100.0%) | 2,749 (100.0%) |
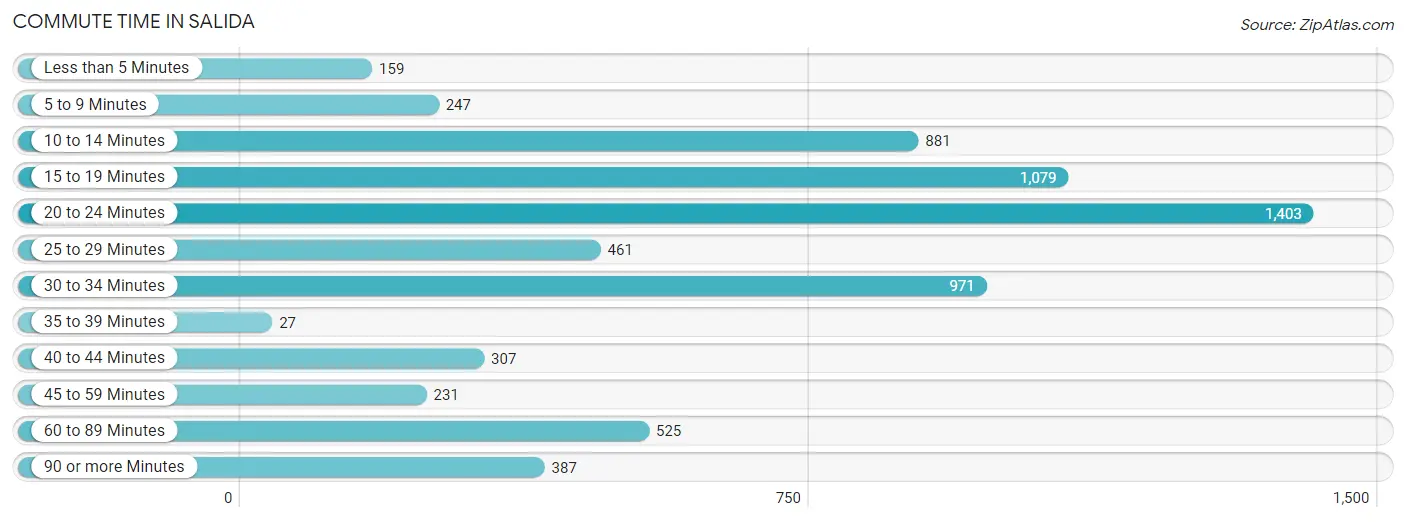
Commute Time in Salida
The most frequently occuring commute durations in Salida are 20 to 24 minutes (1,403 commuters, 21.0%), 15 to 19 minutes (1,079 commuters, 16.2%), and 30 to 34 minutes (971 commuters, 14.5%).
| Commute Time | # Commuters | % Commuters |
| Less than 5 Minutes | 159 | 2.4% |
| 5 to 9 Minutes | 247 | 3.7% |
| 10 to 14 Minutes | 881 | 13.2% |
| 15 to 19 Minutes | 1,079 | 16.2% |
| 20 to 24 Minutes | 1,403 | 21.0% |
| 25 to 29 Minutes | 461 | 6.9% |
| 30 to 34 Minutes | 971 | 14.5% |
| 35 to 39 Minutes | 27 | 0.4% |
| 40 to 44 Minutes | 307 | 4.6% |
| 45 to 59 Minutes | 231 | 3.5% |
| 60 to 89 Minutes | 525 | 7.9% |
| 90 or more Minutes | 387 | 5.8% |
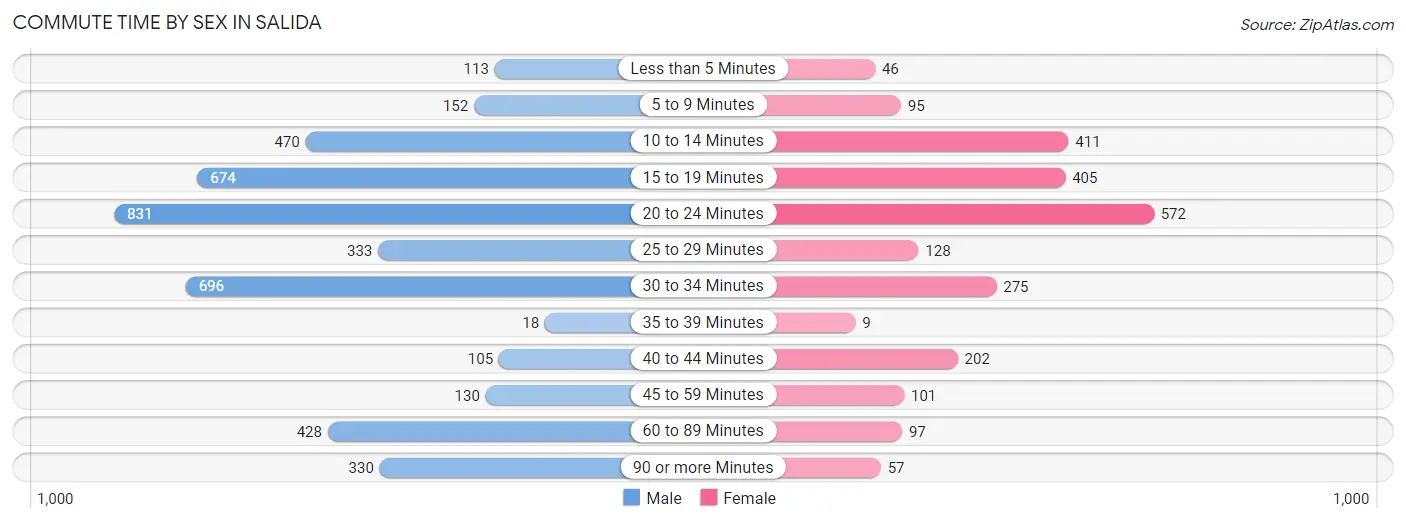
Commute Time by Sex in Salida
The most common commute times in Salida are 20 to 24 minutes (831 commuters, 19.4%) for males and 20 to 24 minutes (572 commuters, 23.8%) for females.
| Commute Time | Male | Female |
| Less than 5 Minutes | 113 (2.6%) | 46 (1.9%) |
| 5 to 9 Minutes | 152 (3.5%) | 95 (4.0%) |
| 10 to 14 Minutes | 470 (11.0%) | 411 (17.1%) |
| 15 to 19 Minutes | 674 (15.8%) | 405 (16.9%) |
| 20 to 24 Minutes | 831 (19.4%) | 572 (23.8%) |
| 25 to 29 Minutes | 333 (7.8%) | 128 (5.3%) |
| 30 to 34 Minutes | 696 (16.3%) | 275 (11.5%) |
| 35 to 39 Minutes | 18 (0.4%) | 9 (0.4%) |
| 40 to 44 Minutes | 105 (2.5%) | 202 (8.4%) |
| 45 to 59 Minutes | 130 (3.0%) | 101 (4.2%) |
| 60 to 89 Minutes | 428 (10.0%) | 97 (4.1%) |
| 90 or more Minutes | 330 (7.7%) | 57 (2.4%) |
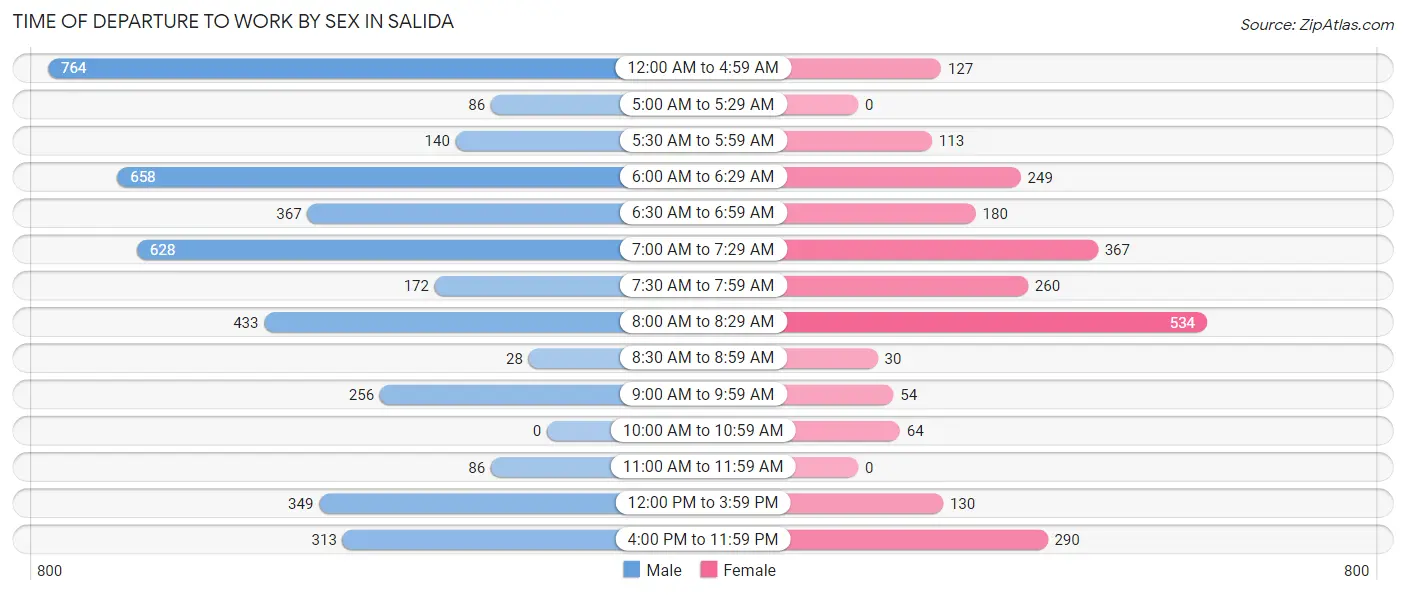
Time of Departure to Work by Sex in Salida
The most frequent times of departure to work in Salida are 12:00 AM to 4:59 AM (764, 17.8%) for males and 8:00 AM to 8:29 AM (534, 22.3%) for females.
| Time of Departure | Male | Female |
| 12:00 AM to 4:59 AM | 764 (17.8%) | 127 (5.3%) |
| 5:00 AM to 5:29 AM | 86 (2.0%) | 0 (0.0%) |
| 5:30 AM to 5:59 AM | 140 (3.3%) | 113 (4.7%) |
| 6:00 AM to 6:29 AM | 658 (15.4%) | 249 (10.4%) |
| 6:30 AM to 6:59 AM | 367 (8.6%) | 180 (7.5%) |
| 7:00 AM to 7:29 AM | 628 (14.7%) | 367 (15.3%) |
| 7:30 AM to 7:59 AM | 172 (4.0%) | 260 (10.8%) |
| 8:00 AM to 8:29 AM | 433 (10.1%) | 534 (22.3%) |
| 8:30 AM to 8:59 AM | 28 (0.6%) | 30 (1.3%) |
| 9:00 AM to 9:59 AM | 256 (6.0%) | 54 (2.2%) |
| 10:00 AM to 10:59 AM | 0 (0.0%) | 64 (2.7%) |
| 11:00 AM to 11:59 AM | 86 (2.0%) | 0 (0.0%) |
| 12:00 PM to 3:59 PM | 349 (8.2%) | 130 (5.4%) |
| 4:00 PM to 11:59 PM | 313 (7.3%) | 290 (12.1%) |
| Total | 4,280 (100.0%) | 2,398 (100.0%) |
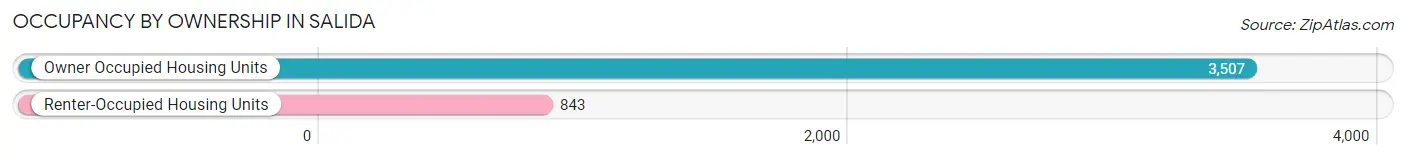
Housing Occupancy in Salida
Occupancy by Ownership in Salida
Of the total 4,350 dwellings in Salida, owner-occupied units account for 3,507 (80.6%), while renter-occupied units make up 843 (19.4%).
| Occupancy | # Housing Units | % Housing Units |
| Owner Occupied Housing Units | 3,507 | 80.6% |
| Renter-Occupied Housing Units | 843 | 19.4% |
| Total Occupied Housing Units | 4,350 | 100.0% |
Occupancy by Household Size in Salida
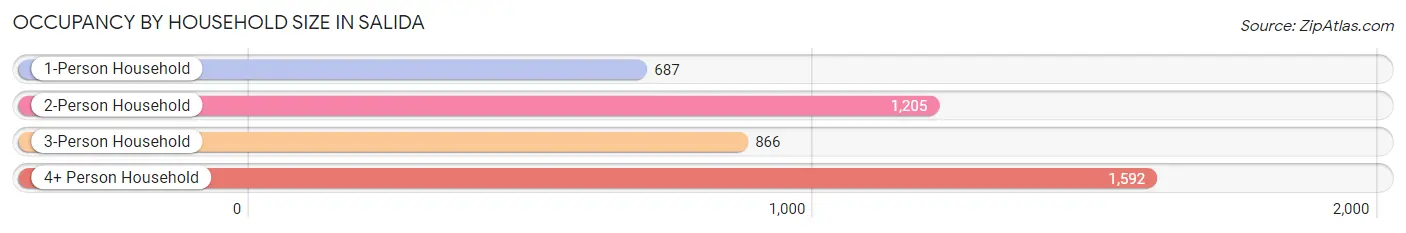
| Household Size | # Housing Units | % Housing Units |
| 1-Person Household | 687 | 15.8% |
| 2-Person Household | 1,205 | 27.7% |
| 3-Person Household | 866 | 19.9% |
| 4+ Person Household | 1,592 | 36.6% |
| Total Housing Units | 4,350 | 100.0% |
Occupancy by Ownership by Household Size in Salida
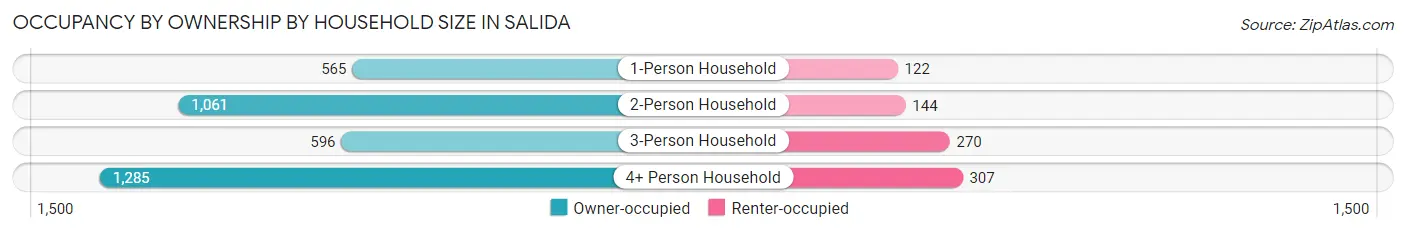
| Household Size | Owner-occupied | Renter-occupied |
| 1-Person Household | 565 (82.2%) | 122 (17.8%) |
| 2-Person Household | 1,061 (88.0%) | 144 (11.9%) |
| 3-Person Household | 596 (68.8%) | 270 (31.2%) |
| 4+ Person Household | 1,285 (80.7%) | 307 (19.3%) |
| Total Housing Units | 3,507 (80.6%) | 843 (19.4%) |
Occupancy by Educational Attainment in Salida
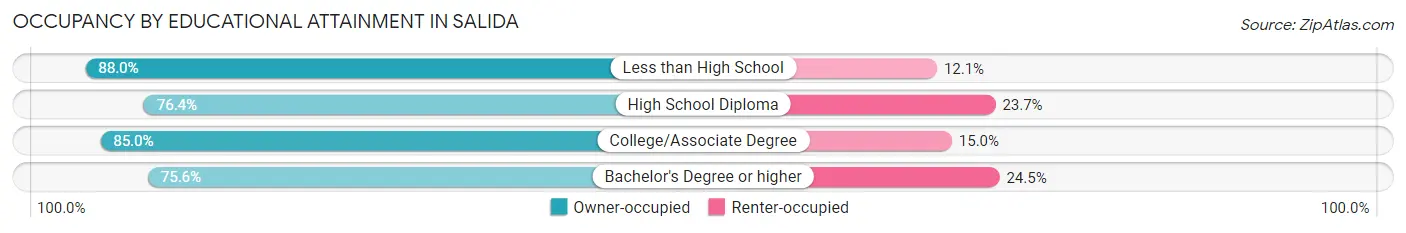
| Household Size | Owner-occupied | Renter-occupied |
| Less than High School | 489 (87.9%) | 67 (12.0%) |
| High School Diploma | 1,256 (76.3%) | 389 (23.6%) |
| College/Associate Degree | 1,246 (85.0%) | 220 (15.0%) |
| Bachelor's Degree or higher | 516 (75.5%) | 167 (24.4%) |
Occupancy by Age of Householder in Salida
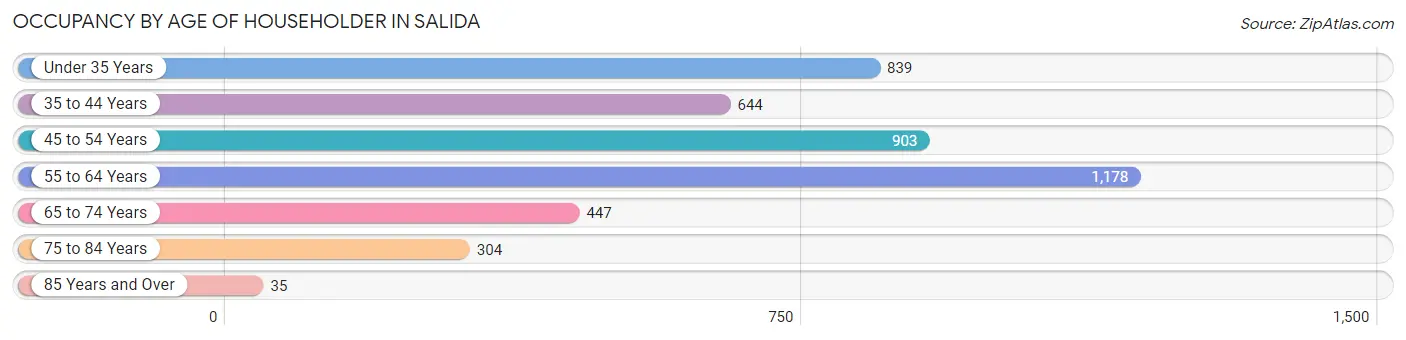
| Age Bracket | # Households | % Households |
| Under 35 Years | 839 | 19.3% |
| 35 to 44 Years | 644 | 14.8% |
| 45 to 54 Years | 903 | 20.8% |
| 55 to 64 Years | 1,178 | 27.1% |
| 65 to 74 Years | 447 | 10.3% |
| 75 to 84 Years | 304 | 7.0% |
| 85 Years and Over | 35 | 0.8% |
| Total | 4,350 | 100.0% |
Housing Finances in Salida
Median Income by Occupancy in Salida
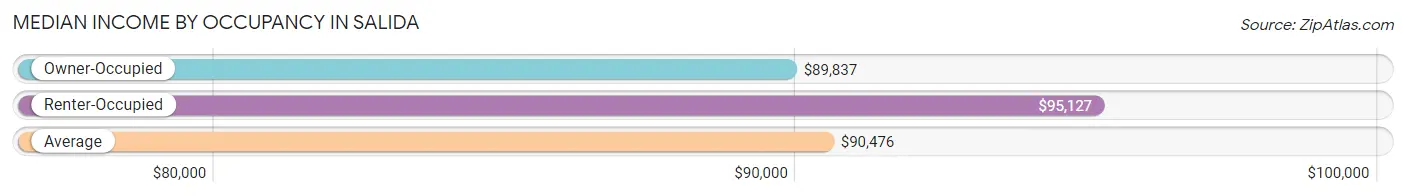
| Occupancy Type | # Households | Median Income |
| Owner-Occupied | 3,507 (80.6%) | $89,837 |
| Renter-Occupied | 843 (19.4%) | $95,127 |
| Average | 4,350 (100.0%) | $90,476 |
Occupancy by Householder Income Bracket in Salida
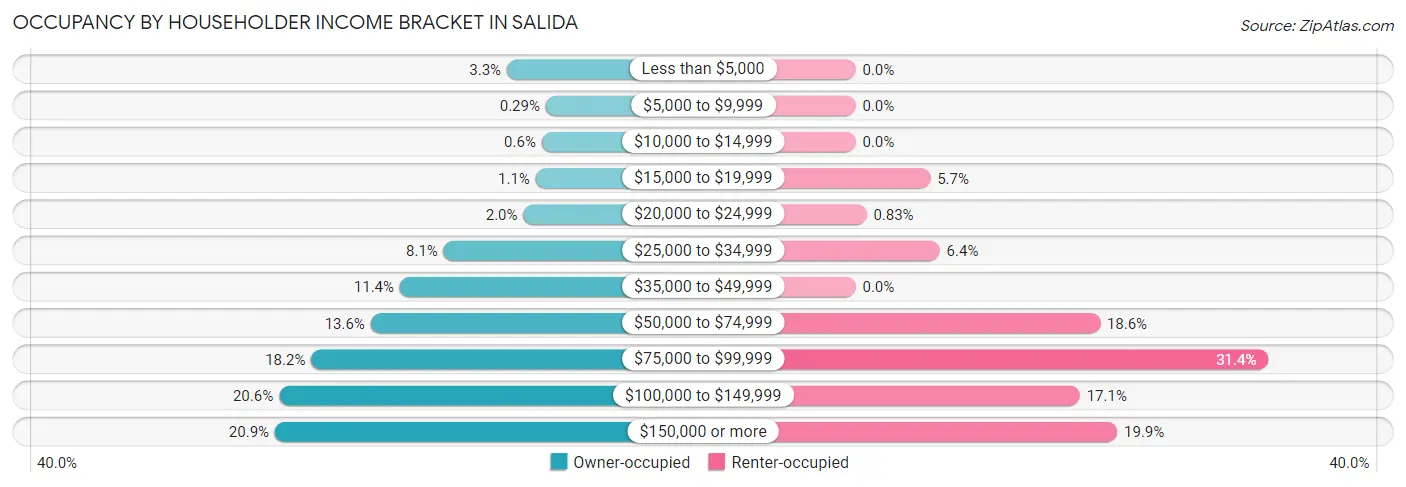
| Income Bracket | Owner-occupied | Renter-occupied |
| Less than $5,000 | 114 (3.3%) | 0 (0.0%) |
| $5,000 to $9,999 | 10 (0.3%) | 0 (0.0%) |
| $10,000 to $14,999 | 21 (0.6%) | 0 (0.0%) |
| $15,000 to $19,999 | 37 (1.1%) | 48 (5.7%) |
| $20,000 to $24,999 | 70 (2.0%) | 7 (0.8%) |
| $25,000 to $34,999 | 283 (8.1%) | 54 (6.4%) |
| $35,000 to $49,999 | 400 (11.4%) | 0 (0.0%) |
| $50,000 to $74,999 | 478 (13.6%) | 157 (18.6%) |
| $75,000 to $99,999 | 637 (18.2%) | 265 (31.4%) |
| $100,000 to $149,999 | 723 (20.6%) | 144 (17.1%) |
| $150,000 or more | 734 (20.9%) | 168 (19.9%) |
| Total | 3,507 (100.0%) | 843 (100.0%) |
Monthly Housing Cost Tiers in Salida
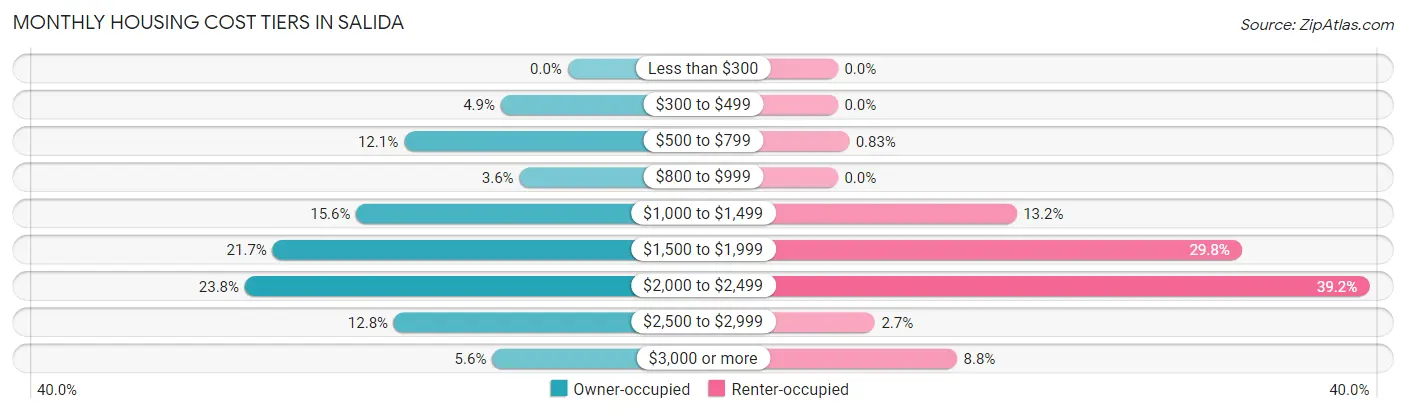
| Monthly Cost | Owner-occupied | Renter-occupied |
| Less than $300 | 0 (0.0%) | 0 (0.0%) |
| $300 to $499 | 173 (4.9%) | 0 (0.0%) |
| $500 to $799 | 423 (12.1%) | 7 (0.8%) |
| $800 to $999 | 125 (3.6%) | 0 (0.0%) |
| $1,000 to $1,499 | 546 (15.6%) | 111 (13.2%) |
| $1,500 to $1,999 | 762 (21.7%) | 251 (29.8%) |
| $2,000 to $2,499 | 834 (23.8%) | 330 (39.2%) |
| $2,500 to $2,999 | 449 (12.8%) | 23 (2.7%) |
| $3,000 or more | 195 (5.6%) | 74 (8.8%) |
| Total | 3,507 (100.0%) | 843 (100.0%) |
Physical Housing Characteristics in Salida
Housing Structures in Salida
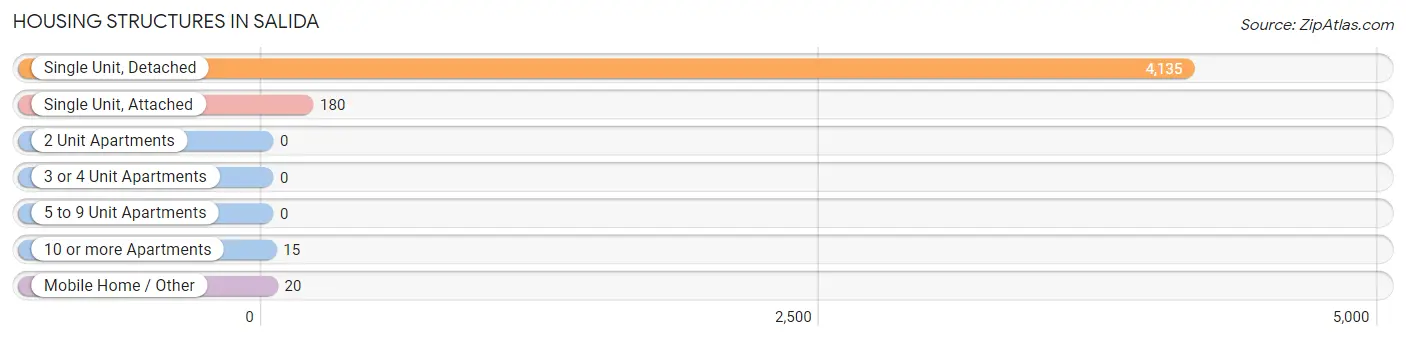
| Structure Type | # Housing Units | % Housing Units |
| Single Unit, Detached | 4,135 | 95.1% |
| Single Unit, Attached | 180 | 4.1% |
| 2 Unit Apartments | 0 | 0.0% |
| 3 or 4 Unit Apartments | 0 | 0.0% |
| 5 to 9 Unit Apartments | 0 | 0.0% |
| 10 or more Apartments | 15 | 0.3% |
| Mobile Home / Other | 20 | 0.5% |
| Total | 4,350 | 100.0% |
Housing Structures by Occupancy in Salida
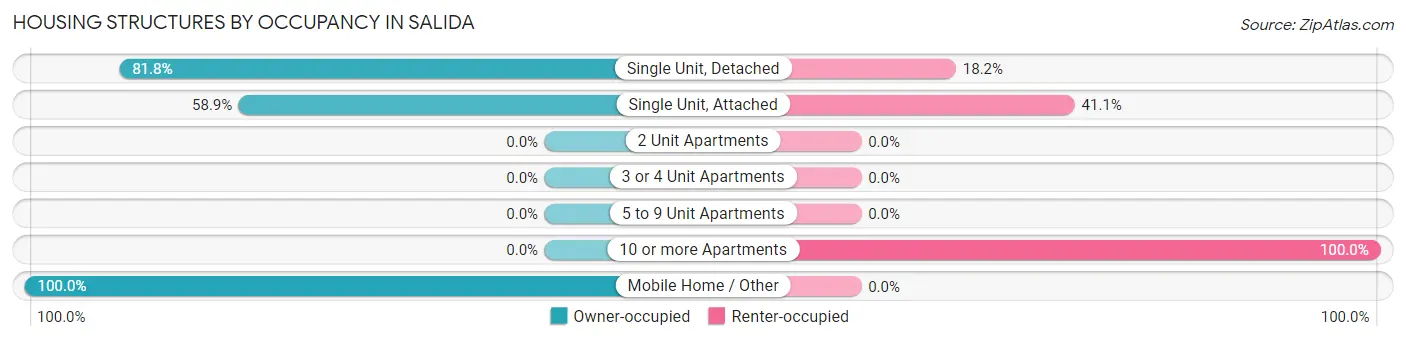
| Structure Type | Owner-occupied | Renter-occupied |
| Single Unit, Detached | 3,381 (81.8%) | 754 (18.2%) |
| Single Unit, Attached | 106 (58.9%) | 74 (41.1%) |
| 2 Unit Apartments | 0 (0.0%) | 0 (0.0%) |
| 3 or 4 Unit Apartments | 0 (0.0%) | 0 (0.0%) |
| 5 to 9 Unit Apartments | 0 (0.0%) | 0 (0.0%) |
| 10 or more Apartments | 0 (0.0%) | 15 (100.0%) |
| Mobile Home / Other | 20 (100.0%) | 0 (0.0%) |
| Total | 3,507 (80.6%) | 843 (19.4%) |
Housing Structures by Number of Rooms in Salida
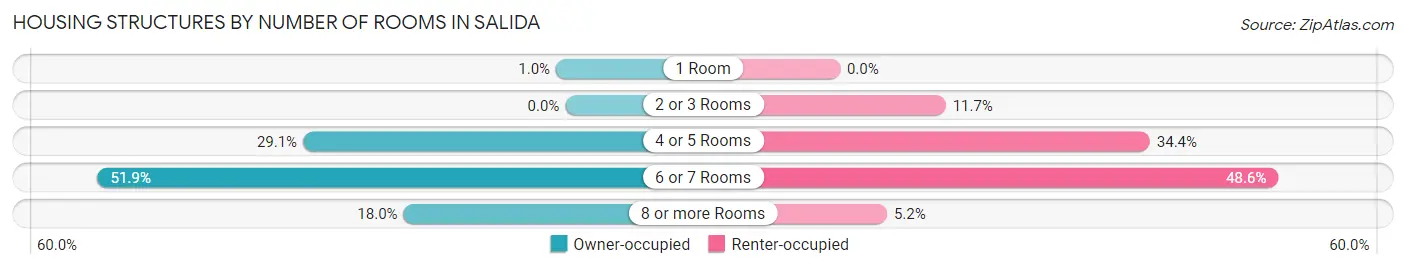
| Number of Rooms | Owner-occupied | Renter-occupied |
| 1 Room | 36 (1.0%) | 0 (0.0%) |
| 2 or 3 Rooms | 0 (0.0%) | 99 (11.7%) |
| 4 or 5 Rooms | 1,021 (29.1%) | 290 (34.4%) |
| 6 or 7 Rooms | 1,820 (51.9%) | 410 (48.6%) |
| 8 or more Rooms | 630 (18.0%) | 44 (5.2%) |
| Total | 3,507 (100.0%) | 843 (100.0%) |
Housing Structure by Heating Type in Salida
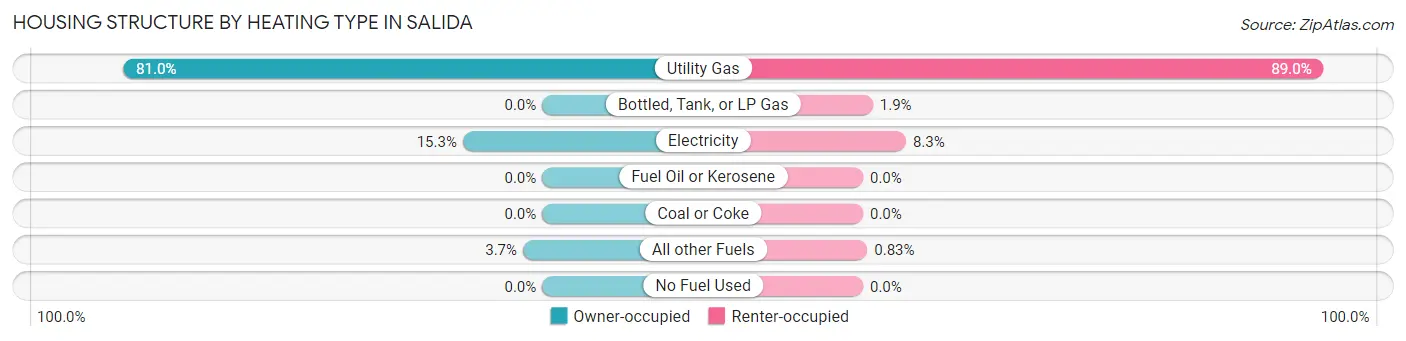
| Heating Type | Owner-occupied | Renter-occupied |
| Utility Gas | 2,839 (80.9%) | 750 (89.0%) |
| Bottled, Tank, or LP Gas | 0 (0.0%) | 16 (1.9%) |
| Electricity | 538 (15.3%) | 70 (8.3%) |
| Fuel Oil or Kerosene | 0 (0.0%) | 0 (0.0%) |
| Coal or Coke | 0 (0.0%) | 0 (0.0%) |
| All other Fuels | 130 (3.7%) | 7 (0.8%) |
| No Fuel Used | 0 (0.0%) | 0 (0.0%) |
| Total | 3,507 (100.0%) | 843 (100.0%) |
Household Vehicle Usage in Salida
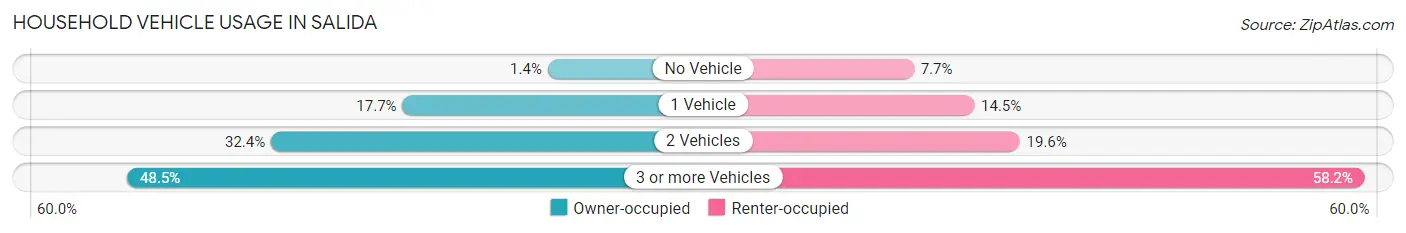
| Vehicles per Household | Owner-occupied | Renter-occupied |
| No Vehicle | 49 (1.4%) | 65 (7.7%) |
| 1 Vehicle | 620 (17.7%) | 122 (14.5%) |
| 2 Vehicles | 1,136 (32.4%) | 165 (19.6%) |
| 3 or more Vehicles | 1,702 (48.5%) | 491 (58.2%) |
| Total | 3,507 (100.0%) | 843 (100.0%) |
Real Estate & Mortgages in Salida
Real Estate and Mortgage Overview in Salida
| Characteristic | Without Mortgage | With Mortgage |
| Housing Units | 720 | 2,787 |
| Median Property Value | $367,100 | $425,400 |
| Median Household Income | $67,848 | $657 |
| Monthly Housing Costs | $594 | $195 |
| Real Estate Taxes | $2,976 | $23 |
Property Value by Mortgage Status in Salida
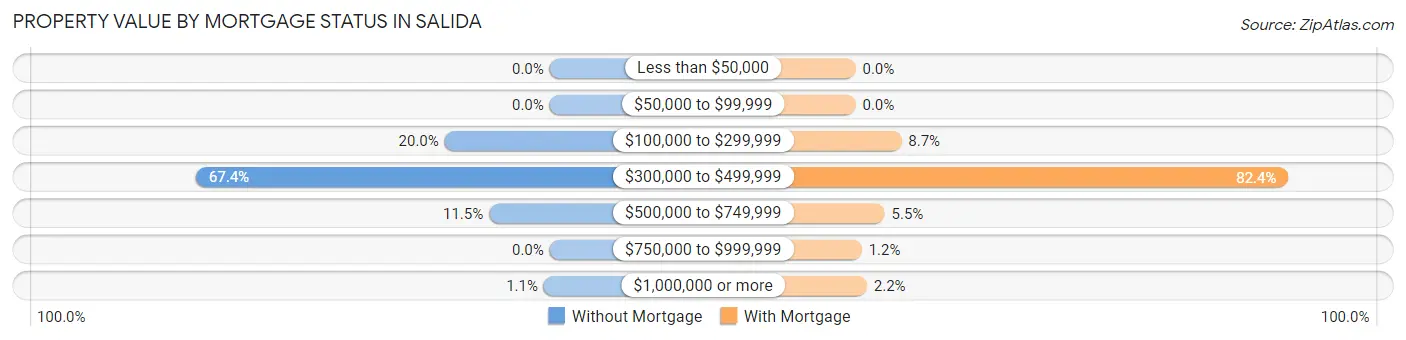
| Property Value | Without Mortgage | With Mortgage |
| Less than $50,000 | 0 (0.0%) | 0 (0.0%) |
| $50,000 to $99,999 | 0 (0.0%) | 0 (0.0%) |
| $100,000 to $299,999 | 144 (20.0%) | 243 (8.7%) |
| $300,000 to $499,999 | 485 (67.4%) | 2,297 (82.4%) |
| $500,000 to $749,999 | 83 (11.5%) | 154 (5.5%) |
| $750,000 to $999,999 | 0 (0.0%) | 33 (1.2%) |
| $1,000,000 or more | 8 (1.1%) | 60 (2.1%) |
| Total | 720 (100.0%) | 2,787 (100.0%) |
Household Income by Mortgage Status in Salida
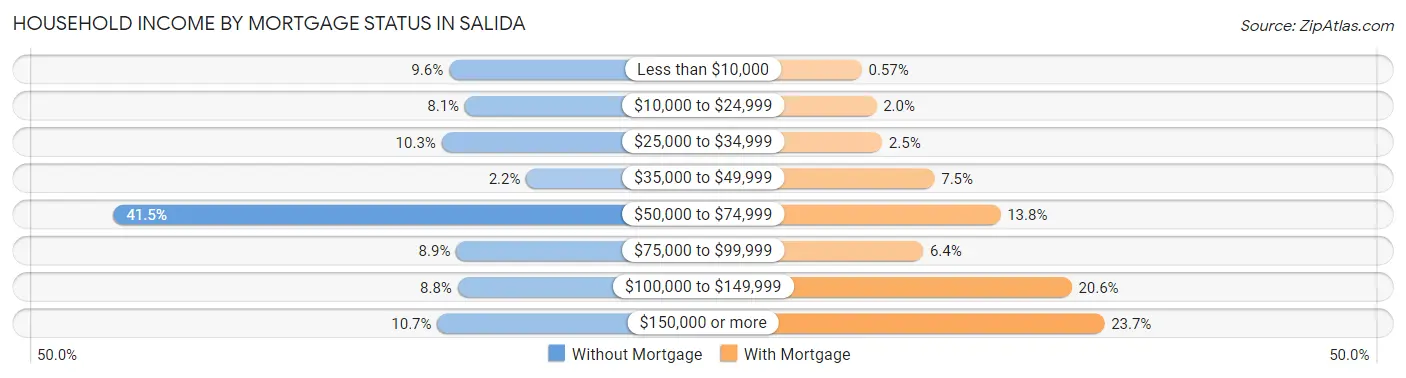
| Household Income | Without Mortgage | With Mortgage |
| Less than $10,000 | 69 (9.6%) | 16 (0.6%) |
| $10,000 to $24,999 | 58 (8.1%) | 55 (2.0%) |
| $25,000 to $34,999 | 74 (10.3%) | 70 (2.5%) |
| $35,000 to $49,999 | 16 (2.2%) | 209 (7.5%) |
| $50,000 to $74,999 | 299 (41.5%) | 384 (13.8%) |
| $75,000 to $99,999 | 64 (8.9%) | 179 (6.4%) |
| $100,000 to $149,999 | 63 (8.7%) | 573 (20.6%) |
| $150,000 or more | 77 (10.7%) | 660 (23.7%) |
| Total | 720 (100.0%) | 2,787 (100.0%) |
Property Value to Household Income Ratio in Salida
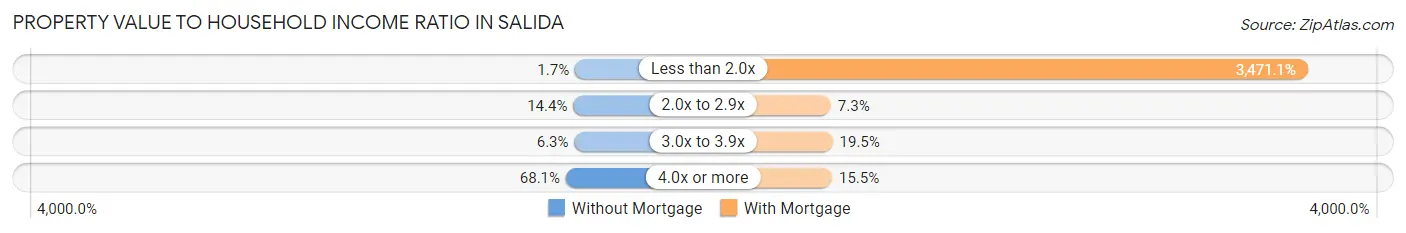
| Value-to-Income Ratio | Without Mortgage | With Mortgage |
| Less than 2.0x | 12 (1.7%) | 96,739 (3,471.1%) |
| 2.0x to 2.9x | 104 (14.4%) | 202 (7.2%) |
| 3.0x to 3.9x | 45 (6.2%) | 543 (19.5%) |
| 4.0x or more | 490 (68.1%) | 431 (15.5%) |
| Total | 720 (100.0%) | 2,787 (100.0%) |
Real Estate Taxes by Mortgage Status in Salida
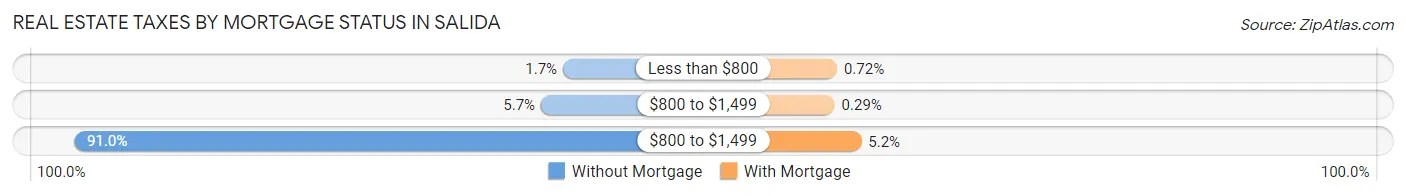
| Property Taxes | Without Mortgage | With Mortgage |
| Less than $800 | 12 (1.7%) | 20 (0.7%) |
| $800 to $1,499 | 41 (5.7%) | 8 (0.3%) |
| $800 to $1,499 | 655 (91.0%) | 144 (5.2%) |
| Total | 720 (100.0%) | 2,787 (100.0%) |
Health & Disability in Salida
Health Insurance Coverage by Age in Salida
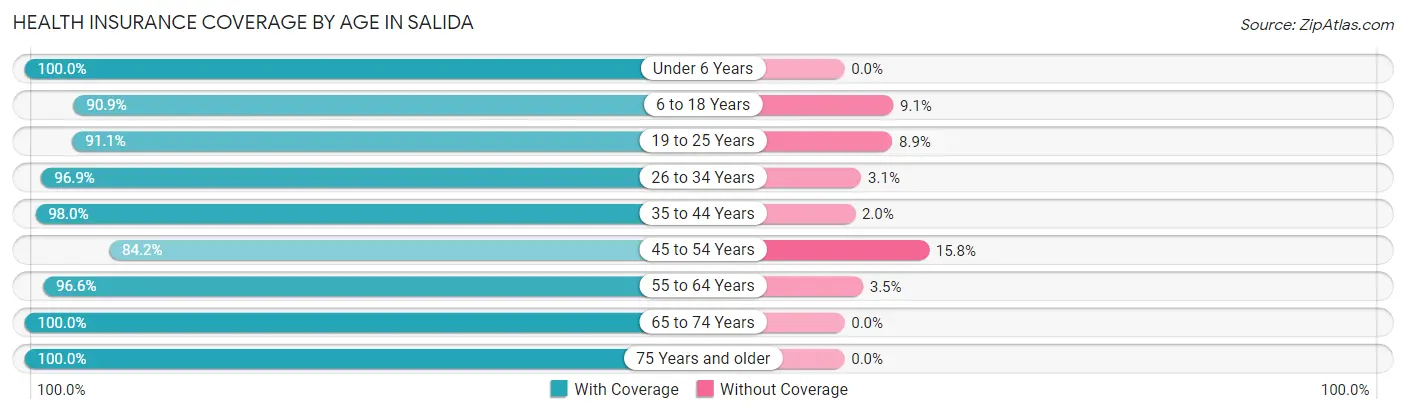
| Age Bracket | With Coverage | Without Coverage |
| Under 6 Years | 1,132 (100.0%) | 0 (0.0%) |
| 6 to 18 Years | 2,217 (90.9%) | 222 (9.1%) |
| 19 to 25 Years | 1,830 (91.1%) | 179 (8.9%) |
| 26 to 34 Years | 2,470 (96.9%) | 80 (3.1%) |
| 35 to 44 Years | 1,427 (98.0%) | 29 (2.0%) |
| 45 to 54 Years | 1,443 (84.2%) | 270 (15.8%) |
| 55 to 64 Years | 1,820 (96.6%) | 65 (3.5%) |
| 65 to 74 Years | 1,062 (100.0%) | 0 (0.0%) |
| 75 Years and older | 603 (100.0%) | 0 (0.0%) |
| Total | 14,004 (94.3%) | 845 (5.7%) |
Health Insurance Coverage by Citizenship Status in Salida
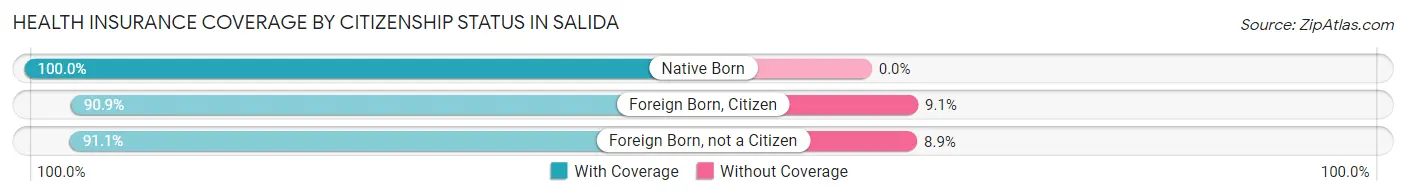
| Citizenship Status | With Coverage | Without Coverage |
| Native Born | 1,132 (100.0%) | 0 (0.0%) |
| Foreign Born, Citizen | 2,217 (90.9%) | 222 (9.1%) |
| Foreign Born, not a Citizen | 1,830 (91.1%) | 179 (8.9%) |
Health Insurance Coverage by Household Income in Salida
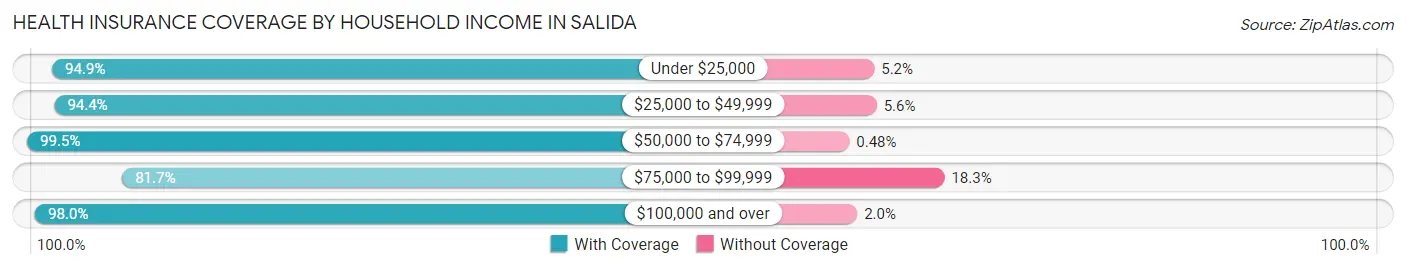
| Household Income | With Coverage | Without Coverage |
| Under $25,000 | 681 (94.9%) | 37 (5.1%) |
| $25,000 to $49,999 | 1,653 (94.4%) | 98 (5.6%) |
| $50,000 to $74,999 | 2,054 (99.5%) | 10 (0.5%) |
| $75,000 to $99,999 | 2,495 (81.7%) | 559 (18.3%) |
| $100,000 and over | 7,050 (98.0%) | 141 (2.0%) |
Public vs Private Health Insurance Coverage by Age in Salida
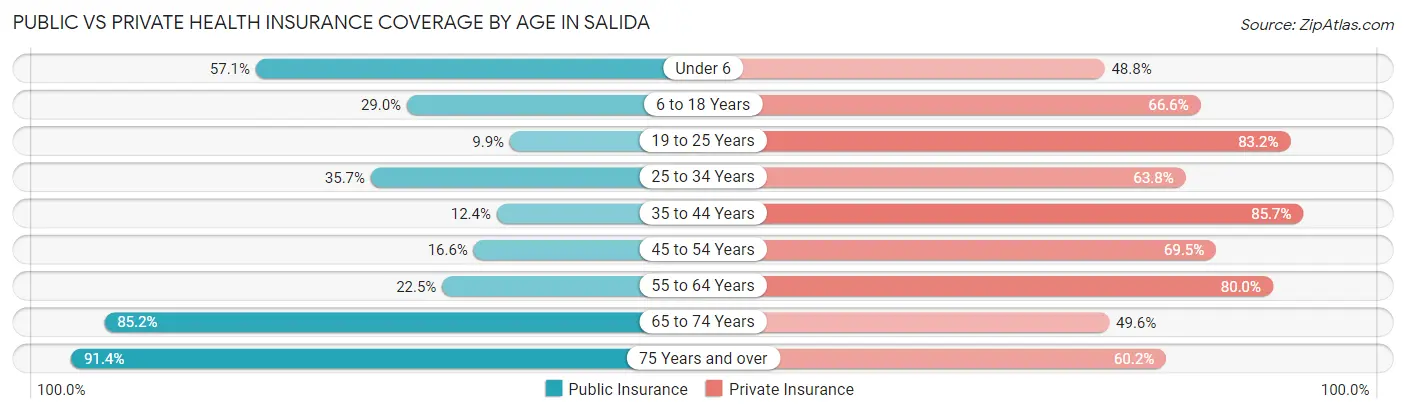
| Age Bracket | Public Insurance | Private Insurance |
| Under 6 | 646 (57.1%) | 552 (48.8%) |
| 6 to 18 Years | 708 (29.0%) | 1,624 (66.6%) |
| 19 to 25 Years | 199 (9.9%) | 1,672 (83.2%) |
| 25 to 34 Years | 911 (35.7%) | 1,627 (63.8%) |
| 35 to 44 Years | 180 (12.4%) | 1,247 (85.7%) |
| 45 to 54 Years | 285 (16.6%) | 1,190 (69.5%) |
| 55 to 64 Years | 424 (22.5%) | 1,508 (80.0%) |
| 65 to 74 Years | 905 (85.2%) | 527 (49.6%) |
| 75 Years and over | 551 (91.4%) | 363 (60.2%) |
| Total | 4,809 (32.4%) | 10,310 (69.4%) |
Disability Status by Sex by Age in Salida
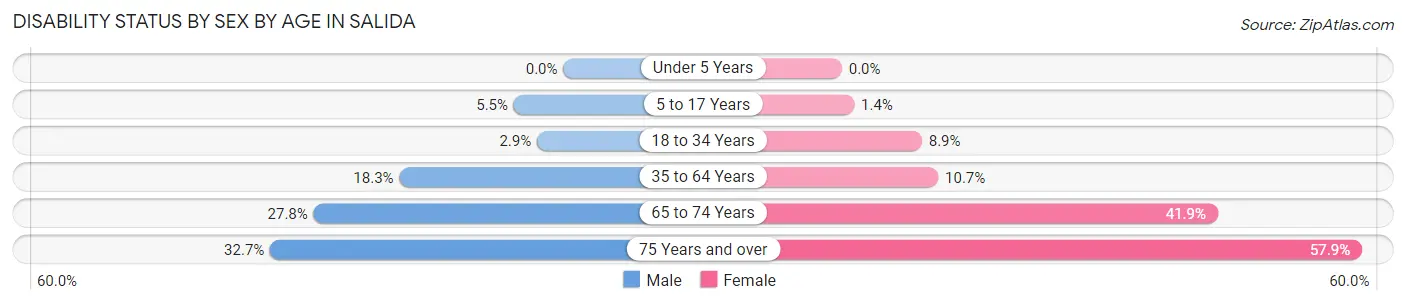
| Age Bracket | Male | Female |
| Under 5 Years | 0 (0.0%) | 0 (0.0%) |
| 5 to 17 Years | 45 (5.5%) | 18 (1.4%) |
| 18 to 34 Years | 76 (2.9%) | 219 (8.9%) |
| 35 to 64 Years | 533 (18.3%) | 229 (10.7%) |
| 65 to 74 Years | 126 (27.8%) | 255 (41.9%) |
| 75 Years and over | 96 (32.7%) | 179 (57.9%) |
Disability Class by Sex by Age in Salida
Disability Class: Hearing Difficulty
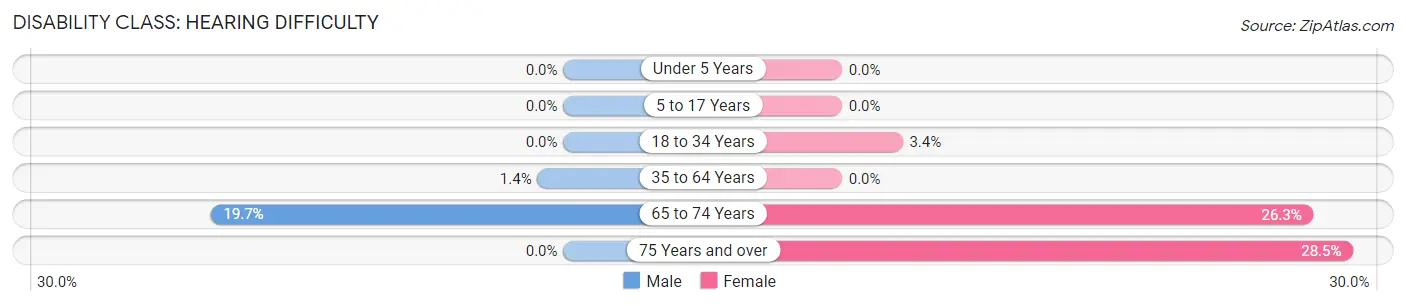
| Age Bracket | Male | Female |
| Under 5 Years | 0 (0.0%) | 0 (0.0%) |
| 5 to 17 Years | 0 (0.0%) | 0 (0.0%) |
| 18 to 34 Years | 0 (0.0%) | 83 (3.4%) |
| 35 to 64 Years | 42 (1.4%) | 0 (0.0%) |
| 65 to 74 Years | 89 (19.7%) | 160 (26.3%) |
| 75 Years and over | 0 (0.0%) | 88 (28.5%) |
Disability Class: Vision Difficulty
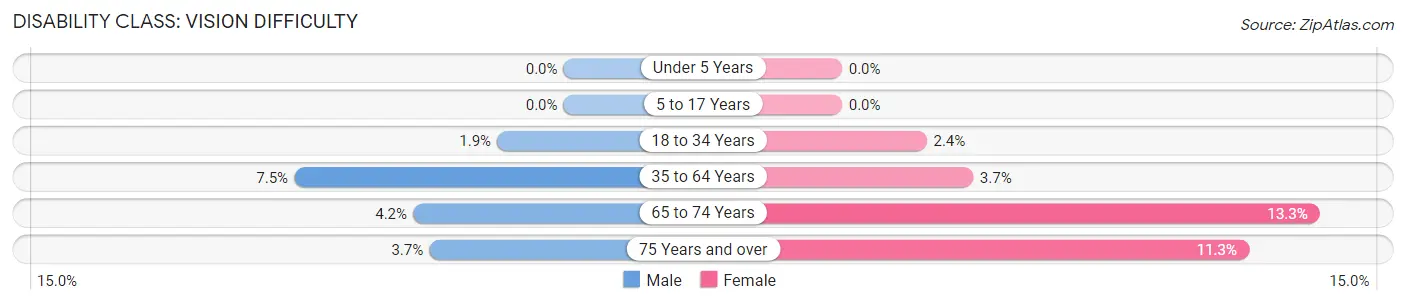
| Age Bracket | Male | Female |
| Under 5 Years | 0 (0.0%) | 0 (0.0%) |
| 5 to 17 Years | 0 (0.0%) | 0 (0.0%) |
| 18 to 34 Years | 48 (1.8%) | 58 (2.4%) |
| 35 to 64 Years | 219 (7.5%) | 78 (3.6%) |
| 65 to 74 Years | 19 (4.2%) | 81 (13.3%) |
| 75 Years and over | 11 (3.7%) | 35 (11.3%) |
Disability Class: Cognitive Difficulty
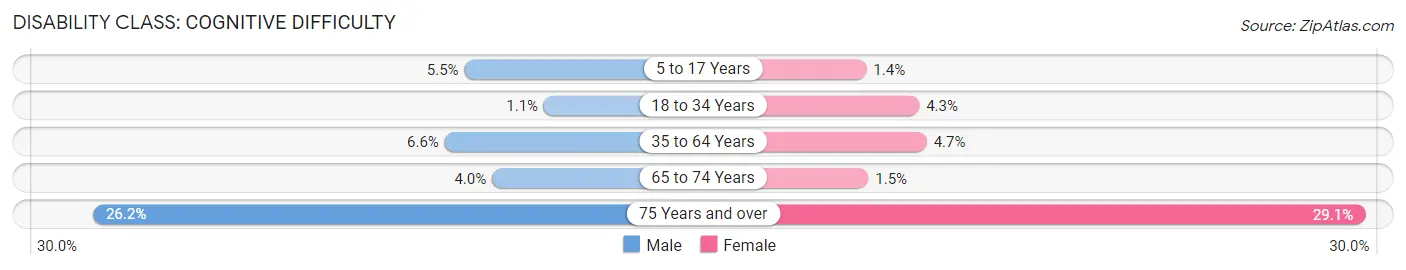
| Age Bracket | Male | Female |
| 5 to 17 Years | 45 (5.5%) | 18 (1.4%) |
| 18 to 34 Years | 28 (1.1%) | 106 (4.3%) |
| 35 to 64 Years | 193 (6.6%) | 101 (4.7%) |
| 65 to 74 Years | 18 (4.0%) | 9 (1.5%) |
| 75 Years and over | 77 (26.2%) | 90 (29.1%) |
Disability Class: Ambulatory Difficulty
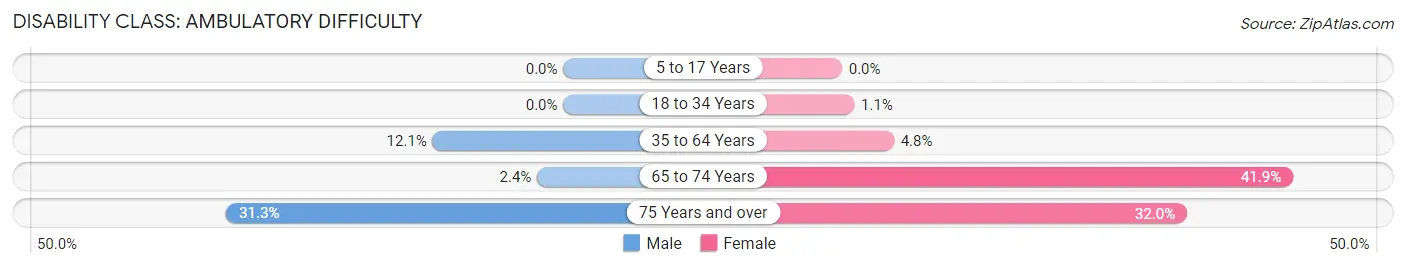
| Age Bracket | Male | Female |
| 5 to 17 Years | 0 (0.0%) | 0 (0.0%) |
| 18 to 34 Years | 0 (0.0%) | 28 (1.1%) |
| 35 to 64 Years | 354 (12.1%) | 103 (4.8%) |
| 65 to 74 Years | 11 (2.4%) | 255 (41.9%) |
| 75 Years and over | 92 (31.3%) | 99 (32.0%) |
Disability Class: Self-Care Difficulty
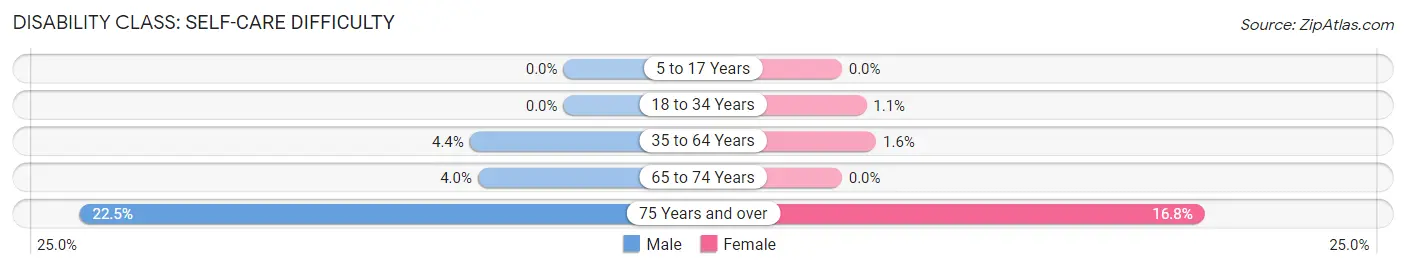
| Age Bracket | Male | Female |
| 5 to 17 Years | 0 (0.0%) | 0 (0.0%) |
| 18 to 34 Years | 0 (0.0%) | 28 (1.1%) |
| 35 to 64 Years | 127 (4.3%) | 34 (1.6%) |
| 65 to 74 Years | 18 (4.0%) | 0 (0.0%) |
| 75 Years and over | 66 (22.5%) | 52 (16.8%) |
Technology Access in Salida
Computing Device Access in Salida
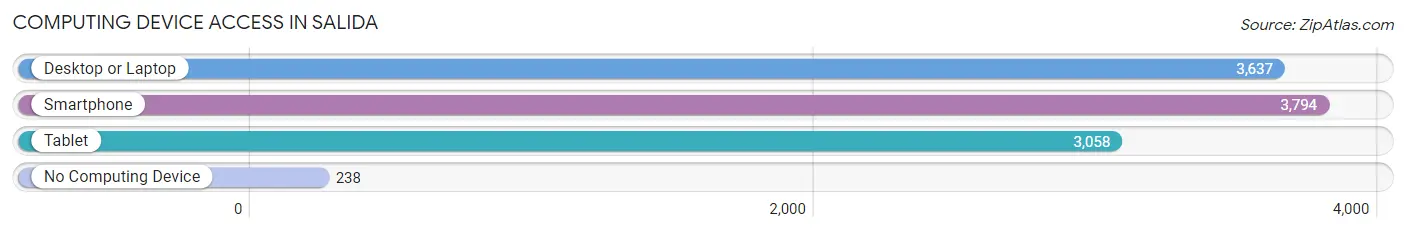
| Device Type | # Households | % Households |
| Desktop or Laptop | 3,637 | 83.6% |
| Smartphone | 3,794 | 87.2% |
| Tablet | 3,058 | 70.3% |
| No Computing Device | 238 | 5.5% |
| Total | 4,350 | 100.0% |
Internet Access in Salida
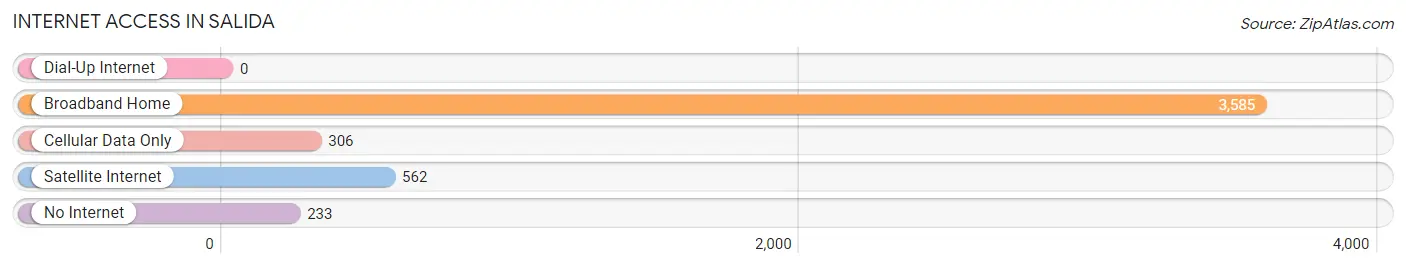
| Internet Type | # Households | % Households |
| Dial-Up Internet | 0 | 0.0% |
| Broadband Home | 3,585 | 82.4% |
| Cellular Data Only | 306 | 7.0% |
| Satellite Internet | 562 | 12.9% |
| No Internet | 233 | 5.4% |
| Total | 4,350 | 100.0% |
Salida Summary
Salida, California is a small town located in Stanislaus County, California. It is situated in the Central Valley, approximately 10 miles south of Modesto. The town has a population of approximately 11,000 people and is known for its agricultural production, particularly of almonds, walnuts, and grapes.
History
Salida was founded in 1869 by a group of settlers from the Midwest. The town was originally called “New Chicago” due to the large number of settlers from the Midwest. The name was later changed to Salida, which is Spanish for “exit” or “departure”. The town was incorporated in 1891 and has since grown to become a thriving community.
Geography
Salida is located in the Central Valley of California, approximately 10 miles south of Modesto. The town is situated on the banks of the Tuolumne River and is surrounded by rolling hills and farmland. The climate in Salida is generally mild, with hot summers and cool winters.
Economy
Salida’s economy is largely based on agriculture. The town is known for its production of almonds, walnuts, and grapes. In addition, the town is home to several small businesses, including restaurants, retail stores, and auto repair shops.
Demographics
As of the 2010 census, Salida had a population of 11,000 people. The racial makeup of the town was 75.3% White, 1.3% African American, 0.7% Native American, 0.7% Asian, 0.2% Pacific Islander, and 20.1% from other races. The median household income was $45,000, and the median age was 33.
Conclusion
Salida, California is a small town located in Stanislaus County, California. It is situated in the Central Valley, approximately 10 miles south of Modesto. The town has a population of approximately 11,000 people and is known for its agricultural production, particularly of almonds, walnuts, and grapes. The economy of Salida is largely based on agriculture, and the town is home to several small businesses. The racial makeup of the town is 75.3% White, 1.3% African American, 0.7% Native American, 0.7% Asian, 0.2% Pacific Islander, and 20.1% from other races. The median household income was $45,000, and the median age was 33. Salida is a thriving community with a rich history and a bright future.
Common Questions
What is Per Capita Income in Salida?
Per Capita income in Salida is $34,601.
What is the Median Family Income in Salida?
Median Family Income in Salida is $96,505.
What is the Median Household income in Salida?
Median Household Income in Salida is $90,476.
What is Income or Wage Gap in Salida?
Income or Wage Gap in Salida is 50.7%.
Women in Salida earn 49.3 cents for every dollar earned by a man.
What is Inequality or Gini Index in Salida?
Inequality or Gini Index in Salida is 0.41.
What is the Total Population of Salida?
Total Population of Salida is 14,849.
What is the Total Male Population of Salida?
Total Male Population of Salida is 7,712.
What is the Total Female Population of Salida?
Total Female Population of Salida is 7,137.
What is the Ratio of Males per 100 Females in Salida?
There are 108.06 Males per 100 Females in Salida.
What is the Ratio of Females per 100 Males in Salida?
There are 92.54 Females per 100 Males in Salida.
What is the Median Population Age in Salida?
Median Population Age in Salida is 31.9 Years.
What is the Average Family Size in Salida
Average Family Size in Salida is 3.9 People.
What is the Average Household Size in Salida
Average Household Size in Salida is 3.4 People.
How Large is the Labor Force in Salida?
There are 8,305 People in the Labor Forcein in Salida.
What is the Percentage of People in the Labor Force in Salida?
68.9% of People are in the Labor Force in Salida.
What is the Unemployment Rate in Salida?
Unemployment Rate in Salida is 10.7%.