Cities with the Most Immigrants from Eastern Africa in Minnesota
RELATED REPORTS & OPTIONS
Eastern Africa
Minnesota
Compare Cities
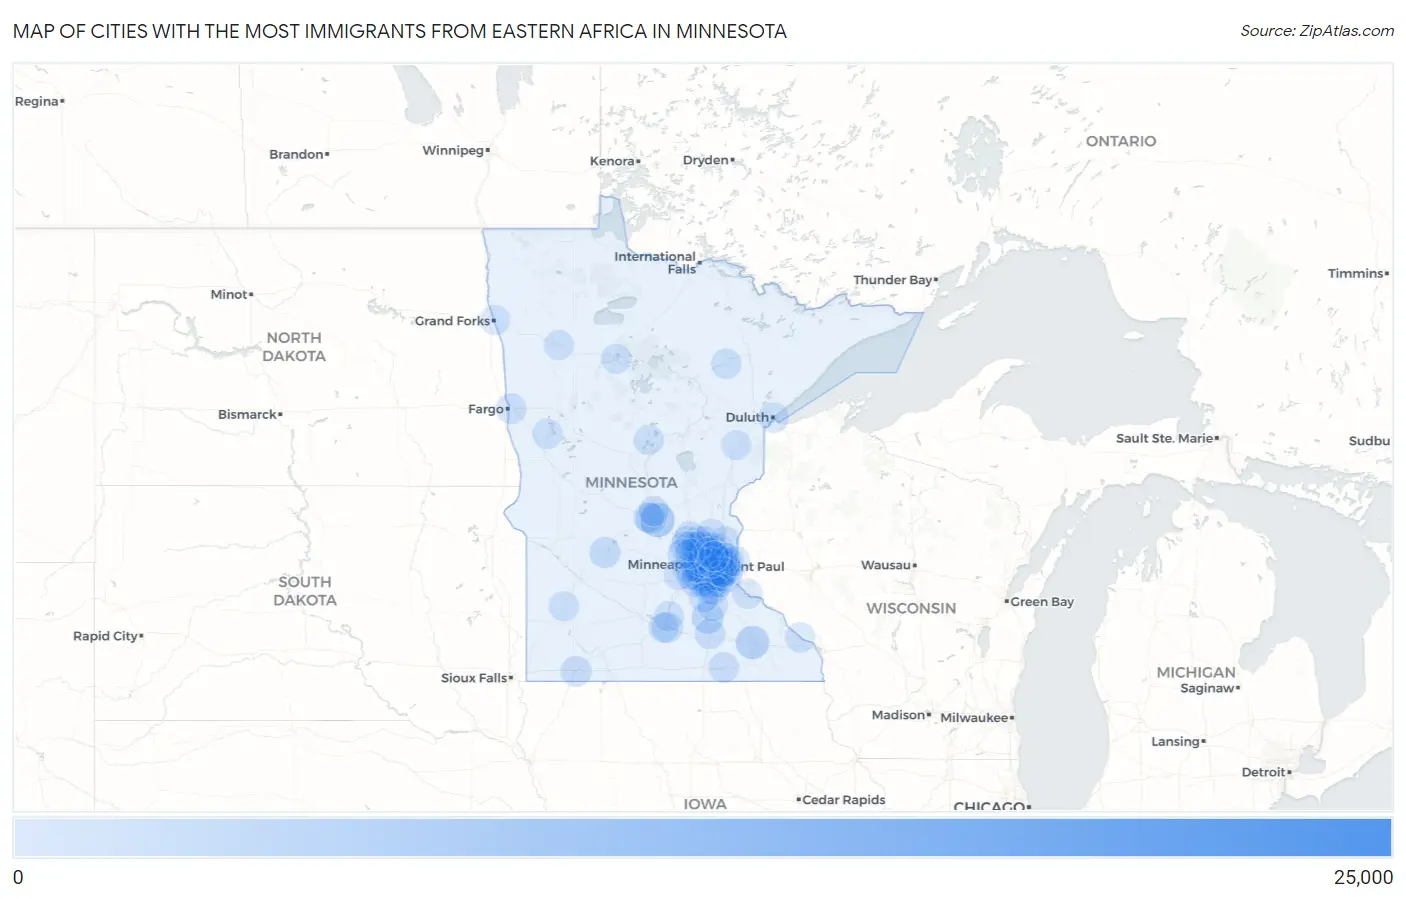
Map of Cities with the Most Immigrants from Eastern Africa in Minnesota
0
25,000
Cities with the Most Immigrants from Eastern Africa in Minnesota
| City | Eastern Africa | vs State | vs National | |
| 1. | Minneapolis | 20,910 | 87,090(24.01%)#1 | 752,337(2.78%)#2 |
| 2. | St Paul | 11,496 | 87,090(13.20%)#2 | 752,337(1.53%)#4 |
| 3. | St Cloud | 4,484 | 87,090(5.15%)#3 | 752,337(0.60%)#21 |
| 4. | Rochester | 3,289 | 87,090(3.78%)#4 | 752,337(0.44%)#33 |
| 5. | Bloomington | 3,160 | 87,090(3.63%)#5 | 752,337(0.42%)#34 |
| 6. | Burnsville | 2,308 | 87,090(2.65%)#6 | 752,337(0.31%)#51 |
| 7. | Brooklyn Park | 2,250 | 87,090(2.58%)#7 | 752,337(0.30%)#53 |
| 8. | Eagan | 2,091 | 87,090(2.40%)#8 | 752,337(0.28%)#54 |
| 9. | Faribault | 1,944 | 87,090(2.23%)#9 | 752,337(0.26%)#58 |
| 10. | Apple Valley | 1,713 | 87,090(1.97%)#10 | 752,337(0.23%)#64 |
| 11. | Shakopee | 1,702 | 87,090(1.95%)#11 | 752,337(0.23%)#67 |
| 12. | Eden Prairie | 1,620 | 87,090(1.86%)#12 | 752,337(0.22%)#71 |
| 13. | Columbia Heights | 1,468 | 87,090(1.69%)#13 | 752,337(0.20%)#82 |
| 14. | Blaine | 1,420 | 87,090(1.63%)#14 | 752,337(0.19%)#86 |
| 15. | Richfield | 1,122 | 87,090(1.29%)#15 | 752,337(0.15%)#108 |
| 16. | Willmar | 1,113 | 87,090(1.28%)#16 | 752,337(0.15%)#109 |
| 17. | Waite Park | 1,092 | 87,090(1.25%)#17 | 752,337(0.15%)#114 |
| 18. | Fridley | 1,054 | 87,090(1.21%)#18 | 752,337(0.14%)#119 |
| 19. | Mankato | 986 | 87,090(1.13%)#19 | 752,337(0.13%)#125 |
| 20. | Roseville | 985 | 87,090(1.13%)#20 | 752,337(0.13%)#126 |
| 21. | Coon Rapids | 971 | 87,090(1.11%)#21 | 752,337(0.13%)#129 |
| 22. | Maple Grove | 930 | 87,090(1.07%)#22 | 752,337(0.12%)#132 |
| 23. | Lakeville | 886 | 87,090(1.02%)#23 | 752,337(0.12%)#140 |
| 24. | New Brighton | 884 | 87,090(1.02%)#24 | 752,337(0.12%)#141 |
| 25. | Plymouth | 820 | 87,090(0.94%)#25 | 752,337(0.11%)#151 |
| 26. | Woodbury | 756 | 87,090(0.87%)#26 | 752,337(0.10%)#165 |
| 27. | Oakdale | 631 | 87,090(0.72%)#27 | 752,337(0.08%)#200 |
| 28. | St Louis Park | 607 | 87,090(0.70%)#28 | 752,337(0.08%)#210 |
| 29. | Savage | 573 | 87,090(0.66%)#29 | 752,337(0.08%)#217 |
| 30. | Maplewood | 570 | 87,090(0.65%)#30 | 752,337(0.08%)#219 |
| 31. | Brooklyn Center | 568 | 87,090(0.65%)#31 | 752,337(0.08%)#220 |
| 32. | Edina | 561 | 87,090(0.64%)#32 | 752,337(0.07%)#225 |
| 33. | Champlin | 538 | 87,090(0.62%)#33 | 752,337(0.07%)#235 |
| 34. | New Hope | 532 | 87,090(0.61%)#34 | 752,337(0.07%)#239 |
| 35. | Worthington | 529 | 87,090(0.61%)#35 | 752,337(0.07%)#241 |
| 36. | St Anthony City Hennepin And Ramsey Counties | 516 | 87,090(0.59%)#36 | 752,337(0.07%)#243 |
| 37. | Moorhead | 444 | 87,090(0.51%)#37 | 752,337(0.06%)#259 |
| 38. | Cottage Grove | 399 | 87,090(0.46%)#38 | 752,337(0.05%)#287 |
| 39. | Owatonna | 382 | 87,090(0.44%)#39 | 752,337(0.05%)#299 |
| 40. | Robbinsdale | 369 | 87,090(0.42%)#40 | 752,337(0.05%)#309 |
| 41. | Otsego | 356 | 87,090(0.41%)#41 | 752,337(0.05%)#318 |
| 42. | Ramsey | 355 | 87,090(0.41%)#42 | 752,337(0.05%)#319 |
| 43. | Minnetonka | 353 | 87,090(0.41%)#43 | 752,337(0.05%)#322 |
| 44. | Hopkins | 347 | 87,090(0.40%)#44 | 752,337(0.05%)#329 |
| 45. | Crystal | 329 | 87,090(0.38%)#45 | 752,337(0.04%)#347 |
| 46. | St Joseph | 311 | 87,090(0.36%)#46 | 752,337(0.04%)#369 |
| 47. | Hibbing | 248 | 87,090(0.28%)#47 | 752,337(0.03%)#446 |
| 48. | Anoka | 241 | 87,090(0.28%)#48 | 752,337(0.03%)#454 |
| 49. | Austin | 220 | 87,090(0.25%)#49 | 752,337(0.03%)#497 |
| 50. | West St Paul | 207 | 87,090(0.24%)#50 | 752,337(0.03%)#521 |
| 51. | Sartell | 190 | 87,090(0.22%)#51 | 752,337(0.03%)#554 |
| 52. | Lake Elmo | 160 | 87,090(0.18%)#52 | 752,337(0.02%)#629 |
| 53. | Mounds View | 154 | 87,090(0.18%)#53 | 752,337(0.02%)#656 |
| 54. | Forest Lake | 152 | 87,090(0.17%)#54 | 752,337(0.02%)#662 |
| 55. | North St Paul | 149 | 87,090(0.17%)#55 | 752,337(0.02%)#673 |
| 56. | Little Canada | 149 | 87,090(0.17%)#56 | 752,337(0.02%)#674 |
| 57. | Duluth | 148 | 87,090(0.17%)#57 | 752,337(0.02%)#675 |
| 58. | Pelican Rapids | 146 | 87,090(0.17%)#58 | 752,337(0.02%)#680 |
| 59. | Winona | 145 | 87,090(0.17%)#59 | 752,337(0.02%)#685 |
| 60. | White Bear Lake | 133 | 87,090(0.15%)#60 | 752,337(0.02%)#730 |
| 61. | St Peter | 133 | 87,090(0.15%)#61 | 752,337(0.02%)#731 |
| 62. | Northfield | 128 | 87,090(0.15%)#62 | 752,337(0.02%)#756 |
| 63. | Spring Park | 124 | 87,090(0.14%)#63 | 752,337(0.02%)#775 |
| 64. | Lexington | 114 | 87,090(0.13%)#64 | 752,337(0.02%)#816 |
| 65. | Elk River | 108 | 87,090(0.12%)#65 | 752,337(0.01%)#850 |
| 66. | Falcon Heights | 108 | 87,090(0.12%)#66 | 752,337(0.01%)#854 |
| 67. | Hilltop | 106 | 87,090(0.12%)#67 | 752,337(0.01%)#869 |
| 68. | South St Paul | 105 | 87,090(0.12%)#68 | 752,337(0.01%)#872 |
| 69. | Lino Lakes | 99 | 87,090(0.11%)#69 | 752,337(0.01%)#901 |
| 70. | Vadnais Heights | 97 | 87,090(0.11%)#70 | 752,337(0.01%)#910 |
| 71. | Mendota Heights | 97 | 87,090(0.11%)#71 | 752,337(0.01%)#913 |
| 72. | Chanhassen | 94 | 87,090(0.11%)#72 | 752,337(0.01%)#929 |
| 73. | East Grand Forks | 94 | 87,090(0.11%)#73 | 752,337(0.01%)#930 |
| 74. | Rosemount | 93 | 87,090(0.11%)#74 | 752,337(0.01%)#933 |
| 75. | Shoreview | 88 | 87,090(0.10%)#75 | 752,337(0.01%)#964 |
| 76. | Andover | 85 | 87,090(0.10%)#76 | 752,337(0.01%)#990 |
| 77. | St Michael | 84 | 87,090(0.10%)#77 | 752,337(0.01%)#996 |
| 78. | Inver Grove Heights | 83 | 87,090(0.10%)#78 | 752,337(0.01%)#1,002 |
| 79. | Mcintosh | 82 | 87,090(0.09%)#79 | 752,337(0.01%)#1,012 |
| 80. | Golden Valley | 80 | 87,090(0.09%)#80 | 752,337(0.01%)#1,027 |
| 81. | Marshall | 80 | 87,090(0.09%)#81 | 752,337(0.01%)#1,028 |
| 82. | Bemidji | 78 | 87,090(0.09%)#82 | 752,337(0.01%)#1,046 |
| 83. | Farmington | 76 | 87,090(0.09%)#83 | 752,337(0.01%)#1,062 |
| 84. | North Mankato | 75 | 87,090(0.09%)#84 | 752,337(0.01%)#1,071 |
| 85. | Mahtomedi | 73 | 87,090(0.08%)#85 | 752,337(0.01%)#1,094 |
| 86. | Dayton | 60 | 87,090(0.07%)#86 | 752,337(0.01%)#1,231 |
| 87. | Rogers | 54 | 87,090(0.06%)#87 | 752,337(0.01%)#1,319 |
| 88. | East Bethel | 54 | 87,090(0.06%)#88 | 752,337(0.01%)#1,322 |
| 89. | Lauderdale | 54 | 87,090(0.06%)#89 | 752,337(0.01%)#1,327 |
| 90. | Newport | 48 | 87,090(0.06%)#90 | 752,337(0.01%)#1,410 |
| 91. | Moose Lake | 48 | 87,090(0.06%)#91 | 752,337(0.01%)#1,411 |
| 92. | Corcoran | 47 | 87,090(0.05%)#92 | 752,337(0.01%)#1,432 |
| 93. | Spring Lake Park | 46 | 87,090(0.05%)#93 | 752,337(0.01%)#1,452 |
| 94. | Bayport | 46 | 87,090(0.05%)#94 | 752,337(0.01%)#1,453 |
| 95. | Waconia | 41 | 87,090(0.05%)#95 | 752,337(0.01%)#1,525 |
| 96. | Red Wing | 38 | 87,090(0.04%)#96 | 752,337(0.01%)#1,579 |
| 97. | Arden Hills | 34 | 87,090(0.04%)#97 | 752,337(0.00%)#1,665 |
| 98. | Elko New Market | 33 | 87,090(0.04%)#98 | 752,337(0.00%)#1,701 |
| 99. | Greenfield | 30 | 87,090(0.03%)#99 | 752,337(0.00%)#1,777 |
| 100. | Nisswa | 30 | 87,090(0.03%)#100 | 752,337(0.00%)#1,780 |
Common Questions
What are the Top 10 Cities with the Most Immigrants from Eastern Africa in Minnesota?
Top 10 Cities with the Most Immigrants from Eastern Africa in Minnesota are:
#1
20,910
#2
11,496
#3
4,484
#4
3,289
#5
3,160
#6
2,308
#7
2,250
#8
2,091
#9
1,944
#10
1,713
What city has the Most Immigrants from Eastern Africa in Minnesota?
Minneapolis has the Most Immigrants from Eastern Africa in Minnesota with 20,910.
What is the Total Immigrants from Eastern Africa in the State of Minnesota?
Total Immigrants from Eastern Africa in Minnesota is 87,090.
What is the Total Immigrants from Eastern Africa in the United States?
Total Immigrants from Eastern Africa in the United States is 752,337.