Cities with the Most Immigrants from Eastern Africa in Pennsylvania
RELATED REPORTS & OPTIONS
Eastern Africa
Pennsylvania
Compare Cities
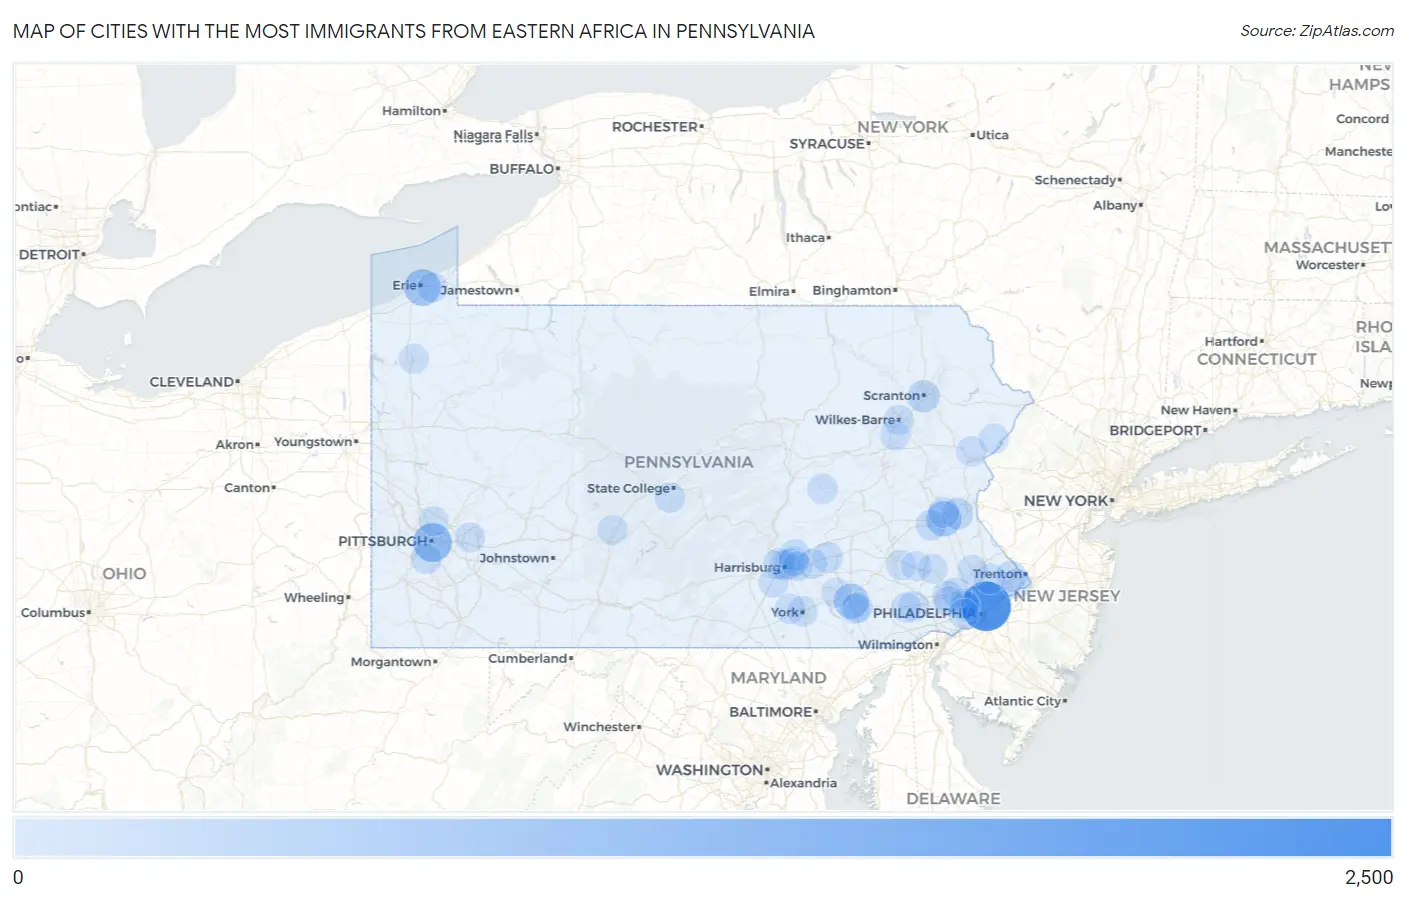
Map of Cities with the Most Immigrants from Eastern Africa in Pennsylvania
0
2,500
Cities with the Most Immigrants from Eastern Africa in Pennsylvania
| City | Eastern Africa | vs State | vs National | |
| 1. | Philadelphia | 2,399 | 15,890(15.10%)#1 | 752,337(0.32%)#47 |
| 2. | Pittsburgh | 1,048 | 15,890(6.60%)#2 | 752,337(0.14%)#121 |
| 3. | Erie | 793 | 15,890(4.99%)#3 | 752,337(0.11%)#157 |
| 4. | Allentown | 627 | 15,890(3.95%)#4 | 752,337(0.08%)#202 |
| 5. | Lancaster | 619 | 15,890(3.90%)#5 | 752,337(0.08%)#208 |
| 6. | Norristown Borough | 256 | 15,890(1.61%)#6 | 752,337(0.03%)#434 |
| 7. | Scranton | 243 | 15,890(1.53%)#7 | 752,337(0.03%)#452 |
| 8. | Elizabethtown Borough | 222 | 15,890(1.40%)#8 | 752,337(0.03%)#491 |
| 9. | Bethlehem | 189 | 15,890(1.19%)#9 | 752,337(0.03%)#556 |
| 10. | Linglestown | 147 | 15,890(0.93%)#10 | 752,337(0.02%)#676 |
| 11. | Chesterbrook | 133 | 15,890(0.84%)#11 | 752,337(0.02%)#732 |
| 12. | Enola | 130 | 15,890(0.82%)#12 | 752,337(0.02%)#749 |
| 13. | Chalfont Borough | 129 | 15,890(0.81%)#13 | 752,337(0.02%)#751 |
| 14. | Trexlertown | 127 | 15,890(0.80%)#14 | 752,337(0.02%)#760 |
| 15. | Crafton Borough | 125 | 15,890(0.79%)#15 | 752,337(0.02%)#772 |
| 16. | Woodbourne | 116 | 15,890(0.73%)#16 | 752,337(0.02%)#806 |
| 17. | Carlisle Borough | 113 | 15,890(0.71%)#17 | 752,337(0.02%)#824 |
| 18. | Fullerton | 110 | 15,890(0.69%)#18 | 752,337(0.01%)#839 |
| 19. | Annville | 110 | 15,890(0.69%)#19 | 752,337(0.01%)#842 |
| 20. | Yeadon Borough | 97 | 15,890(0.61%)#20 | 752,337(0.01%)#912 |
| 21. | Warminster Heights | 95 | 15,890(0.60%)#21 | 752,337(0.01%)#923 |
| 22. | Millbourne Borough | 90 | 15,890(0.57%)#22 | 752,337(0.01%)#951 |
| 23. | Folcroft Borough | 85 | 15,890(0.53%)#23 | 752,337(0.01%)#993 |
| 24. | Penbrook Borough | 84 | 15,890(0.53%)#24 | 752,337(0.01%)#997 |
| 25. | Castle Shannon Borough | 80 | 15,890(0.50%)#25 | 752,337(0.01%)#1,030 |
| 26. | Progress | 79 | 15,890(0.50%)#26 | 752,337(0.01%)#1,039 |
| 27. | Ambler Borough | 75 | 15,890(0.47%)#27 | 752,337(0.01%)#1,075 |
| 28. | Edwardsville Borough | 75 | 15,890(0.47%)#28 | 752,337(0.01%)#1,076 |
| 29. | Schwenksville Borough | 74 | 15,890(0.47%)#29 | 752,337(0.01%)#1,084 |
| 30. | Harrisburg | 73 | 15,890(0.46%)#30 | 752,337(0.01%)#1,089 |
| 31. | Bethel Park | 71 | 15,890(0.45%)#31 | 752,337(0.01%)#1,111 |
| 32. | Lansdowne Borough | 68 | 15,890(0.43%)#32 | 752,337(0.01%)#1,148 |
| 33. | Wyomissing Borough | 63 | 15,890(0.40%)#33 | 752,337(0.01%)#1,194 |
| 34. | New Britain Borough | 62 | 15,890(0.39%)#34 | 752,337(0.01%)#1,208 |
| 35. | Plum Borough | 59 | 15,890(0.37%)#35 | 752,337(0.01%)#1,243 |
| 36. | Baldwin Borough | 59 | 15,890(0.37%)#36 | 752,337(0.01%)#1,246 |
| 37. | East Lansdowne Borough | 56 | 15,890(0.35%)#37 | 752,337(0.01%)#1,294 |
| 38. | Hayti | 56 | 15,890(0.35%)#38 | 752,337(0.01%)#1,295 |
| 39. | Darby Borough | 53 | 15,890(0.33%)#39 | 752,337(0.01%)#1,342 |
| 40. | Shamokin | 53 | 15,890(0.33%)#40 | 752,337(0.01%)#1,343 |
| 41. | Weigelstown | 52 | 15,890(0.33%)#41 | 752,337(0.01%)#1,360 |
| 42. | Penn Estates | 49 | 15,890(0.31%)#42 | 752,337(0.01%)#1,399 |
| 43. | Gettysburg Borough | 43 | 15,890(0.27%)#43 | 752,337(0.01%)#1,499 |
| 44. | Red Lion Borough | 40 | 15,890(0.25%)#44 | 752,337(0.01%)#1,545 |
| 45. | York | 39 | 15,890(0.25%)#45 | 752,337(0.01%)#1,552 |
| 46. | Mount Joy Borough | 38 | 15,890(0.24%)#46 | 752,337(0.01%)#1,582 |
| 47. | Pottstown Borough | 37 | 15,890(0.23%)#47 | 752,337(0.00%)#1,599 |
| 48. | Willow Street | 36 | 15,890(0.23%)#48 | 752,337(0.00%)#1,620 |
| 49. | Thorndale | 35 | 15,890(0.22%)#49 | 752,337(0.00%)#1,648 |
| 50. | Lampeter | 34 | 15,890(0.21%)#50 | 752,337(0.00%)#1,674 |
| 51. | Wilkes Barre | 33 | 15,890(0.21%)#51 | 752,337(0.00%)#1,681 |
| 52. | King Of Prussia | 33 | 15,890(0.21%)#52 | 752,337(0.00%)#1,686 |
| 53. | Sayre Borough | 33 | 15,890(0.21%)#53 | 752,337(0.00%)#1,699 |
| 54. | Dover Borough | 31 | 15,890(0.20%)#54 | 752,337(0.00%)#1,749 |
| 55. | Pine Grove Mills | 31 | 15,890(0.20%)#55 | 752,337(0.00%)#1,750 |
| 56. | Murrysville | 30 | 15,890(0.19%)#56 | 752,337(0.00%)#1,764 |
| 57. | Mountain Top | 30 | 15,890(0.19%)#57 | 752,337(0.00%)#1,770 |
| 58. | Downingtown Borough | 29 | 15,890(0.18%)#58 | 752,337(0.00%)#1,803 |
| 59. | Adamstown Borough | 29 | 15,890(0.18%)#59 | 752,337(0.00%)#1,810 |
| 60. | Phoenixville Borough | 28 | 15,890(0.18%)#60 | 752,337(0.00%)#1,828 |
| 61. | Shenandoah Borough | 28 | 15,890(0.18%)#61 | 752,337(0.00%)#1,842 |
| 62. | Mount Pocono Borough | 28 | 15,890(0.18%)#62 | 752,337(0.00%)#1,843 |
| 63. | Coatesville | 27 | 15,890(0.17%)#63 | 752,337(0.00%)#1,864 |
| 64. | Montgomeryville | 26 | 15,890(0.16%)#64 | 752,337(0.00%)#1,900 |
| 65. | Chestnut Hill | 26 | 15,890(0.16%)#65 | 752,337(0.00%)#1,902 |
| 66. | Shillington Borough | 26 | 15,890(0.16%)#66 | 752,337(0.00%)#1,903 |
| 67. | Messiah College | 26 | 15,890(0.16%)#67 | 752,337(0.00%)#1,907 |
| 68. | Gibraltar | 25 | 15,890(0.16%)#68 | 752,337(0.00%)#1,937 |
| 69. | Brentwood Borough | 24 | 15,890(0.15%)#69 | 752,337(0.00%)#1,971 |
| 70. | Saw Creek | 24 | 15,890(0.15%)#70 | 752,337(0.00%)#1,979 |
| 71. | Penn State Erie Behrend | 24 | 15,890(0.15%)#71 | 752,337(0.00%)#1,984 |
| 72. | Bryn Mawr | 23 | 15,890(0.14%)#72 | 752,337(0.00%)#2,025 |
| 73. | Hershey | 22 | 15,890(0.14%)#73 | 752,337(0.00%)#2,046 |
| 74. | Jefferson Hills Borough | 21 | 15,890(0.13%)#74 | 752,337(0.00%)#2,084 |
| 75. | Athens Borough | 21 | 15,890(0.13%)#75 | 752,337(0.00%)#2,099 |
| 76. | Altoona | 20 | 15,890(0.13%)#76 | 752,337(0.00%)#2,108 |
| 77. | Pleasant Hills Borough | 20 | 15,890(0.13%)#77 | 752,337(0.00%)#2,134 |
| 78. | Jenkintown Borough | 20 | 15,890(0.13%)#78 | 752,337(0.00%)#2,139 |
| 79. | Amity Gardens | 20 | 15,890(0.13%)#79 | 752,337(0.00%)#2,140 |
| 80. | State College Borough | 18 | 15,890(0.11%)#80 | 752,337(0.00%)#2,190 |
| 81. | Allison Park | 18 | 15,890(0.11%)#81 | 752,337(0.00%)#2,196 |
| 82. | Ardmore | 18 | 15,890(0.11%)#82 | 752,337(0.00%)#2,207 |
| 83. | Ephrata Borough | 18 | 15,890(0.11%)#83 | 752,337(0.00%)#2,208 |
| 84. | Meadville | 18 | 15,890(0.11%)#84 | 752,337(0.00%)#2,212 |
| 85. | Levittown | 17 | 15,890(0.11%)#85 | 752,337(0.00%)#2,229 |
| 86. | Sanatoga | 17 | 15,890(0.11%)#86 | 752,337(0.00%)#2,252 |
| 87. | Mont Clare | 17 | 15,890(0.11%)#87 | 752,337(0.00%)#2,263 |
| 88. | Colonial Park | 15 | 15,890(0.09%)#88 | 752,337(0.00%)#2,325 |
| 89. | Berwyn | 15 | 15,890(0.09%)#89 | 752,337(0.00%)#2,355 |
| 90. | Brackenridge Borough | 15 | 15,890(0.09%)#90 | 752,337(0.00%)#2,358 |
| 91. | Shiremanstown Borough | 15 | 15,890(0.09%)#91 | 752,337(0.00%)#2,363 |
| 92. | South Coatesville Borough | 14 | 15,890(0.09%)#92 | 752,337(0.00%)#2,419 |
| 93. | Bellevue Borough | 13 | 15,890(0.08%)#93 | 752,337(0.00%)#2,448 |
| 94. | West Chester Borough | 12 | 15,890(0.08%)#94 | 752,337(0.00%)#2,492 |
| 95. | Baden Borough | 12 | 15,890(0.08%)#95 | 752,337(0.00%)#2,513 |
| 96. | Rosemont | 12 | 15,890(0.08%)#96 | 752,337(0.00%)#2,514 |
| 97. | Salunga | 12 | 15,890(0.08%)#97 | 752,337(0.00%)#2,518 |
| 98. | Langhorne Manor Borough | 12 | 15,890(0.08%)#98 | 752,337(0.00%)#2,521 |
| 99. | Drexel Hill | 11 | 15,890(0.07%)#99 | 752,337(0.00%)#2,547 |
| 100. | Rutherford | 11 | 15,890(0.07%)#100 | 752,337(0.00%)#2,579 |
Common Questions
What are the Top 10 Cities with the Most Immigrants from Eastern Africa in Pennsylvania?
Top 10 Cities with the Most Immigrants from Eastern Africa in Pennsylvania are:
#1
2,399
#2
1,048
#3
793
#4
627
#5
619
#6
243
#7
189
#8
147
#9
133
#10
130
What city has the Most Immigrants from Eastern Africa in Pennsylvania?
Philadelphia has the Most Immigrants from Eastern Africa in Pennsylvania with 2,399.
What is the Total Immigrants from Eastern Africa in the State of Pennsylvania?
Total Immigrants from Eastern Africa in Pennsylvania is 15,890.
What is the Total Immigrants from Eastern Africa in the United States?
Total Immigrants from Eastern Africa in the United States is 752,337.