Cities with the Most Immigrants from Eastern Africa in Connecticut
RELATED REPORTS & OPTIONS
Eastern Africa
Connecticut
Compare Cities
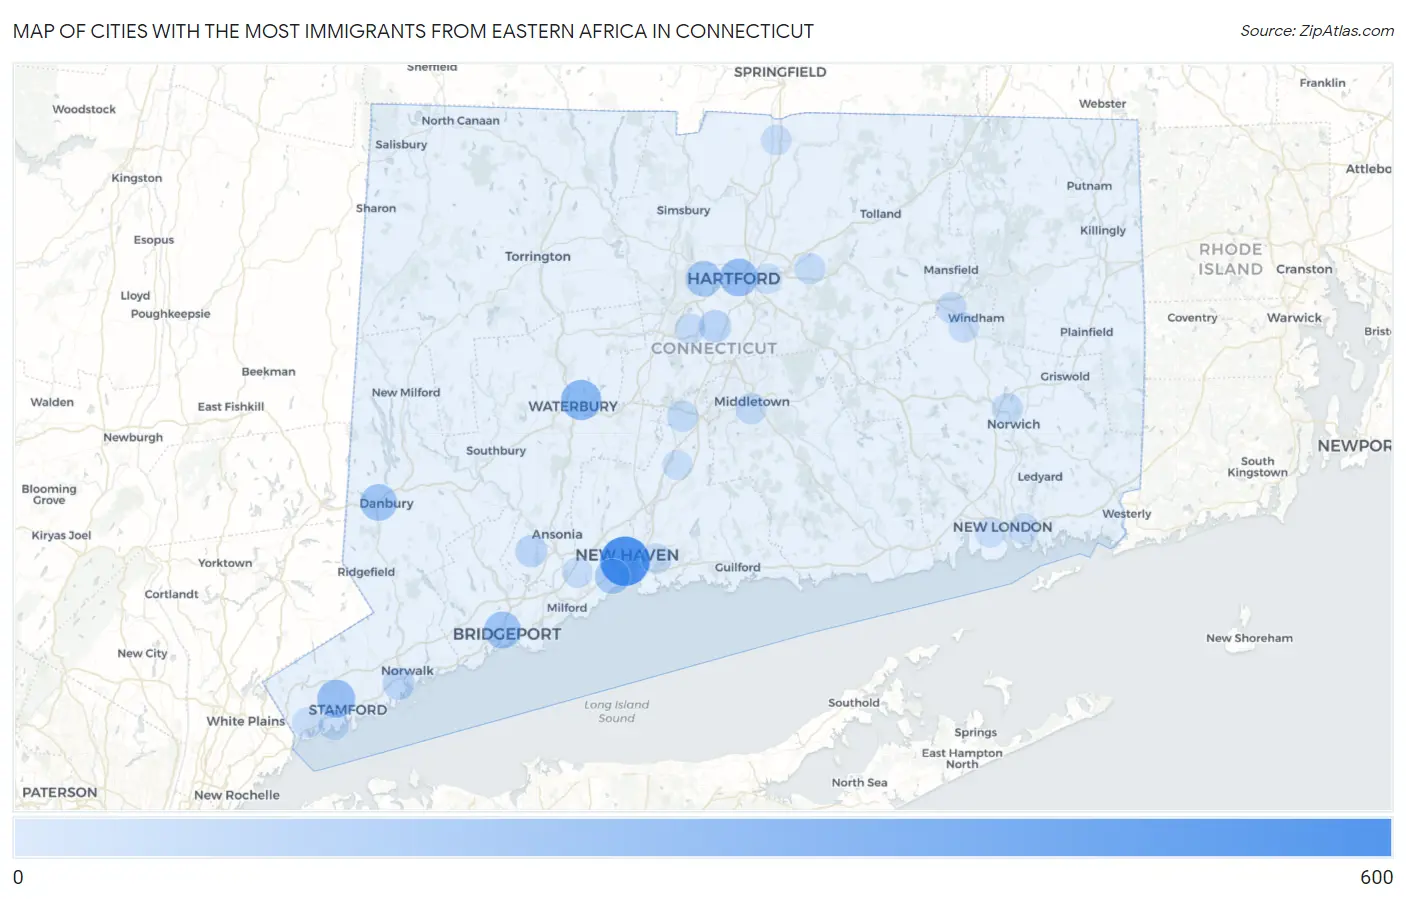
Map of Cities with the Most Immigrants from Eastern Africa in Connecticut
0
600
Cities with the Most Immigrants from Eastern Africa in Connecticut
| City | Eastern Africa | vs State | vs National | |
| 1. | New Haven | 559 | 4,016(13.92%)#1 | 752,337(0.07%)#228 |
| 2. | Waterbury | 284 | 4,016(7.07%)#2 | 752,337(0.04%)#395 |
| 3. | Stamford | 221 | 4,016(5.50%)#3 | 752,337(0.03%)#492 |
| 4. | Hartford | 220 | 4,016(5.48%)#4 | 752,337(0.03%)#495 |
| 5. | Bridgeport | 189 | 4,016(4.71%)#5 | 752,337(0.03%)#555 |
| 6. | Danbury | 184 | 4,016(4.58%)#6 | 752,337(0.02%)#568 |
| 7. | West Hartford | 158 | 4,016(3.93%)#7 | 752,337(0.02%)#634 |
| 8. | West Haven | 139 | 4,016(3.46%)#8 | 752,337(0.02%)#701 |
| 9. | Newington | 64 | 4,016(1.59%)#9 | 752,337(0.01%)#1,183 |
| 10. | Norwalk | 59 | 4,016(1.47%)#10 | 752,337(0.01%)#1,237 |
| 11. | Shelton | 57 | 4,016(1.42%)#11 | 752,337(0.01%)#1,269 |
| 12. | Meriden | 37 | 4,016(0.92%)#12 | 752,337(0.00%)#1,591 |
| 13. | Middletown | 36 | 4,016(0.90%)#13 | 752,337(0.00%)#1,612 |
| 14. | Norwich | 31 | 4,016(0.77%)#14 | 752,337(0.00%)#1,733 |
| 15. | Manchester | 25 | 4,016(0.62%)#15 | 752,337(0.00%)#1,914 |
| 16. | East Haven | 21 | 4,016(0.52%)#16 | 752,337(0.00%)#2,076 |
| 17. | Willimantic | 21 | 4,016(0.52%)#17 | 752,337(0.00%)#2,078 |
| 18. | Old Hill | 20 | 4,016(0.50%)#18 | 752,337(0.00%)#2,142 |
| 19. | New Britain | 18 | 4,016(0.45%)#19 | 752,337(0.00%)#2,184 |
| 20. | Orange | 17 | 4,016(0.42%)#20 | 752,337(0.00%)#2,247 |
| 21. | Long Hill | 17 | 4,016(0.42%)#21 | 752,337(0.00%)#2,259 |
| 22. | Quinnipiac University | 14 | 4,016(0.35%)#22 | 752,337(0.00%)#2,410 |
| 23. | Old Greenwich | 13 | 4,016(0.32%)#23 | 752,337(0.00%)#2,452 |
| 24. | Oronoque | 13 | 4,016(0.32%)#24 | 752,337(0.00%)#2,461 |
| 25. | South Wilton | 13 | 4,016(0.32%)#25 | 752,337(0.00%)#2,470 |
| 26. | Thompsonville | 11 | 4,016(0.27%)#26 | 752,337(0.00%)#2,573 |
| 27. | New Canaan | 10 | 4,016(0.25%)#27 | 752,337(0.00%)#2,650 |
| 28. | South Windham | 9 | 4,016(0.22%)#28 | 752,337(0.00%)#2,748 |
| 29. | Wallingford Center | 8 | 4,016(0.20%)#29 | 752,337(0.00%)#2,776 |
| 30. | Waterford | 8 | 4,016(0.20%)#30 | 752,337(0.00%)#2,805 |
| 31. | East Hartford | 7 | 4,016(0.17%)#31 | 752,337(0.00%)#2,831 |
| 32. | Greenwich | 7 | 4,016(0.17%)#32 | 752,337(0.00%)#2,853 |
| 33. | Stonington Borough | 4 | 4,016(0.10%)#33 | 752,337(0.00%)#3,163 |
1
2Common Questions
What are the Top 10 Cities with the Most Immigrants from Eastern Africa in Connecticut?
Top 10 Cities with the Most Immigrants from Eastern Africa in Connecticut are:
#1
559
#2
284
#3
221
#4
220
#5
189
#6
184
#7
158
#8
139
#9
64
#10
59
What city has the Most Immigrants from Eastern Africa in Connecticut?
New Haven has the Most Immigrants from Eastern Africa in Connecticut with 559.
What is the Total Immigrants from Eastern Africa in the State of Connecticut?
Total Immigrants from Eastern Africa in Connecticut is 4,016.
What is the Total Immigrants from Eastern Africa in the United States?
Total Immigrants from Eastern Africa in the United States is 752,337.