Cities with the Most Immigrants from Eastern Africa in Colorado
RELATED REPORTS & OPTIONS
Eastern Africa
Colorado
Compare Cities
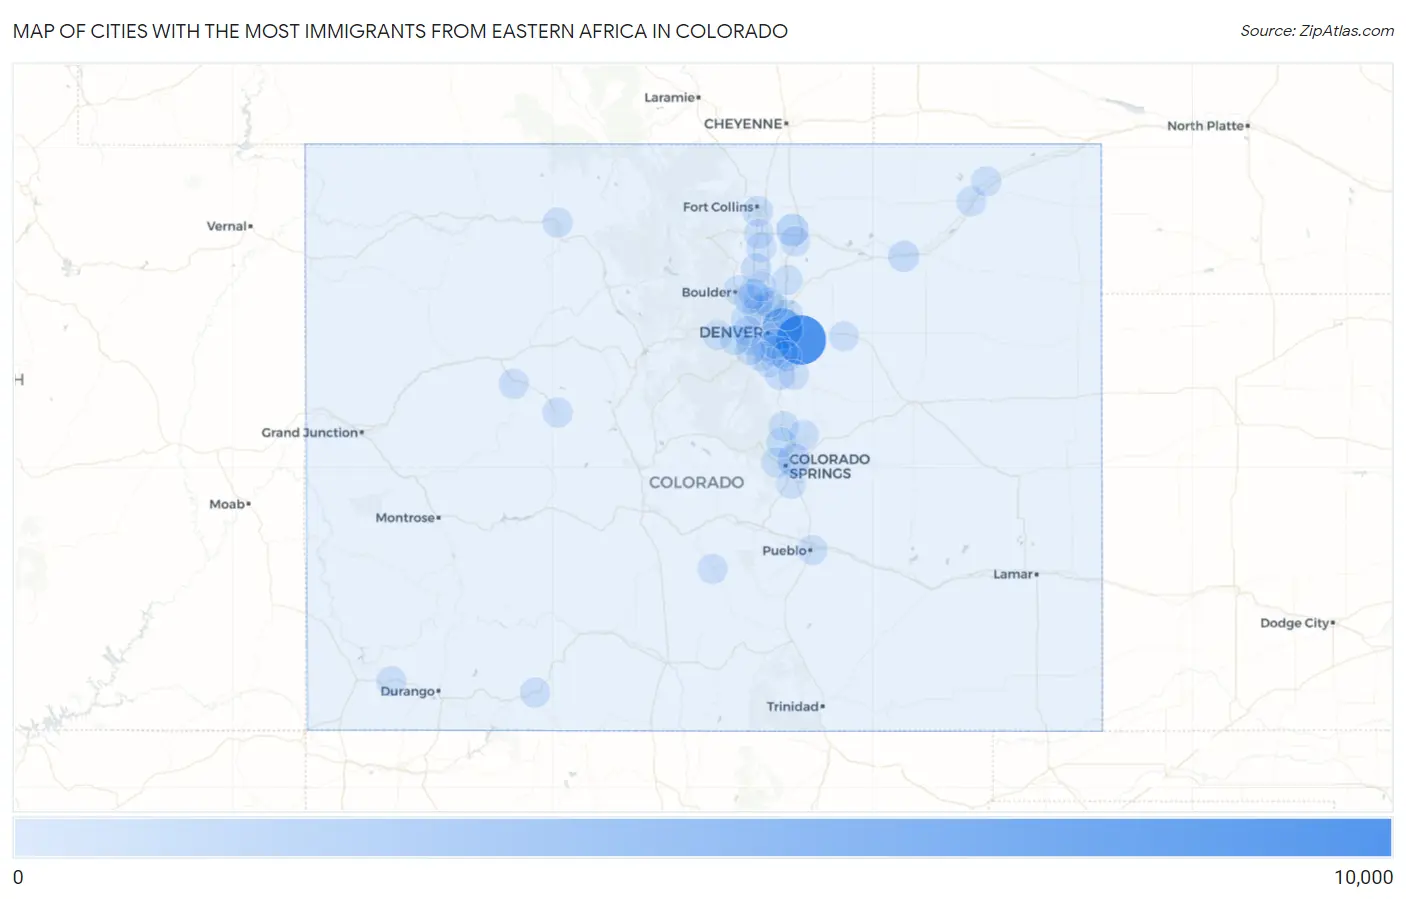
Map of Cities with the Most Immigrants from Eastern Africa in Colorado
0
10,000
Cities with the Most Immigrants from Eastern Africa in Colorado
| City | Eastern Africa | vs State | vs National | |
| 1. | Aurora | 8,280 | 19,561(42.33%)#1 | 752,337(1.10%)#8 |
| 2. | Denver | 4,522 | 19,561(23.12%)#2 | 752,337(0.60%)#20 |
| 3. | Colorado Springs | 1,145 | 19,561(5.85%)#3 | 752,337(0.15%)#104 |
| 4. | Greeley | 1,010 | 19,561(5.16%)#4 | 752,337(0.13%)#124 |
| 5. | Four Square Mile | 627 | 19,561(3.21%)#5 | 752,337(0.08%)#203 |
| 6. | Fort Morgan | 426 | 19,561(2.18%)#6 | 752,337(0.06%)#270 |
| 7. | Commerce City | 313 | 19,561(1.60%)#7 | 752,337(0.04%)#365 |
| 8. | Centennial | 254 | 19,561(1.30%)#8 | 752,337(0.03%)#436 |
| 9. | Thornton | 249 | 19,561(1.27%)#9 | 752,337(0.03%)#441 |
| 10. | Lakewood | 208 | 19,561(1.06%)#10 | 752,337(0.03%)#516 |
| 11. | Longmont | 205 | 19,561(1.05%)#11 | 752,337(0.03%)#524 |
| 12. | Fort Collins | 186 | 19,561(0.95%)#12 | 752,337(0.02%)#563 |
| 13. | Arvada | 115 | 19,561(0.59%)#13 | 752,337(0.02%)#807 |
| 14. | Broomfield | 111 | 19,561(0.57%)#14 | 752,337(0.01%)#831 |
| 15. | Castle Pines | 98 | 19,561(0.50%)#15 | 752,337(0.01%)#908 |
| 16. | Westminster | 85 | 19,561(0.43%)#16 | 752,337(0.01%)#985 |
| 17. | Woodmoor | 83 | 19,561(0.42%)#17 | 752,337(0.01%)#1,004 |
| 18. | Northglenn | 60 | 19,561(0.31%)#18 | 752,337(0.01%)#1,225 |
| 19. | Boulder | 57 | 19,561(0.29%)#19 | 752,337(0.01%)#1,265 |
| 20. | Sterling | 55 | 19,561(0.28%)#20 | 752,337(0.01%)#1,309 |
| 21. | Evans | 52 | 19,561(0.27%)#21 | 752,337(0.01%)#1,352 |
| 22. | Greenwood Village | 52 | 19,561(0.27%)#22 | 752,337(0.01%)#1,358 |
| 23. | Brook Forest | 48 | 19,561(0.25%)#23 | 752,337(0.01%)#1,413 |
| 24. | Lafayette | 43 | 19,561(0.22%)#24 | 752,337(0.01%)#1,487 |
| 25. | Englewood | 38 | 19,561(0.19%)#25 | 752,337(0.01%)#1,569 |
| 26. | Louisville | 34 | 19,561(0.17%)#26 | 752,337(0.00%)#1,662 |
| 27. | Highlands Ranch | 33 | 19,561(0.17%)#27 | 752,337(0.00%)#1,678 |
| 28. | Littleton | 31 | 19,561(0.16%)#28 | 752,337(0.00%)#1,732 |
| 29. | Manitou Springs | 30 | 19,561(0.15%)#29 | 752,337(0.00%)#1,776 |
| 30. | Holly Hills | 29 | 19,561(0.15%)#30 | 752,337(0.00%)#1,807 |
| 31. | Carbondale | 24 | 19,561(0.12%)#31 | 752,337(0.00%)#1,976 |
| 32. | Pueblo | 23 | 19,561(0.12%)#32 | 752,337(0.00%)#1,988 |
| 33. | Strasburg | 23 | 19,561(0.12%)#33 | 752,337(0.00%)#2,028 |
| 34. | Black Forest | 21 | 19,561(0.11%)#34 | 752,337(0.00%)#2,080 |
| 35. | Dove Valley | 21 | 19,561(0.11%)#35 | 752,337(0.00%)#2,095 |
| 36. | Dakota Ridge | 19 | 19,561(0.10%)#36 | 752,337(0.00%)#2,153 |
| 37. | Steamboat Springs | 19 | 19,561(0.10%)#37 | 752,337(0.00%)#2,165 |
| 38. | Fort Carson | 18 | 19,561(0.09%)#38 | 752,337(0.00%)#2,200 |
| 39. | Berthoud | 18 | 19,561(0.09%)#39 | 752,337(0.00%)#2,216 |
| 40. | The Pinery | 16 | 19,561(0.08%)#40 | 752,337(0.00%)#2,284 |
| 41. | Fort Lupton | 13 | 19,561(0.07%)#41 | 752,337(0.00%)#2,449 |
| 42. | Floyd Hill | 12 | 19,561(0.06%)#42 | 752,337(0.00%)#2,526 |
| 43. | Air Force Academy | 11 | 19,561(0.06%)#43 | 752,337(0.00%)#2,577 |
| 44. | Applewood | 10 | 19,561(0.05%)#44 | 752,337(0.00%)#2,647 |
| 45. | Loveland | 9 | 19,561(0.05%)#45 | 752,337(0.00%)#2,671 |
| 46. | Erie | 7 | 19,561(0.04%)#46 | 752,337(0.00%)#2,839 |
| 47. | Genesee | 7 | 19,561(0.04%)#47 | 752,337(0.00%)#2,879 |
| 48. | Aspen | 4 | 19,561(0.02%)#48 | 752,337(0.00%)#3,119 |
| 49. | Pagosa Springs | 4 | 19,561(0.02%)#49 | 752,337(0.00%)#3,147 |
| 50. | Mancos | 2 | 19,561(0.01%)#50 | 752,337(0.00%)#3,327 |
| 51. | Westcliffe | 2 | 19,561(0.01%)#51 | 752,337(0.00%)#3,352 |
| 52. | Iliff | 2 | 19,561(0.01%)#52 | 752,337(0.00%)#3,358 |
Common Questions
What are the Top 10 Cities with the Most Immigrants from Eastern Africa in Colorado?
Top 10 Cities with the Most Immigrants from Eastern Africa in Colorado are:
#1
8,280
#2
4,522
#3
1,145
#4
1,010
#5
426
#6
313
#7
254
#8
249
#9
208
#10
205
What city has the Most Immigrants from Eastern Africa in Colorado?
Aurora has the Most Immigrants from Eastern Africa in Colorado with 8,280.
What is the Total Immigrants from Eastern Africa in the State of Colorado?
Total Immigrants from Eastern Africa in Colorado is 19,561.
What is the Total Immigrants from Eastern Africa in the United States?
Total Immigrants from Eastern Africa in the United States is 752,337.