Cities with the Most Immigrants from Eastern Africa in Maryland
RELATED REPORTS & OPTIONS
Eastern Africa
Maryland
Compare Cities
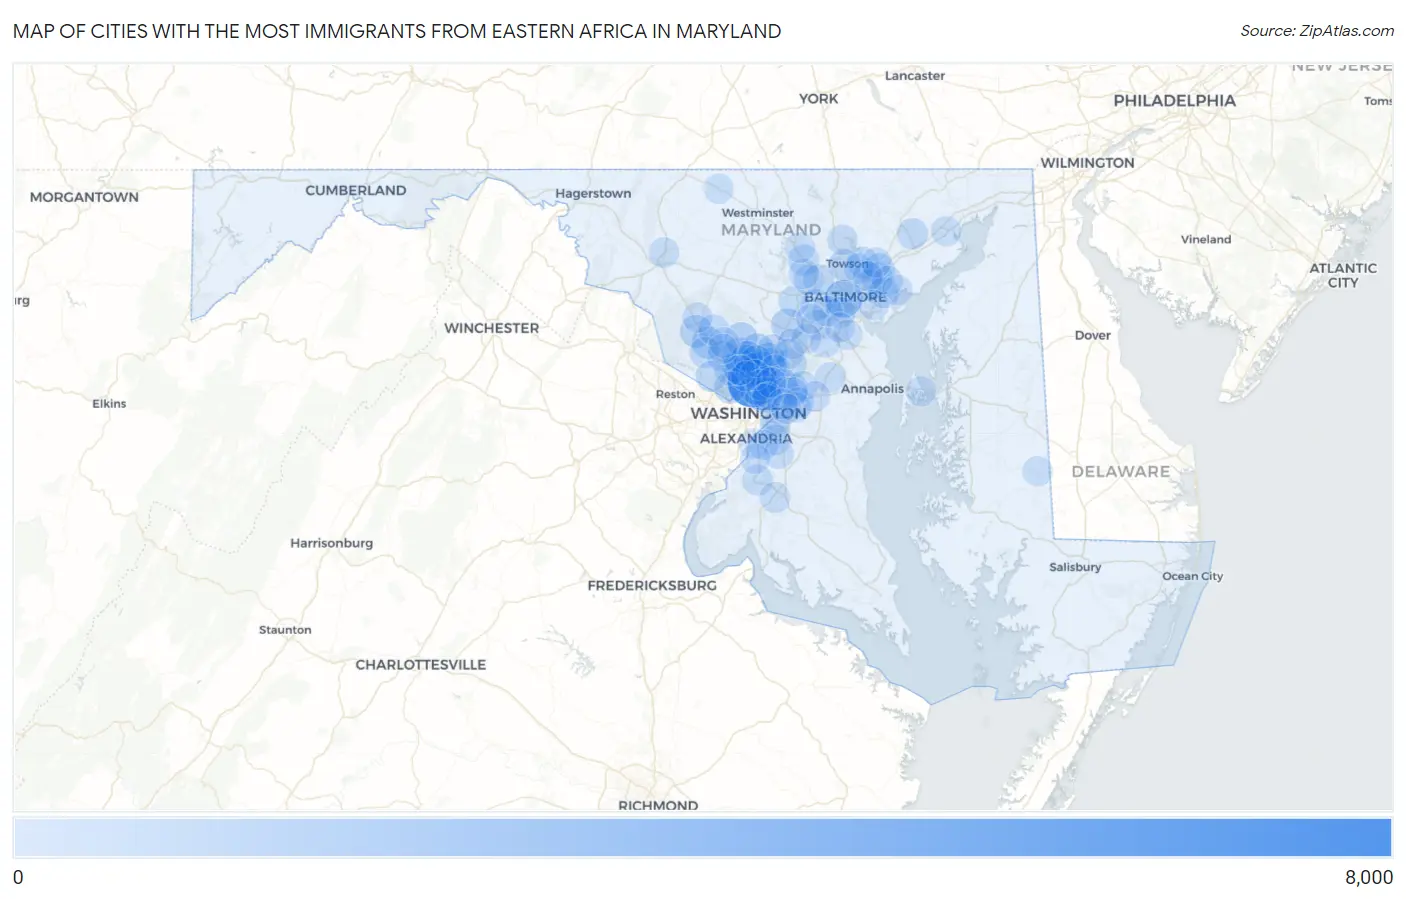
Map of Cities with the Most Immigrants from Eastern Africa in Maryland
0
8,000
Cities with the Most Immigrants from Eastern Africa in Maryland
| City | Eastern Africa | vs State | vs National | |
| 1. | Silver Spring | 6,084 | 48,205(12.62%)#1 | 752,337(0.81%)#16 |
| 2. | Wheaton | 2,466 | 48,205(5.12%)#2 | 752,337(0.33%)#45 |
| 3. | Baltimore | 2,349 | 48,205(4.87%)#3 | 752,337(0.31%)#50 |
| 4. | Calverton | 1,709 | 48,205(3.55%)#4 | 752,337(0.23%)#65 |
| 5. | Chillum | 1,706 | 48,205(3.54%)#5 | 752,337(0.23%)#66 |
| 6. | White Oak | 1,477 | 48,205(3.06%)#6 | 752,337(0.20%)#81 |
| 7. | Takoma Park | 1,437 | 48,205(2.98%)#7 | 752,337(0.19%)#85 |
| 8. | Aspen Hill | 1,307 | 48,205(2.71%)#8 | 752,337(0.17%)#94 |
| 9. | Fairland | 1,291 | 48,205(2.68%)#9 | 752,337(0.17%)#96 |
| 10. | Kemp Mill | 1,105 | 48,205(2.29%)#10 | 752,337(0.15%)#112 |
| 11. | Cloverly | 919 | 48,205(1.91%)#11 | 752,337(0.12%)#133 |
| 12. | Glenmont | 908 | 48,205(1.88%)#12 | 752,337(0.12%)#134 |
| 13. | Olney | 904 | 48,205(1.88%)#13 | 752,337(0.12%)#135 |
| 14. | Columbia | 893 | 48,205(1.85%)#14 | 752,337(0.12%)#137 |
| 15. | Germantown | 793 | 48,205(1.65%)#15 | 752,337(0.11%)#158 |
| 16. | Towson | 708 | 48,205(1.47%)#16 | 752,337(0.09%)#177 |
| 17. | Gaithersburg | 692 | 48,205(1.44%)#17 | 752,337(0.09%)#181 |
| 18. | Bethesda | 605 | 48,205(1.26%)#18 | 752,337(0.08%)#211 |
| 19. | Adelphi | 596 | 48,205(1.24%)#19 | 752,337(0.08%)#213 |
| 20. | Colesville | 567 | 48,205(1.18%)#20 | 752,337(0.08%)#222 |
| 21. | Owings Mills | 439 | 48,205(0.91%)#21 | 752,337(0.06%)#260 |
| 22. | Carney | 437 | 48,205(0.91%)#22 | 752,337(0.06%)#264 |
| 23. | Seabrook | 435 | 48,205(0.90%)#23 | 752,337(0.06%)#265 |
| 24. | Rossville | 423 | 48,205(0.88%)#24 | 752,337(0.06%)#271 |
| 25. | White Marsh | 421 | 48,205(0.87%)#25 | 752,337(0.06%)#274 |
| 26. | Burtonsville | 409 | 48,205(0.85%)#26 | 752,337(0.05%)#280 |
| 27. | Essex | 384 | 48,205(0.80%)#27 | 752,337(0.05%)#296 |
| 28. | North Potomac | 378 | 48,205(0.78%)#28 | 752,337(0.05%)#302 |
| 29. | North Bethesda | 376 | 48,205(0.78%)#29 | 752,337(0.05%)#304 |
| 30. | Catonsville | 375 | 48,205(0.78%)#30 | 752,337(0.05%)#305 |
| 31. | Bel Air South | 361 | 48,205(0.75%)#31 | 752,337(0.05%)#315 |
| 32. | Rosedale | 353 | 48,205(0.73%)#32 | 752,337(0.05%)#324 |
| 33. | Burnt Mills | 339 | 48,205(0.70%)#33 | 752,337(0.05%)#335 |
| 34. | Lochearn | 335 | 48,205(0.69%)#34 | 752,337(0.04%)#340 |
| 35. | South Laurel | 332 | 48,205(0.69%)#35 | 752,337(0.04%)#344 |
| 36. | Rockville | 315 | 48,205(0.65%)#36 | 752,337(0.04%)#361 |
| 37. | Hyattsville | 312 | 48,205(0.65%)#37 | 752,337(0.04%)#366 |
| 38. | Baltimore Highlands | 311 | 48,205(0.65%)#38 | 752,337(0.04%)#368 |
| 39. | Potomac | 308 | 48,205(0.64%)#39 | 752,337(0.04%)#373 |
| 40. | Layhill | 292 | 48,205(0.61%)#40 | 752,337(0.04%)#389 |
| 41. | Beltsville | 280 | 48,205(0.58%)#41 | 752,337(0.04%)#402 |
| 42. | Langley Park | 275 | 48,205(0.57%)#42 | 752,337(0.04%)#408 |
| 43. | Accokeek | 274 | 48,205(0.57%)#43 | 752,337(0.04%)#411 |
| 44. | Ellicott City | 273 | 48,205(0.57%)#44 | 752,337(0.04%)#413 |
| 45. | Montgomery Village | 270 | 48,205(0.56%)#45 | 752,337(0.04%)#419 |
| 46. | Green Valley | 268 | 48,205(0.56%)#46 | 752,337(0.04%)#420 |
| 47. | Middle River | 237 | 48,205(0.49%)#47 | 752,337(0.03%)#462 |
| 48. | Elkridge | 235 | 48,205(0.49%)#48 | 752,337(0.03%)#467 |
| 49. | Frederick | 233 | 48,205(0.48%)#49 | 752,337(0.03%)#472 |
| 50. | Crofton | 227 | 48,205(0.47%)#50 | 752,337(0.03%)#486 |
| 51. | Milford Mill | 220 | 48,205(0.46%)#51 | 752,337(0.03%)#496 |
| 52. | Redland | 208 | 48,205(0.43%)#52 | 752,337(0.03%)#517 |
| 53. | Coral Hills | 208 | 48,205(0.43%)#53 | 752,337(0.03%)#518 |
| 54. | Camp Springs | 207 | 48,205(0.43%)#54 | 752,337(0.03%)#520 |
| 55. | Waldorf | 199 | 48,205(0.41%)#55 | 752,337(0.03%)#538 |
| 56. | Greenbelt | 192 | 48,205(0.40%)#56 | 752,337(0.03%)#551 |
| 57. | North Laurel | 191 | 48,205(0.40%)#57 | 752,337(0.03%)#553 |
| 58. | Suitland | 177 | 48,205(0.37%)#58 | 752,337(0.02%)#586 |
| 59. | Randallstown | 171 | 48,205(0.35%)#59 | 752,337(0.02%)#597 |
| 60. | New Carrollton | 171 | 48,205(0.35%)#60 | 752,337(0.02%)#599 |
| 61. | Glenn Dale | 162 | 48,205(0.34%)#61 | 752,337(0.02%)#622 |
| 62. | Four Corners | 159 | 48,205(0.33%)#62 | 752,337(0.02%)#632 |
| 63. | Mitchellville | 158 | 48,205(0.33%)#63 | 752,337(0.02%)#640 |
| 64. | Cockeysville | 156 | 48,205(0.32%)#64 | 752,337(0.02%)#650 |
| 65. | Parkville | 154 | 48,205(0.32%)#65 | 752,337(0.02%)#655 |
| 66. | Arbutus | 151 | 48,205(0.31%)#66 | 752,337(0.02%)#666 |
| 67. | National Harbor | 147 | 48,205(0.30%)#67 | 752,337(0.02%)#677 |
| 68. | Woodlawn Cdp Baltimore County | 145 | 48,205(0.30%)#68 | 752,337(0.02%)#682 |
| 69. | Reisterstown | 143 | 48,205(0.30%)#69 | 752,337(0.02%)#691 |
| 70. | Forest Glen | 142 | 48,205(0.29%)#70 | 752,337(0.02%)#696 |
| 71. | Clinton | 140 | 48,205(0.29%)#71 | 752,337(0.02%)#699 |
| 72. | Severn | 132 | 48,205(0.27%)#72 | 752,337(0.02%)#737 |
| 73. | Bowie | 128 | 48,205(0.27%)#73 | 752,337(0.02%)#753 |
| 74. | Mount Rainier | 126 | 48,205(0.26%)#74 | 752,337(0.02%)#767 |
| 75. | Laurel | 125 | 48,205(0.26%)#75 | 752,337(0.02%)#770 |
| 76. | Perry Hall | 123 | 48,205(0.26%)#76 | 752,337(0.02%)#777 |
| 77. | Chester | 118 | 48,205(0.24%)#77 | 752,337(0.02%)#796 |
| 78. | Jessup | 117 | 48,205(0.24%)#78 | 752,337(0.02%)#802 |
| 79. | North Kensington | 110 | 48,205(0.23%)#79 | 752,337(0.01%)#840 |
| 80. | Aberdeen | 109 | 48,205(0.23%)#80 | 752,337(0.01%)#846 |
| 81. | Lake Arbor | 102 | 48,205(0.21%)#81 | 752,337(0.01%)#889 |
| 82. | Clarksburg | 95 | 48,205(0.20%)#82 | 752,337(0.01%)#922 |
| 83. | Oxon Hill | 90 | 48,205(0.19%)#83 | 752,337(0.01%)#948 |
| 84. | Lanham | 90 | 48,205(0.19%)#84 | 752,337(0.01%)#950 |
| 85. | College Park | 86 | 48,205(0.18%)#85 | 752,337(0.01%)#978 |
| 86. | Fort Washington | 86 | 48,205(0.18%)#86 | 752,337(0.01%)#981 |
| 87. | Overlea | 86 | 48,205(0.18%)#87 | 752,337(0.01%)#982 |
| 88. | Glen Burnie | 85 | 48,205(0.18%)#88 | 752,337(0.01%)#986 |
| 89. | Bowleys Quarters | 82 | 48,205(0.17%)#89 | 752,337(0.01%)#1,010 |
| 90. | Honeygo | 81 | 48,205(0.17%)#90 | 752,337(0.01%)#1,017 |
| 91. | Ferndale | 76 | 48,205(0.16%)#91 | 752,337(0.01%)#1,064 |
| 92. | Federalsburg | 76 | 48,205(0.16%)#92 | 752,337(0.01%)#1,065 |
| 93. | Taneytown | 73 | 48,205(0.15%)#93 | 752,337(0.01%)#1,095 |
| 94. | Landover | 72 | 48,205(0.15%)#94 | 752,337(0.01%)#1,098 |
| 95. | Brentwood | 67 | 48,205(0.14%)#95 | 752,337(0.01%)#1,161 |
| 96. | Dundalk | 66 | 48,205(0.14%)#96 | 752,337(0.01%)#1,162 |
| 97. | Flower Hill | 66 | 48,205(0.14%)#97 | 752,337(0.01%)#1,168 |
| 98. | Derwood | 63 | 48,205(0.13%)#98 | 752,337(0.01%)#1,198 |
| 99. | Ilchester | 56 | 48,205(0.12%)#99 | 752,337(0.01%)#1,286 |
| 100. | Summerfield | 55 | 48,205(0.11%)#100 | 752,337(0.01%)#1,306 |
Common Questions
What are the Top 10 Cities with the Most Immigrants from Eastern Africa in Maryland?
Top 10 Cities with the Most Immigrants from Eastern Africa in Maryland are:
#1
6,084
#2
2,466
#3
2,349
#4
1,709
#5
1,706
#6
1,477
#7
1,437
#8
1,307
#9
1,291
#10
1,105
What city has the Most Immigrants from Eastern Africa in Maryland?
Silver Spring has the Most Immigrants from Eastern Africa in Maryland with 6,084.
What is the Total Immigrants from Eastern Africa in the State of Maryland?
Total Immigrants from Eastern Africa in Maryland is 48,205.
What is the Total Immigrants from Eastern Africa in the United States?
Total Immigrants from Eastern Africa in the United States is 752,337.