Cities with the Highest Percentage of Immigrants from South America in North Carolina
RELATED REPORTS & OPTIONS
South America
North Carolina
Compare Cities
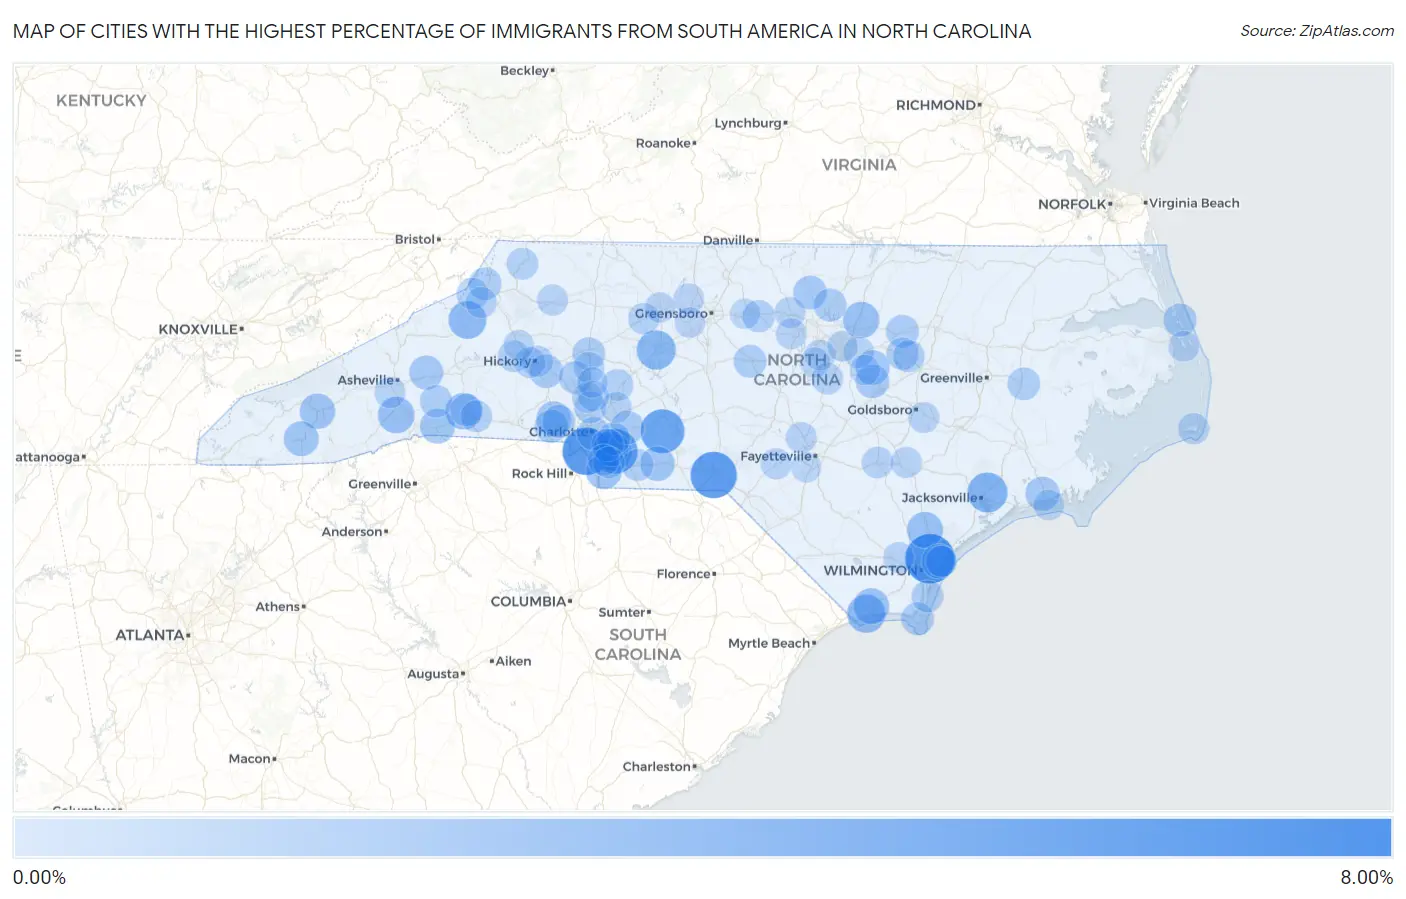
Map of Cities with the Highest Percentage of Immigrants from South America in North Carolina
0.00%
8.00%
Cities with the Highest Percentage of Immigrants from South America in North Carolina
| City | South America | vs State | vs National | |
| 1. | Northchase | 6.26% | 0.59%(+5.67)#242 | 1.10%(+5.16)#6,637 |
| 2. | Pineville | 5.65% | 0.59%(+5.06)#243 | 1.10%(+4.55)#6,638 |
| 3. | East Rockingham | 5.32% | 0.59%(+4.73)#344 | 1.10%(+4.22)#9,312 |
| 4. | Lake Park | 4.94% | 0.59%(+4.35)#345 | 1.10%(+3.84)#9,313 |
| 5. | Aquadale | 4.65% | 0.59%(+4.06)#346 | 1.10%(+3.55)#9,314 |
| 6. | Pumpkin Center | 3.49% | 0.59%(+2.90)#347 | 1.10%(+2.39)#9,315 |
| 7. | Lexington | 3.24% | 0.59%(+2.65)#348 | 1.10%(+2.14)#9,316 |
| 8. | Ocean Isle Beach | 2.97% | 0.59%(+2.38)#349 | 1.10%(+1.87)#9,317 |
| 9. | Crossnore | 2.88% | 0.59%(+2.29)#350 | 1.10%(+1.78)#9,318 |
| 10. | Indian Trail | 2.63% | 0.59%(+2.05)#351 | 1.10%(+1.53)#9,319 |
| 11. | Carolina Meadows | 2.60% | 0.59%(+2.02)#352 | 1.10%(+1.51)#9,320 |
| 12. | Horse Shoe | 2.48% | 0.59%(+1.90)#353 | 1.10%(+1.38)#9,321 |
| 13. | Rutherfordton | 2.48% | 0.59%(+1.89)#354 | 1.10%(+1.38)#9,322 |
| 14. | Youngsville | 2.44% | 0.59%(+1.85)#431 | 1.10%(+1.34)#12,719 |
| 15. | St Helena | 2.37% | 0.59%(+1.78)#432 | 1.10%(+1.27)#12,720 |
| 16. | Shallotte | 2.30% | 0.59%(+1.72)#433 | 1.10%(+1.20)#12,721 |
| 17. | Waxhaw | 2.25% | 0.59%(+1.66)#434 | 1.10%(+1.15)#12,722 |
| 18. | Dillsboro | 2.16% | 0.59%(+1.58)#435 | 1.10%(+1.07)#12,723 |
| 19. | Cypress Landing | 2.09% | 0.59%(+1.51)#436 | 1.10%(+0.993)#12,724 |
| 20. | Brandywine Bay | 2.09% | 0.59%(+1.51)#437 | 1.10%(+0.993)#12,725 |
| 21. | Stallings | 2.03% | 0.59%(+1.44)#438 | 1.10%(+0.927)#12,726 |
| 22. | Columbus | 2.02% | 0.59%(+1.44)#439 | 1.10%(+0.926)#12,727 |
| 23. | Franklin | 2.01% | 0.59%(+1.42)#440 | 1.10%(+0.909)#12,728 |
| 24. | Dallas | 2.00% | 0.59%(+1.42)#441 | 1.10%(+0.905)#12,729 |
| 25. | Peachland | 1.94% | 0.59%(+1.35)#442 | 1.10%(+0.837)#12,730 |
| 26. | Bayshore | 1.89% | 0.59%(+1.31)#443 | 1.10%(+0.793)#12,731 |
| 27. | Archer Lodge | 1.88% | 0.59%(+1.29)#444 | 1.10%(+0.782)#12,732 |
| 28. | Newport | 1.82% | 0.59%(+1.23)#445 | 1.10%(+0.717)#12,733 |
| 29. | Montreat | 1.81% | 0.59%(+1.22)#446 | 1.10%(+0.712)#12,734 |
| 30. | Governors | 1.79% | 0.59%(+1.20)#447 | 1.10%(+0.689)#12,735 |
| 31. | Wilson S Mills | 1.70% | 0.59%(+1.12)#448 | 1.10%(+0.606)#12,736 |
| 32. | Rougemont | 1.69% | 0.59%(+1.10)#449 | 1.10%(+0.591)#12,737 |
| 33. | Newton | 1.64% | 0.59%(+1.05)#450 | 1.10%(+0.541)#12,738 |
| 34. | Midland | 1.60% | 0.59%(+1.02)#451 | 1.10%(+0.506)#12,739 |
| 35. | Gastonia | 1.56% | 0.59%(+0.976)#452 | 1.10%(+0.463)#12,740 |
| 36. | Charlotte | 1.53% | 0.59%(+0.949)#453 | 1.10%(+0.436)#12,741 |
| 37. | Kill Devil Hills | 1.53% | 0.59%(+0.942)#454 | 1.10%(+0.430)#12,742 |
| 38. | Butner | 1.50% | 0.59%(+0.919)#455 | 1.10%(+0.406)#12,743 |
| 39. | Mint Hill | 1.50% | 0.59%(+0.910)#456 | 1.10%(+0.398)#12,744 |
| 40. | Statesville | 1.47% | 0.59%(+0.881)#457 | 1.10%(+0.368)#12,745 |
| 41. | Spring Hope | 1.46% | 0.59%(+0.872)#458 | 1.10%(+0.359)#12,746 |
| 42. | Bald Head Island | 1.45% | 0.59%(+0.864)#459 | 1.10%(+0.351)#12,747 |
| 43. | Ranlo | 1.45% | 0.59%(+0.863)#460 | 1.10%(+0.350)#12,748 |
| 44. | Siler City | 1.44% | 0.59%(+0.854)#461 | 1.10%(+0.342)#12,749 |
| 45. | Cove Creek | 1.40% | 0.59%(+0.818)#462 | 1.10%(+0.305)#12,750 |
| 46. | Lake Lure | 1.40% | 0.59%(+0.811)#463 | 1.10%(+0.299)#12,751 |
| 47. | Washington | 1.38% | 0.59%(+0.798)#464 | 1.10%(+0.285)#12,752 |
| 48. | Lake Norman Of Catawba | 1.34% | 0.59%(+0.756)#465 | 1.10%(+0.243)#12,753 |
| 49. | Matthews | 1.32% | 0.59%(+0.735)#466 | 1.10%(+0.222)#12,754 |
| 50. | Bailey | 1.31% | 0.59%(+0.722)#467 | 1.10%(+0.209)#12,755 |
| 51. | Ruth | 1.29% | 0.59%(+0.703)#468 | 1.10%(+0.190)#12,756 |
| 52. | Graham | 1.27% | 0.59%(+0.687)#469 | 1.10%(+0.174)#12,757 |
| 53. | Sims | 1.23% | 0.59%(+0.646)#470 | 1.10%(+0.133)#12,758 |
| 54. | Carolina Beach | 1.23% | 0.59%(+0.645)#471 | 1.10%(+0.132)#12,759 |
| 55. | Wingate | 1.21% | 0.59%(+0.621)#472 | 1.10%(+0.108)#12,760 |
| 56. | Huntersville | 1.18% | 0.59%(+0.599)#473 | 1.10%(+0.086)#12,761 |
| 57. | Forest City | 1.18% | 0.59%(+0.597)#474 | 1.10%(+0.084)#12,762 |
| 58. | Landis | 1.17% | 0.59%(+0.588)#475 | 1.10%(+0.076)#12,763 |
| 59. | Governors Club | 1.13% | 0.59%(+0.546)#476 | 1.10%(+0.033)#12,764 |
| 60. | Wesley Chapel | 1.13% | 0.59%(+0.544)#477 | 1.10%(+0.031)#12,765 |
| 61. | Beech Mountain | 1.13% | 0.59%(+0.542)#478 | 1.10%(+0.030)#12,766 |
| 62. | Jefferson | 1.12% | 0.59%(+0.536)#479 | 1.10%(+0.024)#12,767 |
| 63. | Clinton | 1.09% | 0.59%(+0.503)#480 | 1.10%(-0.010)#12,768 |
| 64. | Rutherford College | 1.07% | 0.59%(+0.487)#481 | 1.10%(-0.026)#12,769 |
| 65. | Weddington | 1.04% | 0.59%(+0.454)#482 | 1.10%(-0.058)#12,770 |
| 66. | Buxton | 1.02% | 0.59%(+0.430)#483 | 1.10%(-0.083)#12,771 |
| 67. | Fuquay Varina | 1.01% | 0.59%(+0.425)#484 | 1.10%(-0.088)#12,772 |
| 68. | Clemmons | 1.01% | 0.59%(+0.425)#485 | 1.10%(-0.088)#12,773 |
| 69. | Hickory | 1.01% | 0.59%(+0.420)#486 | 1.10%(-0.093)#12,774 |
| 70. | Warsaw | 0.98% | 0.59%(+0.399)#487 | 1.10%(-0.114)#12,775 |
| 71. | Porters Neck | 0.98% | 0.59%(+0.391)#488 | 1.10%(-0.121)#12,776 |
| 72. | Silver City | 0.98% | 0.59%(+0.391)#489 | 1.10%(-0.121)#12,777 |
| 73. | Bent Creek | 0.98% | 0.59%(+0.391)#490 | 1.10%(-0.122)#12,778 |
| 74. | Troutman | 0.98% | 0.59%(+0.390)#491 | 1.10%(-0.122)#12,779 |
| 75. | Spring Lake | 0.96% | 0.59%(+0.379)#492 | 1.10%(-0.133)#12,780 |
| 76. | Cricket | 0.96% | 0.59%(+0.378)#493 | 1.10%(-0.135)#12,781 |
| 77. | Long View | 0.95% | 0.59%(+0.369)#494 | 1.10%(-0.144)#12,782 |
| 78. | Seven Devils | 0.95% | 0.59%(+0.362)#495 | 1.10%(-0.150)#12,783 |
| 79. | Elroy | 0.94% | 0.59%(+0.359)#496 | 1.10%(-0.154)#12,784 |
| 80. | Hillsborough | 0.93% | 0.59%(+0.348)#497 | 1.10%(-0.165)#12,785 |
| 81. | Knightdale | 0.91% | 0.59%(+0.329)#498 | 1.10%(-0.183)#12,786 |
| 82. | Northwest | 0.91% | 0.59%(+0.325)#499 | 1.10%(-0.188)#12,787 |
| 83. | Carrboro | 0.90% | 0.59%(+0.318)#500 | 1.10%(-0.194)#12,788 |
| 84. | Concord | 0.90% | 0.59%(+0.317)#501 | 1.10%(-0.195)#12,789 |
| 85. | Pine Knoll Shores | 0.88% | 0.59%(+0.295)#502 | 1.10%(-0.218)#12,790 |
| 86. | Grandy | 0.86% | 0.59%(+0.276)#503 | 1.10%(-0.237)#12,791 |
| 87. | Oak Ridge | 0.85% | 0.59%(+0.266)#504 | 1.10%(-0.247)#12,792 |
| 88. | Wanchese | 0.85% | 0.59%(+0.262)#505 | 1.10%(-0.250)#12,793 |
| 89. | Cary | 0.83% | 0.59%(+0.249)#506 | 1.10%(-0.264)#12,794 |
| 90. | Raleigh | 0.82% | 0.59%(+0.237)#507 | 1.10%(-0.275)#12,795 |
| 91. | Davidson | 0.82% | 0.59%(+0.237)#508 | 1.10%(-0.276)#12,796 |
| 92. | High Point | 0.81% | 0.59%(+0.226)#509 | 1.10%(-0.287)#12,797 |
| 93. | Cornelius | 0.80% | 0.59%(+0.217)#510 | 1.10%(-0.296)#12,798 |
| 94. | Winston Salem | 0.80% | 0.59%(+0.213)#511 | 1.10%(-0.300)#12,799 |
| 95. | Hudson | 0.79% | 0.59%(+0.208)#512 | 1.10%(-0.305)#12,800 |
| 96. | Mooresville | 0.79% | 0.59%(+0.208)#513 | 1.10%(-0.305)#12,801 |
| 97. | Burlington | 0.78% | 0.59%(+0.190)#514 | 1.10%(-0.322)#12,802 |
| 98. | Clayton | 0.78% | 0.59%(+0.189)#515 | 1.10%(-0.323)#12,803 |
| 99. | Hope Mills | 0.76% | 0.59%(+0.173)#516 | 1.10%(-0.340)#12,804 |
| 100. | Apex | 0.74% | 0.59%(+0.150)#517 | 1.10%(-0.363)#12,805 |
Common Questions
What are the Top 10 Cities with the Highest Percentage of Immigrants from South America in North Carolina?
Top 10 Cities with the Highest Percentage of Immigrants from South America in North Carolina are:
#1
6.26%
#2
5.65%
#3
5.32%
#4
4.94%
#5
4.65%
#6
3.49%
#7
3.24%
#8
2.97%
#9
2.88%
#10
2.63%
What city has the Highest Percentage of Immigrants from South America in North Carolina?
Northchase has the Highest Percentage of Immigrants from South America in North Carolina with 6.26%.
What is the Percentage of Immigrants from South America in the State of North Carolina?
Percentage of Immigrants from South America in North Carolina is 0.59%.
What is the Percentage of Immigrants from South America in the United States?
Percentage of Immigrants from South America in the United States is 1.10%.