Cities with the Highest Percentage of Immigrants from South America in Illinois
RELATED REPORTS & OPTIONS
South America
Illinois
Compare Cities
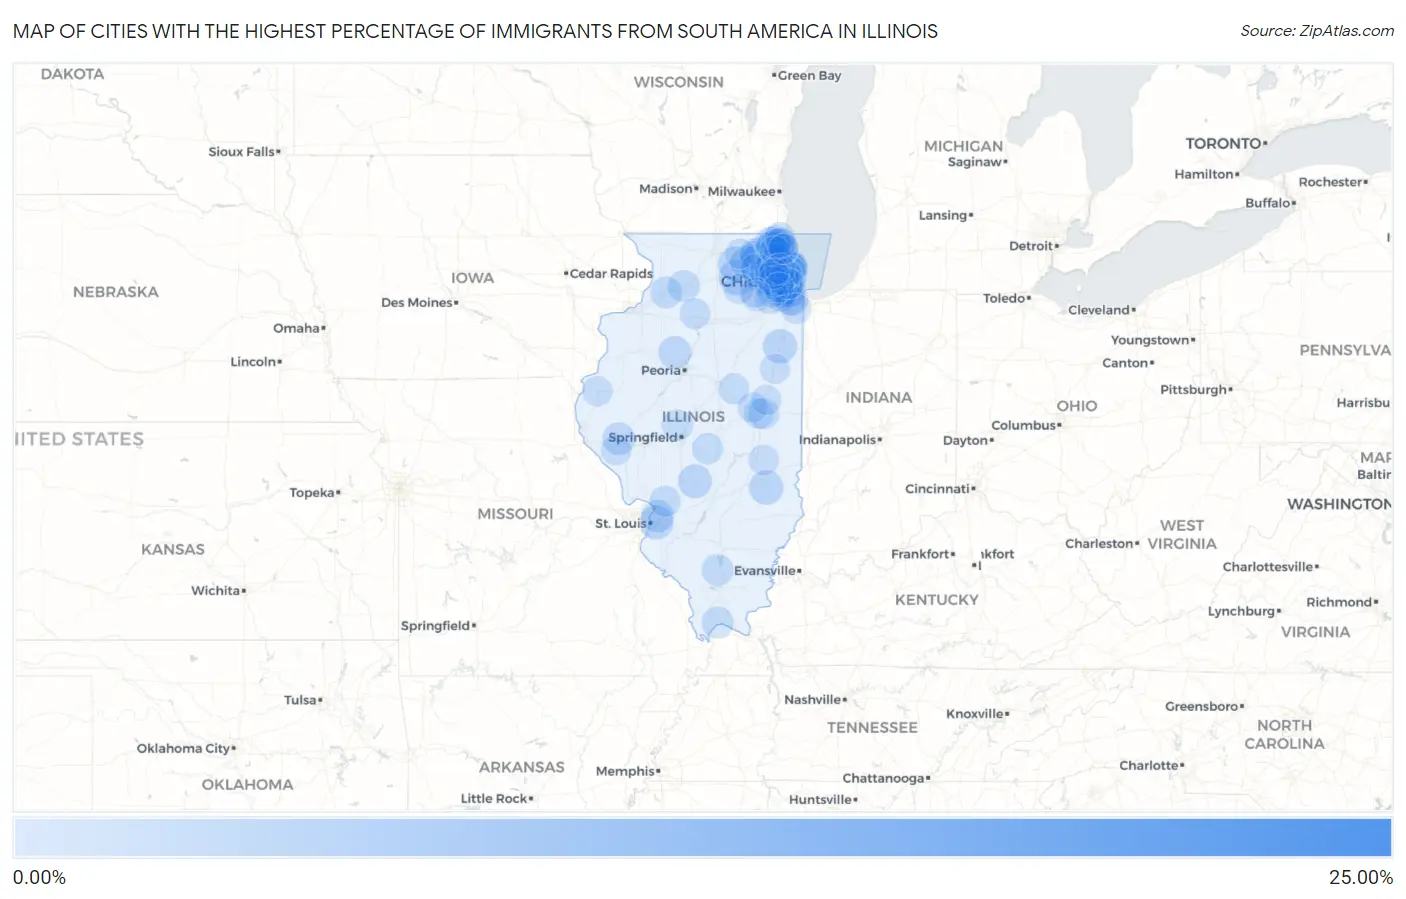
Map of Cities with the Highest Percentage of Immigrants from South America in Illinois
0.00%
25.00%
Cities with the Highest Percentage of Immigrants from South America in Illinois
| City | South America | vs State | vs National | |
| 1. | Andres | 21.95% | 0.55%(+21.4)#-1 | 1.10%(+20.9)#0 |
| 2. | Rosemont | 9.06% | 0.55%(+8.51)#15 | 1.10%(+7.96)#752 |
| 3. | East Dundee | 4.81% | 0.55%(+4.26)#147 | 1.10%(+3.72)#4,122 |
| 4. | River Grove | 4.01% | 0.55%(+3.46)#148 | 1.10%(+2.91)#4,123 |
| 5. | Cortland | 3.00% | 0.55%(+2.45)#382 | 1.10%(+1.90)#8,588 |
| 6. | Lyons | 2.53% | 0.55%(+1.97)#383 | 1.10%(+1.43)#8,589 |
| 7. | Rose Hill | 2.50% | 0.55%(+1.95)#384 | 1.10%(+1.40)#8,590 |
| 8. | Genoa | 2.40% | 0.55%(+1.85)#385 | 1.10%(+1.30)#8,591 |
| 9. | Elmwood Park | 2.40% | 0.55%(+1.85)#386 | 1.10%(+1.30)#8,592 |
| 10. | Chebanse | 2.39% | 0.55%(+1.84)#593 | 1.10%(+1.29)#12,736 |
| 11. | Washington Park | 2.37% | 0.55%(+1.82)#594 | 1.10%(+1.27)#12,737 |
| 12. | Indian Head Park | 2.34% | 0.55%(+1.79)#638 | 1.10%(+1.24)#13,480 |
| 13. | Irving | 2.32% | 0.55%(+1.77)#639 | 1.10%(+1.22)#13,481 |
| 14. | Carol Stream | 1.90% | 0.55%(+1.35)#640 | 1.10%(+0.801)#13,482 |
| 15. | Princeville | 1.89% | 0.55%(+1.34)#641 | 1.10%(+0.792)#13,483 |
| 16. | Pontoon Beach | 1.85% | 0.55%(+1.30)#642 | 1.10%(+0.756)#13,484 |
| 17. | Oakbrook Terrace | 1.82% | 0.55%(+1.27)#643 | 1.10%(+0.720)#13,485 |
| 18. | Countryside | 1.80% | 0.55%(+1.25)#644 | 1.10%(+0.705)#13,486 |
| 19. | Perry | 1.77% | 0.55%(+1.22)#645 | 1.10%(+0.675)#13,487 |
| 20. | Melrose Park | 1.70% | 0.55%(+1.15)#646 | 1.10%(+0.602)#13,488 |
| 21. | Hampshire | 1.68% | 0.55%(+1.12)#647 | 1.10%(+0.578)#13,489 |
| 22. | Franklin Park | 1.65% | 0.55%(+1.10)#648 | 1.10%(+0.556)#13,490 |
| 23. | Schiller Park | 1.64% | 0.55%(+1.09)#649 | 1.10%(+0.540)#13,491 |
| 24. | Wheeling | 1.61% | 0.55%(+1.06)#650 | 1.10%(+0.512)#13,492 |
| 25. | Hanover Park | 1.54% | 0.55%(+0.991)#651 | 1.10%(+0.444)#13,493 |
| 26. | Oakwood Hills | 1.49% | 0.55%(+0.943)#652 | 1.10%(+0.397)#13,494 |
| 27. | Nelson | 1.47% | 0.55%(+0.919)#653 | 1.10%(+0.372)#13,495 |
| 28. | Oak Brook | 1.46% | 0.55%(+0.912)#654 | 1.10%(+0.365)#13,496 |
| 29. | Buckner | 1.43% | 0.55%(+0.877)#655 | 1.10%(+0.330)#13,497 |
| 30. | New Grand Chain | 1.43% | 0.55%(+0.877)#656 | 1.10%(+0.330)#13,498 |
| 31. | Lyndon | 1.43% | 0.55%(+0.875)#657 | 1.10%(+0.328)#13,499 |
| 32. | Burbank | 1.32% | 0.55%(+0.771)#658 | 1.10%(+0.224)#13,500 |
| 33. | Hometown | 1.30% | 0.55%(+0.751)#659 | 1.10%(+0.204)#13,501 |
| 34. | Kenilworth | 1.30% | 0.55%(+0.749)#660 | 1.10%(+0.202)#13,502 |
| 35. | Chicago | 1.21% | 0.55%(+0.660)#661 | 1.10%(+0.114)#13,503 |
| 36. | Berwyn | 1.21% | 0.55%(+0.654)#662 | 1.10%(+0.108)#13,504 |
| 37. | Hoffman Estates | 1.20% | 0.55%(+0.649)#663 | 1.10%(+0.102)#13,505 |
| 38. | Streamwood | 1.17% | 0.55%(+0.622)#664 | 1.10%(+0.075)#13,506 |
| 39. | Athens | 1.17% | 0.55%(+0.616)#665 | 1.10%(+0.069)#13,507 |
| 40. | Urbana | 1.16% | 0.55%(+0.613)#666 | 1.10%(+0.066)#13,508 |
| 41. | Third Lake | 1.15% | 0.55%(+0.602)#667 | 1.10%(+0.055)#13,509 |
| 42. | Posen | 1.12% | 0.55%(+0.569)#668 | 1.10%(+0.023)#13,510 |
| 43. | Stonington | 1.10% | 0.55%(+0.547)#669 | 1.10%(+0.001)#13,511 |
| 44. | Harwood Heights | 1.10% | 0.55%(+0.544)#670 | 1.10%(-0.002)#13,512 |
| 45. | Grayslake | 1.09% | 0.55%(+0.540)#671 | 1.10%(-0.007)#13,513 |
| 46. | Holiday Shores | 1.07% | 0.55%(+0.514)#672 | 1.10%(-0.033)#13,514 |
| 47. | Green Oaks | 1.05% | 0.55%(+0.498)#673 | 1.10%(-0.048)#13,515 |
| 48. | North Chicago | 1.04% | 0.55%(+0.488)#674 | 1.10%(-0.059)#13,516 |
| 49. | Grandwood Park | 1.04% | 0.55%(+0.487)#675 | 1.10%(-0.060)#13,517 |
| 50. | West Chicago | 1.02% | 0.55%(+0.471)#676 | 1.10%(-0.076)#13,518 |
| 51. | Bensenville | 0.99% | 0.55%(+0.434)#677 | 1.10%(-0.113)#13,519 |
| 52. | Evanston | 0.98% | 0.55%(+0.424)#678 | 1.10%(-0.123)#13,520 |
| 53. | Crystal Lake | 0.96% | 0.55%(+0.410)#679 | 1.10%(-0.137)#13,521 |
| 54. | Ellsworth | 0.95% | 0.55%(+0.396)#680 | 1.10%(-0.150)#13,522 |
| 55. | Willow Springs | 0.94% | 0.55%(+0.387)#681 | 1.10%(-0.160)#13,523 |
| 56. | Lake In The Hills | 0.94% | 0.55%(+0.384)#682 | 1.10%(-0.162)#13,524 |
| 57. | Vernon Hills | 0.93% | 0.55%(+0.383)#683 | 1.10%(-0.164)#13,525 |
| 58. | Dover | 0.93% | 0.55%(+0.383)#684 | 1.10%(-0.164)#13,526 |
| 59. | Palos Park | 0.93% | 0.55%(+0.379)#685 | 1.10%(-0.168)#13,527 |
| 60. | Palatine | 0.92% | 0.55%(+0.369)#686 | 1.10%(-0.177)#13,528 |
| 61. | Knollwood | 0.91% | 0.55%(+0.356)#687 | 1.10%(-0.191)#13,529 |
| 62. | Midlothian | 0.90% | 0.55%(+0.350)#688 | 1.10%(-0.197)#13,530 |
| 63. | Bloomingdale | 0.90% | 0.55%(+0.349)#689 | 1.10%(-0.198)#13,531 |
| 64. | Charleston | 0.90% | 0.55%(+0.348)#690 | 1.10%(-0.199)#13,532 |
| 65. | Romeoville | 0.89% | 0.55%(+0.343)#691 | 1.10%(-0.204)#13,533 |
| 66. | Round Lake Beach | 0.89% | 0.55%(+0.337)#692 | 1.10%(-0.210)#13,534 |
| 67. | Gurnee | 0.88% | 0.55%(+0.327)#693 | 1.10%(-0.220)#13,535 |
| 68. | Schaumburg | 0.87% | 0.55%(+0.319)#694 | 1.10%(-0.228)#13,536 |
| 69. | Maywood | 0.85% | 0.55%(+0.295)#695 | 1.10%(-0.252)#13,537 |
| 70. | Glendale Heights | 0.83% | 0.55%(+0.283)#696 | 1.10%(-0.264)#13,538 |
| 71. | Mettawa | 0.83% | 0.55%(+0.280)#697 | 1.10%(-0.266)#13,539 |
| 72. | Norridge | 0.83% | 0.55%(+0.279)#698 | 1.10%(-0.268)#13,540 |
| 73. | Elgin | 0.83% | 0.55%(+0.275)#699 | 1.10%(-0.272)#13,541 |
| 74. | Lincolnwood | 0.82% | 0.55%(+0.270)#700 | 1.10%(-0.277)#13,542 |
| 75. | Pittsfield | 0.82% | 0.55%(+0.267)#701 | 1.10%(-0.279)#13,543 |
| 76. | Buffalo Grove | 0.81% | 0.55%(+0.259)#702 | 1.10%(-0.288)#13,544 |
| 77. | Round Lake Park | 0.81% | 0.55%(+0.259)#703 | 1.10%(-0.288)#13,545 |
| 78. | Chicago Heights | 0.81% | 0.55%(+0.256)#704 | 1.10%(-0.291)#13,546 |
| 79. | Cicero | 0.80% | 0.55%(+0.251)#705 | 1.10%(-0.295)#13,547 |
| 80. | Wadsworth | 0.78% | 0.55%(+0.232)#706 | 1.10%(-0.315)#13,548 |
| 81. | Gages Lake | 0.77% | 0.55%(+0.219)#707 | 1.10%(-0.327)#13,549 |
| 82. | Mundelein | 0.76% | 0.55%(+0.212)#708 | 1.10%(-0.335)#13,550 |
| 83. | Woodridge | 0.76% | 0.55%(+0.210)#709 | 1.10%(-0.337)#13,551 |
| 84. | Lombard | 0.76% | 0.55%(+0.207)#710 | 1.10%(-0.340)#13,552 |
| 85. | Berkeley | 0.74% | 0.55%(+0.187)#711 | 1.10%(-0.360)#13,553 |
| 86. | Champaign | 0.73% | 0.55%(+0.183)#712 | 1.10%(-0.364)#13,554 |
| 87. | Elk Grove Village | 0.71% | 0.55%(+0.162)#713 | 1.10%(-0.384)#13,555 |
| 88. | Des Plaines | 0.71% | 0.55%(+0.158)#714 | 1.10%(-0.389)#13,556 |
| 89. | Oswego | 0.71% | 0.55%(+0.155)#715 | 1.10%(-0.392)#13,557 |
| 90. | Carthage | 0.70% | 0.55%(+0.152)#716 | 1.10%(-0.395)#13,558 |
| 91. | Montgomery | 0.70% | 0.55%(+0.151)#717 | 1.10%(-0.396)#13,559 |
| 92. | Onarga | 0.70% | 0.55%(+0.147)#718 | 1.10%(-0.400)#13,560 |
| 93. | Hinckley | 0.70% | 0.55%(+0.145)#719 | 1.10%(-0.402)#13,561 |
| 94. | Mahomet | 0.69% | 0.55%(+0.140)#720 | 1.10%(-0.407)#13,562 |
| 95. | Waukegan | 0.69% | 0.55%(+0.135)#721 | 1.10%(-0.412)#13,563 |
| 96. | Itasca | 0.69% | 0.55%(+0.134)#722 | 1.10%(-0.413)#13,564 |
| 97. | Lake Bluff | 0.68% | 0.55%(+0.124)#723 | 1.10%(-0.422)#13,565 |
| 98. | Marengo | 0.67% | 0.55%(+0.118)#724 | 1.10%(-0.429)#13,566 |
| 99. | Hinsdale | 0.66% | 0.55%(+0.113)#725 | 1.10%(-0.434)#13,567 |
| 100. | Rantoul | 0.66% | 0.55%(+0.110)#726 | 1.10%(-0.437)#13,568 |
Common Questions
What are the Top 10 Cities with the Highest Percentage of Immigrants from South America in Illinois?
Top 10 Cities with the Highest Percentage of Immigrants from South America in Illinois are:
#1
9.06%
#2
4.81%
#3
4.01%
#4
3.00%
#5
2.53%
#6
2.50%
#7
2.40%
#8
2.40%
#9
2.39%
#10
2.37%
What city has the Highest Percentage of Immigrants from South America in Illinois?
Rosemont has the Highest Percentage of Immigrants from South America in Illinois with 9.06%.
What is the Percentage of Immigrants from South America in the State of Illinois?
Percentage of Immigrants from South America in Illinois is 0.55%.
What is the Percentage of Immigrants from South America in the United States?
Percentage of Immigrants from South America in the United States is 1.10%.