Cities with the Highest Percentage of Immigrants from South America in Arkansas
RELATED REPORTS & OPTIONS
South America
Arkansas
Compare Cities
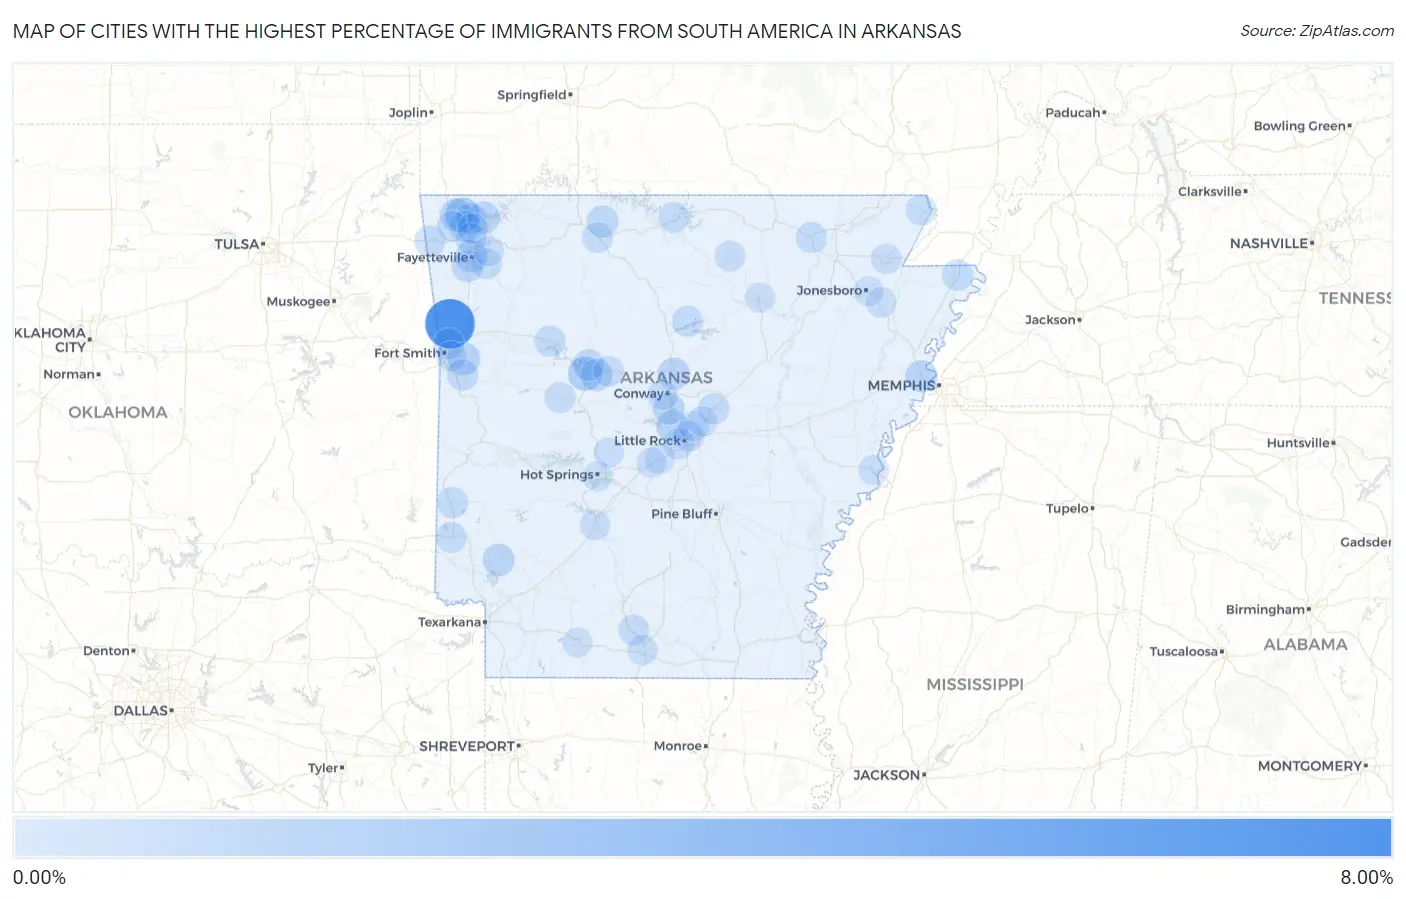
Map of Cities with the Highest Percentage of Immigrants from South America in Arkansas
0.00%
8.00%
Cities with the Highest Percentage of Immigrants from South America in Arkansas
| City | South America | vs State | vs National | |
| 1. | Cedarville | 6.20% | 0.16%(+6.04)#182 | 1.10%(+5.10)#10,694 |
| 2. | Bentonville | 1.42% | 0.16%(+1.26)#183 | 1.10%(+0.325)#10,695 |
| 3. | Dardanelle | 1.23% | 0.16%(+1.07)#184 | 1.10%(+0.134)#10,696 |
| 4. | Central City | 0.82% | 0.16%(+0.664)#185 | 1.10%(-0.275)#10,697 |
| 5. | Centerton | 0.76% | 0.16%(+0.597)#186 | 1.10%(-0.342)#10,698 |
| 6. | Mineral Springs | 0.70% | 0.16%(+0.539)#187 | 1.10%(-0.401)#10,699 |
| 7. | Maumelle | 0.69% | 0.16%(+0.529)#210 | 1.10%(-0.410)#12,163 |
| 8. | Greenbrier | 0.66% | 0.16%(+0.502)#211 | 1.10%(-0.438)#12,164 |
| 9. | Marion | 0.63% | 0.16%(+0.472)#240 | 1.10%(-0.468)#14,213 |
| 10. | Prairie Creek | 0.63% | 0.16%(+0.472)#241 | 1.10%(-0.468)#14,214 |
| 11. | Mayflower | 0.60% | 0.16%(+0.440)#242 | 1.10%(-0.500)#14,215 |
| 12. | Fayetteville | 0.59% | 0.16%(+0.430)#243 | 1.10%(-0.510)#14,216 |
| 13. | Pottsville | 0.57% | 0.16%(+0.414)#244 | 1.10%(-0.525)#14,217 |
| 14. | Greenland | 0.56% | 0.16%(+0.403)#245 | 1.10%(-0.536)#14,218 |
| 15. | Russellville | 0.49% | 0.16%(+0.332)#246 | 1.10%(-0.608)#14,219 |
| 16. | Bergman | 0.47% | 0.16%(+0.315)#247 | 1.10%(-0.625)#14,220 |
| 17. | Rogers | 0.42% | 0.16%(+0.257)#248 | 1.10%(-0.682)#14,221 |
| 18. | Siloam Springs | 0.41% | 0.16%(+0.250)#249 | 1.10%(-0.690)#14,222 |
| 19. | Cave Springs | 0.40% | 0.16%(+0.240)#250 | 1.10%(-0.700)#14,223 |
| 20. | Greenwood | 0.37% | 0.16%(+0.208)#251 | 1.10%(-0.732)#14,224 |
| 21. | Clarksville | 0.36% | 0.16%(+0.201)#252 | 1.10%(-0.739)#14,225 |
| 22. | Fairfield Bay | 0.35% | 0.16%(+0.191)#253 | 1.10%(-0.749)#14,226 |
| 23. | Wickes | 0.35% | 0.16%(+0.187)#254 | 1.10%(-0.753)#14,227 |
| 24. | Mountain Home | 0.30% | 0.16%(+0.144)#255 | 1.10%(-0.795)#14,228 |
| 25. | Cabot | 0.30% | 0.16%(+0.143)#256 | 1.10%(-0.797)#14,229 |
| 26. | De Queen | 0.29% | 0.16%(+0.135)#257 | 1.10%(-0.805)#14,230 |
| 27. | Springdale | 0.29% | 0.16%(+0.127)#258 | 1.10%(-0.812)#14,231 |
| 28. | Imboden | 0.27% | 0.16%(+0.111)#259 | 1.10%(-0.829)#14,232 |
| 29. | Blytheville | 0.26% | 0.16%(+0.105)#260 | 1.10%(-0.835)#14,233 |
| 30. | Danville | 0.25% | 0.16%(+0.093)#261 | 1.10%(-0.847)#14,234 |
| 31. | Little Rock | 0.25% | 0.16%(+0.091)#262 | 1.10%(-0.849)#14,235 |
| 32. | Elkins | 0.25% | 0.16%(+0.089)#263 | 1.10%(-0.851)#14,236 |
| 33. | Van Buren | 0.24% | 0.16%(+0.076)#264 | 1.10%(-0.863)#14,237 |
| 34. | Piggott | 0.22% | 0.16%(+0.063)#265 | 1.10%(-0.877)#14,238 |
| 35. | North Little Rock | 0.21% | 0.16%(+0.049)#266 | 1.10%(-0.890)#14,239 |
| 36. | Melbourne | 0.21% | 0.16%(+0.047)#267 | 1.10%(-0.893)#14,240 |
| 37. | Smackover | 0.20% | 0.16%(+0.044)#268 | 1.10%(-0.896)#14,241 |
| 38. | Bellefonte | 0.19% | 0.16%(+0.033)#269 | 1.10%(-0.906)#14,242 |
| 39. | Highfill | 0.18% | 0.16%(+0.020)#270 | 1.10%(-0.920)#14,243 |
| 40. | Atkins | 0.17% | 0.16%(+0.016)#271 | 1.10%(-0.924)#14,244 |
| 41. | Lowell | 0.17% | 0.16%(+0.011)#272 | 1.10%(-0.928)#14,245 |
| 42. | Arkadelphia | 0.14% | 0.16%(-0.014)#273 | 1.10%(-0.953)#14,246 |
| 43. | Fort Smith | 0.11% | 0.16%(-0.049)#274 | 1.10%(-0.989)#14,247 |
| 44. | El Dorado | 0.11% | 0.16%(-0.051)#275 | 1.10%(-0.990)#14,248 |
| 45. | Helena West Helena | 0.11% | 0.16%(-0.053)#276 | 1.10%(-0.993)#14,249 |
| 46. | Bay | 0.084% | 0.16%(-0.075)#277 | 1.10%(-1.01)#14,250 |
| 47. | Paragould | 0.081% | 0.16%(-0.078)#278 | 1.10%(-1.02)#14,251 |
| 48. | Goshen | 0.076% | 0.16%(-0.083)#279 | 1.10%(-1.02)#14,252 |
| 49. | Sherwood | 0.073% | 0.16%(-0.085)#280 | 1.10%(-1.02)#14,253 |
| 50. | Conway | 0.063% | 0.16%(-0.096)#281 | 1.10%(-1.04)#14,254 |
| 51. | Hot Springs Village | 0.053% | 0.16%(-0.105)#282 | 1.10%(-1.04)#14,255 |
| 52. | Hot Springs | 0.050% | 0.16%(-0.109)#283 | 1.10%(-1.05)#14,256 |
| 53. | Jacksonville | 0.044% | 0.16%(-0.114)#284 | 1.10%(-1.05)#14,257 |
| 54. | Bryant | 0.039% | 0.16%(-0.120)#285 | 1.10%(-1.06)#14,258 |
| 55. | Magnolia | 0.036% | 0.16%(-0.122)#286 | 1.10%(-1.06)#14,259 |
| 56. | Batesville | 0.036% | 0.16%(-0.123)#287 | 1.10%(-1.06)#14,260 |
| 57. | Benton | 0.020% | 0.16%(-0.139)#288 | 1.10%(-1.08)#14,261 |
| 58. | Jonesboro | 0.0089% | 0.16%(-0.150)#289 | 1.10%(-1.09)#14,262 |
Common Questions
What are the Top 10 Cities with the Highest Percentage of Immigrants from South America in Arkansas?
Top 10 Cities with the Highest Percentage of Immigrants from South America in Arkansas are:
#1
6.20%
#2
1.42%
#3
1.23%
#4
0.82%
#5
0.76%
#6
0.70%
#7
0.69%
#8
0.66%
#9
0.63%
#10
0.63%
What city has the Highest Percentage of Immigrants from South America in Arkansas?
Cedarville has the Highest Percentage of Immigrants from South America in Arkansas with 6.20%.
What is the Percentage of Immigrants from South America in the State of Arkansas?
Percentage of Immigrants from South America in Arkansas is 0.16%.
What is the Percentage of Immigrants from South America in the United States?
Percentage of Immigrants from South America in the United States is 1.10%.