Cities with the Highest Percentage of Immigrants from South America in Kansas
RELATED REPORTS & OPTIONS
South America
Kansas
Compare Cities
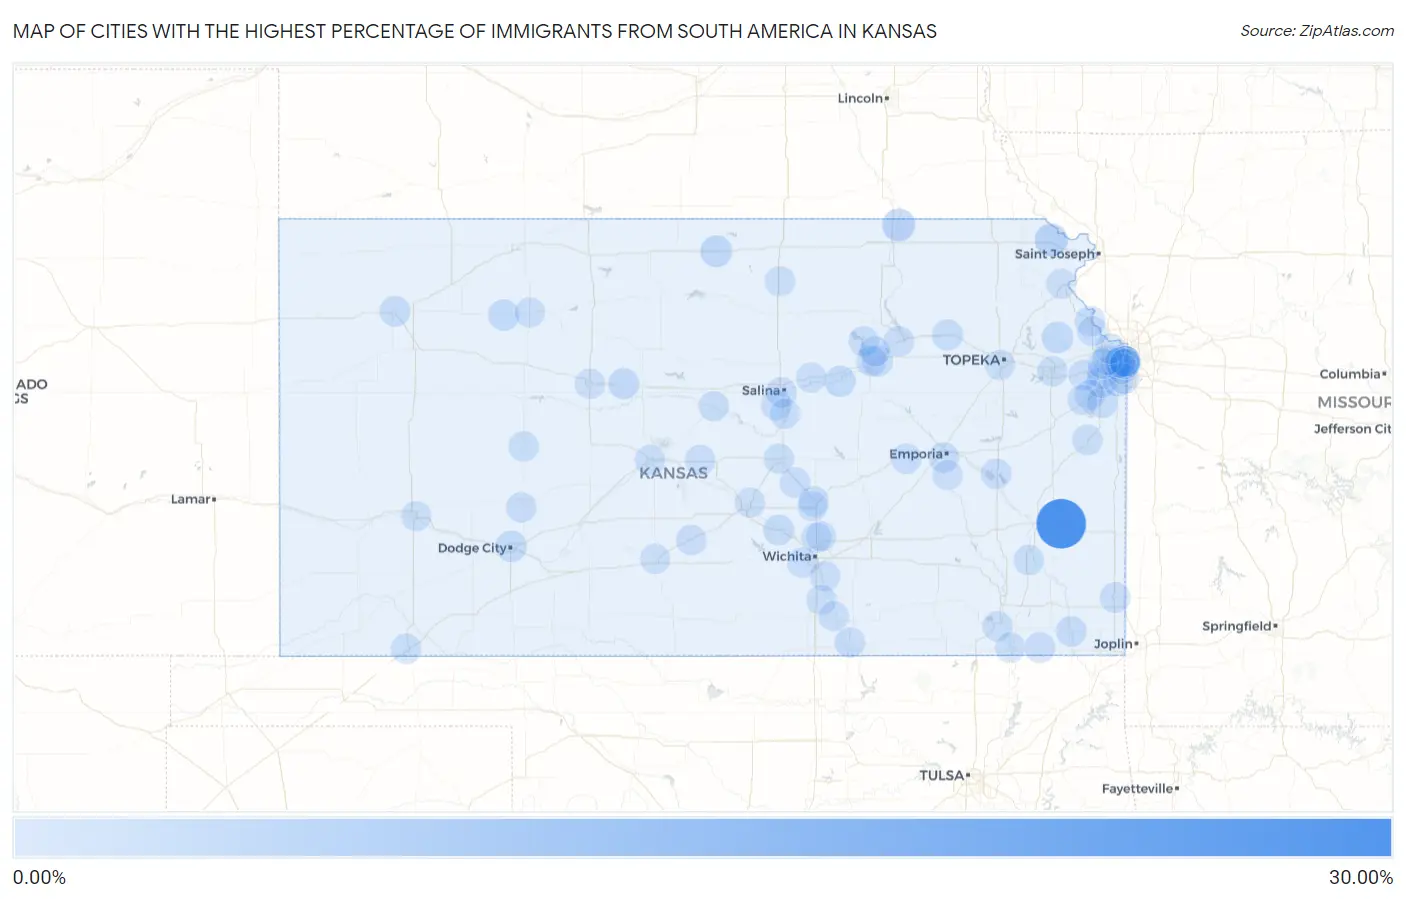
Map of Cities with the Highest Percentage of Immigrants from South America in Kansas
0.00%
30.00%
Cities with the Highest Percentage of Immigrants from South America in Kansas
| City | South America | vs State | vs National | |
| 1. | Moran | 26.60% | 0.25%(+26.3)#-1 | 1.10%(+25.5)#0 |
| 2. | Highland | 3.44% | 0.25%(+3.18)#228 | 1.10%(+2.34)#13,433 |
| 3. | Oketo | 3.36% | 0.25%(+3.11)#229 | 1.10%(+2.26)#13,434 |
| 4. | Roeland Park | 3.07% | 0.25%(+2.81)#230 | 1.10%(+1.97)#13,435 |
| 5. | Mankato | 2.18% | 0.25%(+1.93)#231 | 1.10%(+1.09)#13,436 |
| 6. | Mclouth | 1.86% | 0.25%(+1.60)#232 | 1.10%(+0.759)#13,437 |
| 7. | Morland | 1.44% | 0.25%(+1.18)#233 | 1.10%(+0.341)#13,438 |
| 8. | Dodge City | 1.38% | 0.25%(+1.13)#234 | 1.10%(+0.283)#13,439 |
| 9. | Enterprise | 1.15% | 0.25%(+0.899)#235 | 1.10%(+0.056)#13,440 |
| 10. | Gorham | 1.12% | 0.25%(+0.866)#236 | 1.10%(+0.022)#13,441 |
| 11. | Belvue | 1.07% | 0.25%(+0.815)#237 | 1.10%(-0.029)#13,442 |
| 12. | Grandview Plaza | 0.95% | 0.25%(+0.695)#238 | 1.10%(-0.149)#13,443 |
| 13. | Colby | 0.81% | 0.25%(+0.560)#239 | 1.10%(-0.284)#13,444 |
| 14. | Spring Hill | 0.77% | 0.25%(+0.518)#240 | 1.10%(-0.325)#13,445 |
| 15. | Mount Hope | 0.73% | 0.25%(+0.479)#241 | 1.10%(-0.365)#13,446 |
| 16. | Westwood Hills | 0.68% | 0.25%(+0.421)#242 | 1.10%(-0.423)#13,447 |
| 17. | Oswego | 0.67% | 0.25%(+0.415)#243 | 1.10%(-0.428)#13,448 |
| 18. | Olathe | 0.65% | 0.25%(+0.396)#244 | 1.10%(-0.447)#13,449 |
| 19. | Mission Woods | 0.65% | 0.25%(+0.391)#245 | 1.10%(-0.453)#13,450 |
| 20. | Smolan | 0.61% | 0.25%(+0.351)#246 | 1.10%(-0.492)#13,451 |
| 21. | Pittsburg | 0.60% | 0.25%(+0.347)#247 | 1.10%(-0.497)#13,452 |
| 22. | Edna | 0.57% | 0.25%(+0.317)#248 | 1.10%(-0.527)#13,453 |
| 23. | Lenexa | 0.53% | 0.25%(+0.272)#249 | 1.10%(-0.571)#13,454 |
| 24. | New Strawn | 0.47% | 0.25%(+0.216)#250 | 1.10%(-0.628)#13,455 |
| 25. | De Soto | 0.46% | 0.25%(+0.210)#251 | 1.10%(-0.634)#13,456 |
| 26. | Overland Park | 0.45% | 0.25%(+0.198)#252 | 1.10%(-0.646)#13,457 |
| 27. | Cottonwood Falls | 0.45% | 0.25%(+0.196)#253 | 1.10%(-0.648)#13,458 |
| 28. | Merriam | 0.43% | 0.25%(+0.179)#254 | 1.10%(-0.665)#13,459 |
| 29. | Manhattan | 0.43% | 0.25%(+0.175)#255 | 1.10%(-0.669)#13,460 |
| 30. | Chase | 0.41% | 0.25%(+0.156)#256 | 1.10%(-0.688)#13,461 |
| 31. | Great Bend | 0.41% | 0.25%(+0.153)#257 | 1.10%(-0.691)#13,462 |
| 32. | Arkansas City | 0.39% | 0.25%(+0.137)#258 | 1.10%(-0.707)#13,463 |
| 33. | Salina | 0.38% | 0.25%(+0.126)#259 | 1.10%(-0.717)#13,464 |
| 34. | Gardner | 0.38% | 0.25%(+0.124)#260 | 1.10%(-0.719)#13,465 |
| 35. | Moundridge | 0.38% | 0.25%(+0.123)#261 | 1.10%(-0.721)#13,466 |
| 36. | Turon | 0.38% | 0.25%(+0.121)#262 | 1.10%(-0.722)#13,467 |
| 37. | Osawatomie | 0.35% | 0.25%(+0.098)#263 | 1.10%(-0.746)#13,468 |
| 38. | Junction City | 0.34% | 0.25%(+0.088)#264 | 1.10%(-0.755)#13,469 |
| 39. | Wichita | 0.33% | 0.25%(+0.080)#265 | 1.10%(-0.764)#13,470 |
| 40. | Leawood | 0.33% | 0.25%(+0.074)#266 | 1.10%(-0.770)#13,603 |
| 41. | Emporia | 0.33% | 0.25%(+0.073)#267 | 1.10%(-0.771)#13,604 |
| 42. | Milford | 0.32% | 0.25%(+0.062)#268 | 1.10%(-0.782)#13,605 |
| 43. | Lawrence | 0.31% | 0.25%(+0.056)#269 | 1.10%(-0.788)#13,606 |
| 44. | Mcpherson | 0.29% | 0.25%(+0.032)#270 | 1.10%(-0.812)#13,607 |
| 45. | Jetmore | 0.28% | 0.25%(+0.028)#271 | 1.10%(-0.816)#13,608 |
| 46. | Fort Riley | 0.28% | 0.25%(+0.024)#272 | 1.10%(-0.820)#13,609 |
| 47. | Leavenworth | 0.28% | 0.25%(+0.022)#273 | 1.10%(-0.821)#13,610 |
| 48. | Assaria | 0.25% | 0.25%(-0.009)#274 | 1.10%(-0.853)#13,611 |
| 49. | Ness City | 0.24% | 0.25%(-0.013)#275 | 1.10%(-0.857)#13,612 |
| 50. | Chanute | 0.24% | 0.25%(-0.014)#276 | 1.10%(-0.857)#13,613 |
| 51. | North Newton | 0.24% | 0.25%(-0.017)#277 | 1.10%(-0.861)#13,614 |
| 52. | Liberal | 0.24% | 0.25%(-0.019)#278 | 1.10%(-0.863)#13,615 |
| 53. | Ellsworth | 0.23% | 0.25%(-0.027)#279 | 1.10%(-0.871)#13,616 |
| 54. | Westwood | 0.22% | 0.25%(-0.036)#280 | 1.10%(-0.880)#13,617 |
| 55. | Prairie Village | 0.21% | 0.25%(-0.041)#281 | 1.10%(-0.885)#13,618 |
| 56. | Olpe | 0.21% | 0.25%(-0.047)#282 | 1.10%(-0.891)#13,619 |
| 57. | Lake Quivira | 0.20% | 0.25%(-0.053)#283 | 1.10%(-0.897)#13,620 |
| 58. | Shawnee | 0.20% | 0.25%(-0.054)#284 | 1.10%(-0.897)#13,621 |
| 59. | Derby | 0.20% | 0.25%(-0.055)#285 | 1.10%(-0.899)#13,622 |
| 60. | Hill City | 0.19% | 0.25%(-0.066)#286 | 1.10%(-0.910)#13,623 |
| 61. | Hays | 0.18% | 0.25%(-0.070)#287 | 1.10%(-0.914)#13,624 |
| 62. | Mission | 0.18% | 0.25%(-0.073)#288 | 1.10%(-0.916)#13,625 |
| 63. | Kansas City | 0.18% | 0.25%(-0.075)#289 | 1.10%(-0.919)#13,626 |
| 64. | Mission Hills | 0.17% | 0.25%(-0.086)#290 | 1.10%(-0.930)#13,627 |
| 65. | Edgerton | 0.16% | 0.25%(-0.096)#291 | 1.10%(-0.940)#13,628 |
| 66. | Topeka | 0.16% | 0.25%(-0.098)#292 | 1.10%(-0.942)#13,629 |
| 67. | Garden City | 0.15% | 0.25%(-0.101)#293 | 1.10%(-0.944)#13,630 |
| 68. | Belle Plaine | 0.14% | 0.25%(-0.116)#294 | 1.10%(-0.960)#13,631 |
| 69. | Independence | 0.13% | 0.25%(-0.126)#295 | 1.10%(-0.970)#13,881 |
| 70. | Lansing | 0.12% | 0.25%(-0.130)#296 | 1.10%(-0.974)#13,882 |
| 71. | Concordia | 0.12% | 0.25%(-0.136)#297 | 1.10%(-0.980)#13,883 |
| 72. | Oxford | 0.11% | 0.25%(-0.140)#298 | 1.10%(-0.984)#13,884 |
| 73. | Newton | 0.11% | 0.25%(-0.147)#299 | 1.10%(-0.990)#13,885 |
| 74. | Pratt | 0.11% | 0.25%(-0.148)#300 | 1.10%(-0.992)#13,886 |
| 75. | Solomon | 0.093% | 0.25%(-0.162)#301 | 1.10%(-1.01)#13,887 |
| 76. | Park City | 0.091% | 0.25%(-0.164)#302 | 1.10%(-1.01)#13,888 |
| 77. | Coffeyville | 0.090% | 0.25%(-0.164)#303 | 1.10%(-1.01)#13,889 |
| 78. | Hutchinson | 0.060% | 0.25%(-0.195)#304 | 1.10%(-1.04)#13,890 |
| 79. | Kechi | 0.034% | 0.25%(-0.221)#305 | 1.10%(-1.06)#13,891 |
| 80. | Atchison | 0.018% | 0.25%(-0.236)#306 | 1.10%(-1.08)#13,892 |
Common Questions
What are the Top 10 Cities with the Highest Percentage of Immigrants from South America in Kansas?
Top 10 Cities with the Highest Percentage of Immigrants from South America in Kansas are:
#1
26.60%
#2
3.44%
#3
3.36%
#4
3.07%
#5
2.18%
#6
1.86%
#7
1.44%
#8
1.38%
#9
1.15%
#10
1.12%
What city has the Highest Percentage of Immigrants from South America in Kansas?
Moran has the Highest Percentage of Immigrants from South America in Kansas with 26.60%.
What is the Percentage of Immigrants from South America in the State of Kansas?
Percentage of Immigrants from South America in Kansas is 0.25%.
What is the Percentage of Immigrants from South America in the United States?
Percentage of Immigrants from South America in the United States is 1.10%.