Cities with the Highest Percentage of Immigrants from South America in Pennsylvania
RELATED REPORTS & OPTIONS
South America
Pennsylvania
Compare Cities
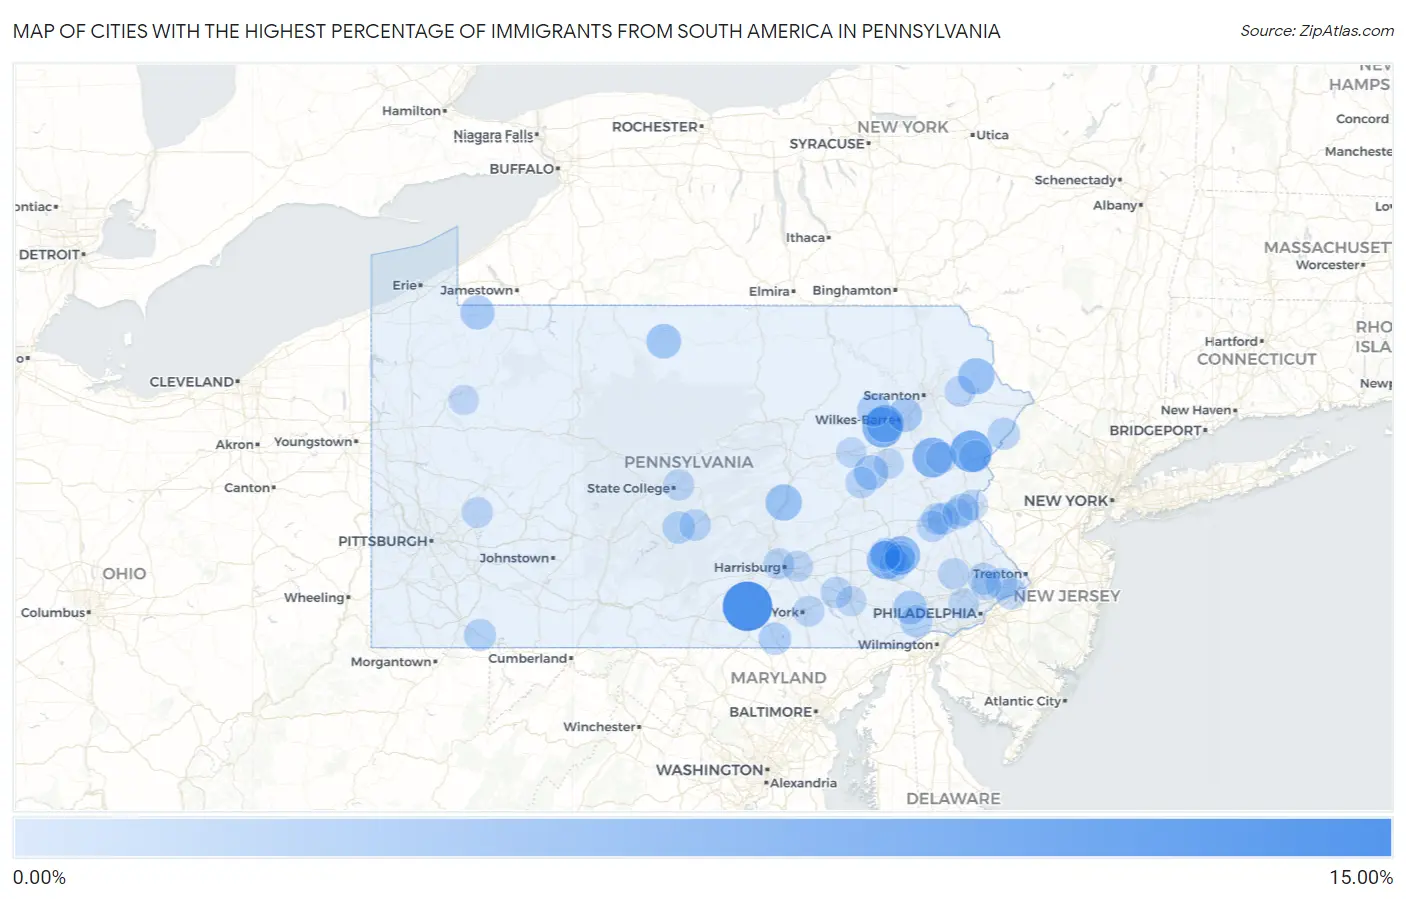
Map of Cities with the Highest Percentage of Immigrants from South America in Pennsylvania
0.00%
15.00%
Cities with the Highest Percentage of Immigrants from South America in Pennsylvania
| City | South America | vs State | vs National | |
| 1. | Gardners | 13.40% | 0.49%(+12.9)#9 | 1.10%(+12.3)#1,357 |
| 2. | Penn Estates | 8.45% | 0.49%(+7.96)#10 | 1.10%(+7.35)#1,358 |
| 3. | Sheatown | 7.31% | 0.49%(+6.82)#11 | 1.10%(+6.21)#1,359 |
| 4. | Towamensing Trails | 7.18% | 0.49%(+6.70)#12 | 1.10%(+6.09)#1,360 |
| 5. | Le Raysville Borough | 6.92% | 0.49%(+6.43)#13 | 1.10%(+5.82)#1,361 |
| 6. | Lincoln Park | 6.41% | 0.49%(+5.92)#33 | 1.10%(+5.31)#3,395 |
| 7. | Catawissa Borough | 6.27% | 0.49%(+5.79)#34 | 1.10%(+5.17)#3,396 |
| 8. | Stony Creek Mills | 5.90% | 0.49%(+5.41)#35 | 1.10%(+4.80)#3,397 |
| 9. | West Nanticoke | 5.68% | 0.49%(+5.20)#54 | 1.10%(+4.58)#4,979 |
| 10. | Shillington Borough | 5.09% | 0.49%(+4.61)#113 | 1.10%(+4.00)#7,267 |
| 11. | White Mills | 4.96% | 0.49%(+4.47)#114 | 1.10%(+3.86)#7,268 |
| 12. | Port Trevorton | 4.93% | 0.49%(+4.44)#115 | 1.10%(+3.83)#7,269 |
| 13. | Schellsburg Borough | 4.35% | 0.49%(+3.86)#116 | 1.10%(+3.25)#7,270 |
| 14. | Sweden Valley | 3.92% | 0.49%(+3.44)#117 | 1.10%(+2.82)#7,271 |
| 15. | Sheppton | 3.77% | 0.49%(+3.29)#118 | 1.10%(+2.68)#7,272 |
| 16. | Columbus | 3.64% | 0.49%(+3.16)#119 | 1.10%(+2.54)#7,273 |
| 17. | Hudson | 3.62% | 0.49%(+3.14)#120 | 1.10%(+2.52)#7,274 |
| 18. | Wilson Borough | 3.48% | 0.49%(+3.00)#138 | 1.10%(+2.39)#7,984 |
| 19. | Stroudsburg Borough | 3.37% | 0.49%(+2.89)#139 | 1.10%(+2.28)#7,985 |
| 20. | Caln | 3.35% | 0.49%(+2.86)#140 | 1.10%(+2.25)#7,986 |
| 21. | Baden Borough | 3.21% | 0.49%(+2.73)#141 | 1.10%(+2.11)#7,987 |
| 22. | Pikes Creek | 3.08% | 0.49%(+2.59)#142 | 1.10%(+1.98)#7,988 |
| 23. | Mifflintown Borough | 3.05% | 0.49%(+2.56)#143 | 1.10%(+1.95)#7,989 |
| 24. | Telford Borough | 2.95% | 0.49%(+2.47)#166 | 1.10%(+1.86)#8,637 |
| 25. | Freemansburg Borough | 2.94% | 0.49%(+2.45)#187 | 1.10%(+1.84)#9,240 |
| 26. | New Hope Borough | 2.93% | 0.49%(+2.45)#188 | 1.10%(+1.84)#9,241 |
| 27. | Mount Holly Springs Borough | 2.92% | 0.49%(+2.44)#189 | 1.10%(+1.83)#9,242 |
| 28. | Middletown | 2.73% | 0.49%(+2.25)#326 | 1.10%(+1.63)#12,071 |
| 29. | Jonestown Borough | 2.73% | 0.49%(+2.24)#412 | 1.10%(+1.63)#13,617 |
| 30. | Clarion Borough | 2.59% | 0.49%(+2.11)#413 | 1.10%(+1.49)#13,618 |
| 31. | Parkville | 2.59% | 0.49%(+2.10)#414 | 1.10%(+1.49)#13,619 |
| 32. | Allensville | 2.55% | 0.49%(+2.06)#415 | 1.10%(+1.45)#13,620 |
| 33. | Unionville | 2.49% | 0.49%(+2.01)#416 | 1.10%(+1.39)#13,621 |
| 34. | Farmington | 2.47% | 0.49%(+1.99)#417 | 1.10%(+1.37)#13,622 |
| 35. | Port Royal Borough | 2.47% | 0.49%(+1.98)#418 | 1.10%(+1.37)#13,623 |
| 36. | Pocono Mountain Lake Estates | 2.36% | 0.49%(+1.88)#419 | 1.10%(+1.27)#13,624 |
| 37. | Arlington Heights | 2.33% | 0.49%(+1.84)#420 | 1.10%(+1.23)#13,625 |
| 38. | Allentown | 2.29% | 0.49%(+1.81)#421 | 1.10%(+1.19)#13,626 |
| 39. | Flying Hills | 2.27% | 0.49%(+1.79)#422 | 1.10%(+1.17)#13,627 |
| 40. | Horsham | 2.26% | 0.49%(+1.77)#423 | 1.10%(+1.16)#13,628 |
| 41. | Spring Ridge | 2.23% | 0.49%(+1.74)#424 | 1.10%(+1.13)#13,629 |
| 42. | Trevose | 2.22% | 0.49%(+1.74)#425 | 1.10%(+1.13)#13,630 |
| 43. | Ambler Borough | 2.17% | 0.49%(+1.68)#426 | 1.10%(+1.07)#13,631 |
| 44. | Bendersville Borough | 2.11% | 0.49%(+1.62)#427 | 1.10%(+1.01)#13,632 |
| 45. | Strodes Mills | 2.10% | 0.49%(+1.61)#428 | 1.10%(+0.998)#13,633 |
| 46. | Cetronia | 2.06% | 0.49%(+1.57)#429 | 1.10%(+0.963)#13,634 |
| 47. | Shenandoah Heights | 2.02% | 0.49%(+1.54)#430 | 1.10%(+0.926)#13,635 |
| 48. | Croydon | 2.00% | 0.49%(+1.51)#431 | 1.10%(+0.901)#13,636 |
| 49. | Salunga | 1.99% | 0.49%(+1.50)#432 | 1.10%(+0.893)#13,637 |
| 50. | Pitcairn Borough | 1.98% | 0.49%(+1.49)#433 | 1.10%(+0.880)#13,638 |
| 51. | Ancient Oaks | 1.96% | 0.49%(+1.47)#434 | 1.10%(+0.857)#13,639 |
| 52. | Skippack | 1.87% | 0.49%(+1.38)#435 | 1.10%(+0.770)#13,640 |
| 53. | Lemont | 1.82% | 0.49%(+1.34)#436 | 1.10%(+0.724)#13,641 |
| 54. | Indian Mountain Lake | 1.80% | 0.49%(+1.32)#437 | 1.10%(+0.707)#13,642 |
| 55. | Mckinley | 1.80% | 0.49%(+1.31)#438 | 1.10%(+0.701)#13,643 |
| 56. | Roslyn | 1.79% | 0.49%(+1.30)#439 | 1.10%(+0.690)#13,644 |
| 57. | Enola | 1.77% | 0.49%(+1.28)#440 | 1.10%(+0.673)#13,645 |
| 58. | Pennsburg Borough | 1.76% | 0.49%(+1.28)#441 | 1.10%(+0.664)#13,646 |
| 59. | Alburtis Borough | 1.75% | 0.49%(+1.27)#442 | 1.10%(+0.653)#13,647 |
| 60. | East York | 1.75% | 0.49%(+1.26)#443 | 1.10%(+0.653)#13,648 |
| 61. | Rutherford | 1.75% | 0.49%(+1.26)#444 | 1.10%(+0.652)#13,649 |
| 62. | Reiffton | 1.74% | 0.49%(+1.25)#445 | 1.10%(+0.642)#13,650 |
| 63. | Rosemont | 1.74% | 0.49%(+1.25)#446 | 1.10%(+0.637)#13,651 |
| 64. | Hyde Park | 1.72% | 0.49%(+1.23)#447 | 1.10%(+0.617)#13,652 |
| 65. | The Hideout | 1.69% | 0.49%(+1.21)#448 | 1.10%(+0.593)#13,653 |
| 66. | Tatamy Borough | 1.69% | 0.49%(+1.20)#449 | 1.10%(+0.589)#13,654 |
| 67. | Mckees Rocks Borough | 1.68% | 0.49%(+1.19)#450 | 1.10%(+0.582)#13,655 |
| 68. | Hatboro Borough | 1.68% | 0.49%(+1.19)#451 | 1.10%(+0.577)#13,656 |
| 69. | Topton Borough | 1.67% | 0.49%(+1.18)#452 | 1.10%(+0.571)#13,657 |
| 70. | Pennside | 1.66% | 0.49%(+1.18)#453 | 1.10%(+0.564)#13,658 |
| 71. | Bethlehem | 1.63% | 0.49%(+1.14)#454 | 1.10%(+0.529)#13,659 |
| 72. | Easton | 1.63% | 0.49%(+1.14)#455 | 1.10%(+0.529)#13,660 |
| 73. | Akron Borough | 1.60% | 0.49%(+1.11)#456 | 1.10%(+0.498)#13,661 |
| 74. | Downingtown Borough | 1.57% | 0.49%(+1.08)#457 | 1.10%(+0.472)#13,662 |
| 75. | Yardley Borough | 1.54% | 0.49%(+1.06)#458 | 1.10%(+0.446)#13,663 |
| 76. | Phoenixville Borough | 1.53% | 0.49%(+1.05)#459 | 1.10%(+0.435)#13,664 |
| 77. | Bryn Mawr | 1.53% | 0.49%(+1.04)#460 | 1.10%(+0.427)#13,665 |
| 78. | Bridgeport Borough | 1.52% | 0.49%(+1.03)#461 | 1.10%(+0.422)#13,666 |
| 79. | Whitfield | 1.52% | 0.49%(+1.03)#462 | 1.10%(+0.420)#13,667 |
| 80. | Mcadoo Borough | 1.51% | 0.49%(+1.02)#463 | 1.10%(+0.412)#13,668 |
| 81. | Adamstown Borough | 1.50% | 0.49%(+1.02)#464 | 1.10%(+0.406)#13,669 |
| 82. | Kennett Square Borough | 1.45% | 0.49%(+0.968)#465 | 1.10%(+0.356)#13,670 |
| 83. | Lansford Borough | 1.45% | 0.49%(+0.967)#466 | 1.10%(+0.355)#13,671 |
| 84. | Mount Carmel Borough | 1.40% | 0.49%(+0.911)#467 | 1.10%(+0.300)#13,672 |
| 85. | Macungie Borough | 1.39% | 0.49%(+0.899)#468 | 1.10%(+0.287)#13,673 |
| 86. | East Bangor Borough | 1.38% | 0.49%(+0.892)#469 | 1.10%(+0.280)#13,674 |
| 87. | Parryville Borough | 1.35% | 0.49%(+0.865)#470 | 1.10%(+0.253)#13,675 |
| 88. | Newell Borough | 1.35% | 0.49%(+0.861)#471 | 1.10%(+0.249)#13,676 |
| 89. | Mifflinville | 1.33% | 0.49%(+0.842)#472 | 1.10%(+0.231)#13,677 |
| 90. | Seneca | 1.32% | 0.49%(+0.831)#473 | 1.10%(+0.219)#13,678 |
| 91. | Chalfont Borough | 1.31% | 0.49%(+0.828)#474 | 1.10%(+0.217)#13,679 |
| 92. | Abbottstown Borough | 1.29% | 0.49%(+0.808)#475 | 1.10%(+0.196)#13,680 |
| 93. | Duncansville Borough | 1.29% | 0.49%(+0.802)#476 | 1.10%(+0.190)#13,681 |
| 94. | Hazleton | 1.28% | 0.49%(+0.798)#477 | 1.10%(+0.186)#13,682 |
| 95. | Mohnton Borough | 1.27% | 0.49%(+0.779)#478 | 1.10%(+0.168)#13,683 |
| 96. | Hayti | 1.26% | 0.49%(+0.771)#479 | 1.10%(+0.159)#13,684 |
| 97. | New Holland Borough | 1.26% | 0.49%(+0.769)#480 | 1.10%(+0.157)#13,685 |
| 98. | Coraopolis Borough | 1.25% | 0.49%(+0.766)#481 | 1.10%(+0.154)#13,686 |
| 99. | Lancaster | 1.24% | 0.49%(+0.749)#482 | 1.10%(+0.137)#13,687 |
| 100. | Willow Grove | 1.21% | 0.49%(+0.727)#483 | 1.10%(+0.115)#14,133 |
Common Questions
What are the Top 10 Cities with the Highest Percentage of Immigrants from South America in Pennsylvania?
Top 10 Cities with the Highest Percentage of Immigrants from South America in Pennsylvania are:
#1
13.40%
#2
8.45%
#3
7.31%
#4
7.18%
#5
6.41%
#6
5.90%
#7
5.68%
#8
4.96%
#9
4.93%
#10
3.92%
What city has the Highest Percentage of Immigrants from South America in Pennsylvania?
Gardners has the Highest Percentage of Immigrants from South America in Pennsylvania with 13.40%.
What is the Percentage of Immigrants from South America in the State of Pennsylvania?
Percentage of Immigrants from South America in Pennsylvania is 0.49%.
What is the Percentage of Immigrants from South America in the United States?
Percentage of Immigrants from South America in the United States is 1.10%.