Cities with the Highest Percentage of Immigrants from South America in Colorado
RELATED REPORTS & OPTIONS
South America
Colorado
Compare Cities
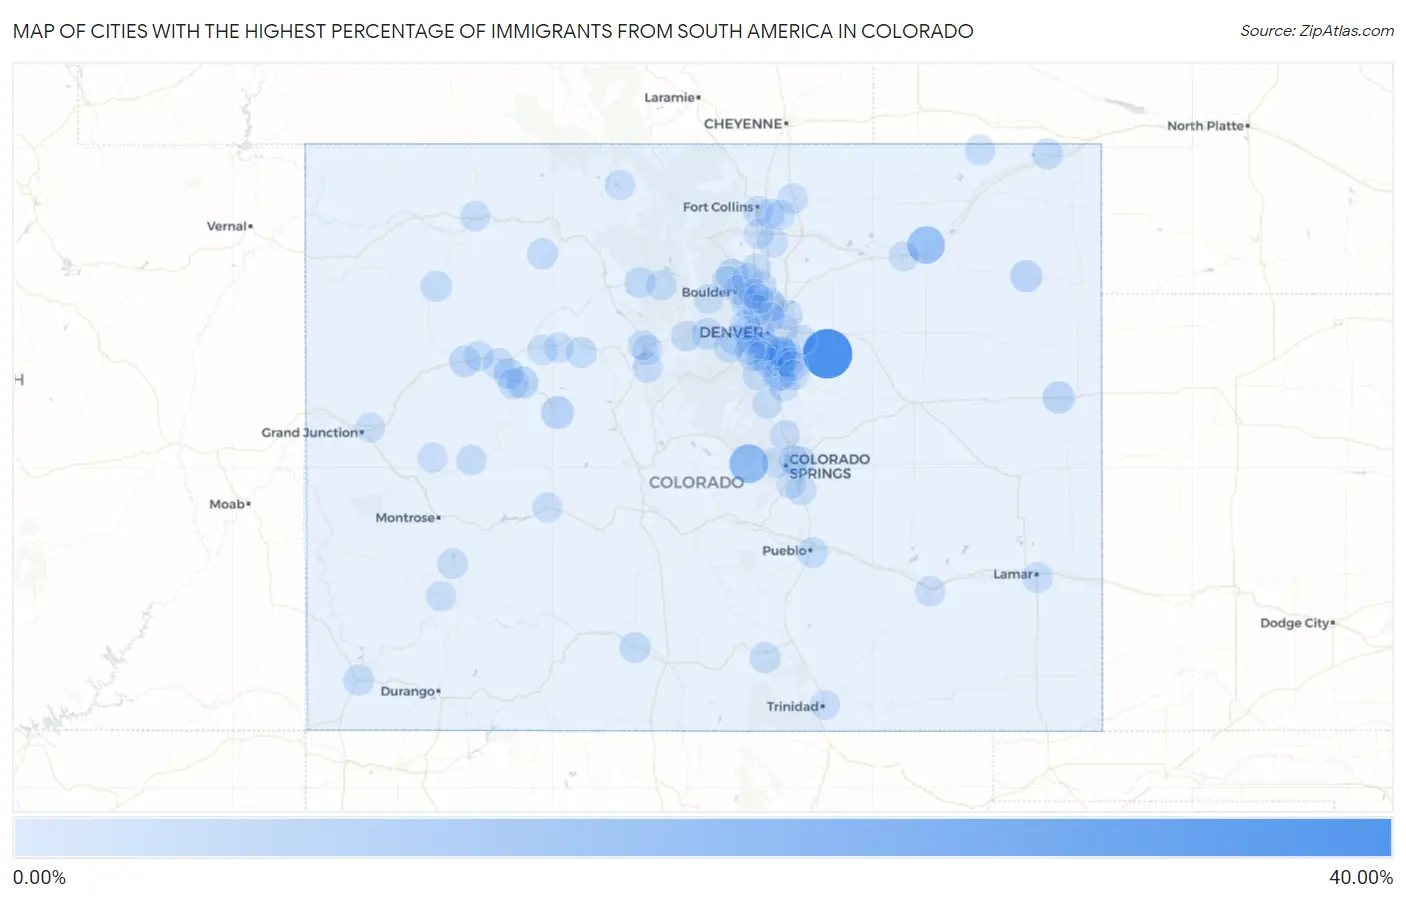
Map of Cities with the Highest Percentage of Immigrants from South America in Colorado
0.00%
40.00%
Cities with the Highest Percentage of Immigrants from South America in Colorado
| City | South America | vs State | vs National | |
| 1. | Brick Center | 35.23% | 0.51%(+34.7)#-1 | 1.10%(+34.1)#0 |
| 2. | Midland | 15.29% | 0.51%(+14.8)#0 | 1.10%(+14.2)#1 |
| 3. | Snyder | 13.21% | 0.51%(+12.7)#1 | 1.10%(+12.1)#2 |
| 4. | Aspen | 4.76% | 0.51%(+4.25)#206 | 1.10%(+3.66)#10,627 |
| 5. | Altona | 4.14% | 0.51%(+3.63)#207 | 1.10%(+3.04)#10,628 |
| 6. | Catherine | 3.73% | 0.51%(+3.22)#208 | 1.10%(+2.63)#10,629 |
| 7. | Yuma | 3.72% | 0.51%(+3.21)#209 | 1.10%(+2.62)#10,630 |
| 8. | Bethune | 3.69% | 0.51%(+3.18)#210 | 1.10%(+2.59)#10,631 |
| 9. | Dove Valley | 2.94% | 0.51%(+2.44)#211 | 1.10%(+1.85)#10,632 |
| 10. | Silt | 2.66% | 0.51%(+2.16)#212 | 1.10%(+1.57)#10,633 |
| 11. | Idaho Springs | 2.51% | 0.51%(+2.00)#213 | 1.10%(+1.41)#10,634 |
| 12. | Park Center | 2.43% | 0.51%(+1.92)#214 | 1.10%(+1.33)#10,635 |
| 13. | Glenwood Springs | 2.02% | 0.51%(+1.51)#215 | 1.10%(+0.922)#10,636 |
| 14. | Meeker | 2.00% | 0.51%(+1.49)#216 | 1.10%(+0.902)#10,637 |
| 15. | Monte Vista | 1.93% | 0.51%(+1.42)#217 | 1.10%(+0.830)#10,638 |
| 16. | Oak Creek | 1.91% | 0.51%(+1.40)#218 | 1.10%(+0.811)#10,639 |
| 17. | Sedgwick | 1.87% | 0.51%(+1.37)#219 | 1.10%(+0.777)#10,640 |
| 18. | Edwards | 1.87% | 0.51%(+1.37)#220 | 1.10%(+0.777)#10,641 |
| 19. | Cortez | 1.82% | 0.51%(+1.31)#221 | 1.10%(+0.725)#10,642 |
| 20. | Salt Creek | 1.77% | 0.51%(+1.26)#247 | 1.10%(+0.674)#13,779 |
| 21. | Inverness | 1.77% | 0.51%(+1.26)#248 | 1.10%(+0.669)#13,780 |
| 22. | Carbondale | 1.74% | 0.51%(+1.23)#249 | 1.10%(+0.641)#13,781 |
| 23. | Cattle Creek | 1.67% | 0.51%(+1.16)#250 | 1.10%(+0.575)#13,782 |
| 24. | Four Square Mile | 1.66% | 0.51%(+1.15)#251 | 1.10%(+0.559)#13,783 |
| 25. | Hot Sulphur Springs | 1.66% | 0.51%(+1.15)#252 | 1.10%(+0.557)#13,784 |
| 26. | Castle Pines Village | 1.59% | 0.51%(+1.08)#253 | 1.10%(+0.493)#13,785 |
| 27. | Castle Pines | 1.54% | 0.51%(+1.03)#254 | 1.10%(+0.443)#13,786 |
| 28. | Cimarron Hills | 1.50% | 0.51%(+0.994)#255 | 1.10%(+0.404)#13,787 |
| 29. | La Veta | 1.45% | 0.51%(+0.938)#256 | 1.10%(+0.348)#13,788 |
| 30. | Peetz | 1.30% | 0.51%(+0.791)#257 | 1.10%(+0.200)#13,789 |
| 31. | Northglenn | 1.16% | 0.51%(+0.654)#258 | 1.10%(+0.064)#13,790 |
| 32. | Breckenridge | 1.16% | 0.51%(+0.648)#259 | 1.10%(+0.058)#13,791 |
| 33. | Lamar | 1.12% | 0.51%(+0.614)#260 | 1.10%(+0.023)#13,792 |
| 34. | Louisville | 1.09% | 0.51%(+0.577)#261 | 1.10%(-0.013)#13,793 |
| 35. | Lazy Acres | 1.08% | 0.51%(+0.577)#262 | 1.10%(-0.013)#13,794 |
| 36. | Paonia | 1.08% | 0.51%(+0.574)#263 | 1.10%(-0.016)#13,795 |
| 37. | Niwot | 1.08% | 0.51%(+0.567)#264 | 1.10%(-0.023)#13,796 |
| 38. | Granby | 1.06% | 0.51%(+0.553)#265 | 1.10%(-0.038)#13,797 |
| 39. | Ridgway | 1.01% | 0.51%(+0.498)#266 | 1.10%(-0.092)#13,798 |
| 40. | Superior | 0.95% | 0.51%(+0.443)#267 | 1.10%(-0.147)#13,799 |
| 41. | Georgetown | 0.91% | 0.51%(+0.398)#268 | 1.10%(-0.192)#13,800 |
| 42. | Johnstown | 0.88% | 0.51%(+0.369)#269 | 1.10%(-0.221)#13,801 |
| 43. | Denver | 0.87% | 0.51%(+0.365)#270 | 1.10%(-0.226)#13,802 |
| 44. | Walden | 0.85% | 0.51%(+0.344)#271 | 1.10%(-0.246)#13,803 |
| 45. | Commerce City | 0.85% | 0.51%(+0.339)#272 | 1.10%(-0.251)#13,804 |
| 46. | Edgewater | 0.84% | 0.51%(+0.332)#273 | 1.10%(-0.259)#13,805 |
| 47. | Applewood | 0.83% | 0.51%(+0.318)#274 | 1.10%(-0.272)#13,806 |
| 48. | Manitou Springs | 0.83% | 0.51%(+0.317)#275 | 1.10%(-0.273)#13,807 |
| 49. | Lone Tree | 0.81% | 0.51%(+0.299)#276 | 1.10%(-0.291)#13,808 |
| 50. | Boulder | 0.80% | 0.51%(+0.297)#277 | 1.10%(-0.293)#13,809 |
| 51. | Centennial | 0.80% | 0.51%(+0.296)#278 | 1.10%(-0.294)#13,810 |
| 52. | Pierce | 0.79% | 0.51%(+0.278)#279 | 1.10%(-0.312)#13,811 |
| 53. | Aurora | 0.74% | 0.51%(+0.229)#280 | 1.10%(-0.361)#13,812 |
| 54. | Greenwood Village | 0.73% | 0.51%(+0.219)#281 | 1.10%(-0.371)#13,813 |
| 55. | Cherry Creek | 0.73% | 0.51%(+0.218)#282 | 1.10%(-0.372)#13,814 |
| 56. | Dillon | 0.72% | 0.51%(+0.214)#283 | 1.10%(-0.376)#13,815 |
| 57. | Fort Collins | 0.71% | 0.51%(+0.205)#284 | 1.10%(-0.385)#13,816 |
| 58. | La Junta | 0.69% | 0.51%(+0.182)#285 | 1.10%(-0.408)#13,817 |
| 59. | Castle Rock | 0.69% | 0.51%(+0.178)#286 | 1.10%(-0.412)#13,818 |
| 60. | Longmont | 0.66% | 0.51%(+0.153)#287 | 1.10%(-0.437)#13,819 |
| 61. | Thornton | 0.65% | 0.51%(+0.146)#288 | 1.10%(-0.444)#13,820 |
| 62. | Silverthorne | 0.64% | 0.51%(+0.129)#289 | 1.10%(-0.461)#13,821 |
| 63. | Mountain Village | 0.63% | 0.51%(+0.124)#290 | 1.10%(-0.466)#13,822 |
| 64. | Erie | 0.62% | 0.51%(+0.113)#291 | 1.10%(-0.478)#13,823 |
| 65. | Genesee | 0.62% | 0.51%(+0.110)#292 | 1.10%(-0.480)#13,824 |
| 66. | Westminster | 0.62% | 0.51%(+0.107)#293 | 1.10%(-0.483)#13,825 |
| 67. | New Castle | 0.62% | 0.51%(+0.107)#294 | 1.10%(-0.483)#13,826 |
| 68. | Fort Morgan | 0.61% | 0.51%(+0.100)#295 | 1.10%(-0.490)#13,827 |
| 69. | Englewood | 0.60% | 0.51%(+0.092)#296 | 1.10%(-0.498)#13,828 |
| 70. | Perry Park | 0.58% | 0.51%(+0.076)#297 | 1.10%(-0.514)#13,829 |
| 71. | Highlands Ranch | 0.56% | 0.51%(+0.052)#298 | 1.10%(-0.538)#13,830 |
| 72. | Stonegate | 0.52% | 0.51%(+0.014)#299 | 1.10%(-0.576)#13,831 |
| 73. | Craig | 0.51% | 0.51%(+0.002)#300 | 1.10%(-0.588)#13,832 |
| 74. | Fountain | 0.51% | 0.51%(-0.003)#301 | 1.10%(-0.593)#13,833 |
| 75. | Sheridan | 0.49% | 0.51%(-0.013)#302 | 1.10%(-0.603)#13,834 |
| 76. | Ken Caryl | 0.48% | 0.51%(-0.028)#303 | 1.10%(-0.618)#13,835 |
| 77. | Parker | 0.48% | 0.51%(-0.031)#304 | 1.10%(-0.622)#13,836 |
| 78. | Lafayette | 0.48% | 0.51%(-0.033)#305 | 1.10%(-0.623)#13,837 |
| 79. | Lakewood | 0.46% | 0.51%(-0.052)#306 | 1.10%(-0.642)#13,838 |
| 80. | Littleton | 0.45% | 0.51%(-0.060)#307 | 1.10%(-0.650)#13,839 |
| 81. | Gypsum | 0.43% | 0.51%(-0.074)#308 | 1.10%(-0.664)#13,840 |
| 82. | Fairmount | 0.43% | 0.51%(-0.075)#309 | 1.10%(-0.666)#13,841 |
| 83. | Fort Carson | 0.41% | 0.51%(-0.094)#310 | 1.10%(-0.684)#13,842 |
| 84. | Loveland | 0.40% | 0.51%(-0.106)#311 | 1.10%(-0.696)#13,843 |
| 85. | Roxborough Park | 0.40% | 0.51%(-0.111)#312 | 1.10%(-0.701)#13,844 |
| 86. | The Pinery | 0.39% | 0.51%(-0.119)#313 | 1.10%(-0.709)#13,845 |
| 87. | Eagle | 0.39% | 0.51%(-0.121)#314 | 1.10%(-0.711)#13,846 |
| 88. | Trinidad | 0.38% | 0.51%(-0.124)#315 | 1.10%(-0.714)#13,847 |
| 89. | Colorado Springs | 0.38% | 0.51%(-0.129)#316 | 1.10%(-0.719)#13,848 |
| 90. | Welby | 0.37% | 0.51%(-0.140)#317 | 1.10%(-0.730)#13,849 |
| 91. | Timnath | 0.37% | 0.51%(-0.143)#318 | 1.10%(-0.733)#13,850 |
| 92. | Gunnison | 0.36% | 0.51%(-0.146)#319 | 1.10%(-0.736)#13,851 |
| 93. | Dakota Ridge | 0.36% | 0.51%(-0.152)#320 | 1.10%(-0.742)#13,852 |
| 94. | Cedaredge | 0.35% | 0.51%(-0.158)#321 | 1.10%(-0.748)#14,184 |
| 95. | Severance | 0.32% | 0.51%(-0.191)#322 | 1.10%(-0.782)#14,185 |
| 96. | Evergreen | 0.31% | 0.51%(-0.196)#323 | 1.10%(-0.786)#14,276 |
| 97. | Gleneagle | 0.31% | 0.51%(-0.197)#324 | 1.10%(-0.787)#14,277 |
| 98. | Nederland | 0.28% | 0.51%(-0.225)#325 | 1.10%(-0.815)#14,278 |
| 99. | Broomfield | 0.26% | 0.51%(-0.250)#326 | 1.10%(-0.840)#14,279 |
| 100. | Fruitvale | 0.24% | 0.51%(-0.271)#327 | 1.10%(-0.861)#14,280 |
Common Questions
What are the Top 10 Cities with the Highest Percentage of Immigrants from South America in Colorado?
Top 10 Cities with the Highest Percentage of Immigrants from South America in Colorado are:
#1
35.23%
#2
15.29%
#3
13.21%
#4
4.76%
#5
4.14%
#6
3.73%
#7
3.72%
#8
3.69%
#9
2.94%
#10
2.66%
What city has the Highest Percentage of Immigrants from South America in Colorado?
Brick Center has the Highest Percentage of Immigrants from South America in Colorado with 35.23%.
What is the Percentage of Immigrants from South America in the State of Colorado?
Percentage of Immigrants from South America in Colorado is 0.51%.
What is the Percentage of Immigrants from South America in the United States?
Percentage of Immigrants from South America in the United States is 1.10%.