Cities with the Highest Percentage of Immigrants from South America in Ohio
RELATED REPORTS & OPTIONS
South America
Ohio
Compare Cities
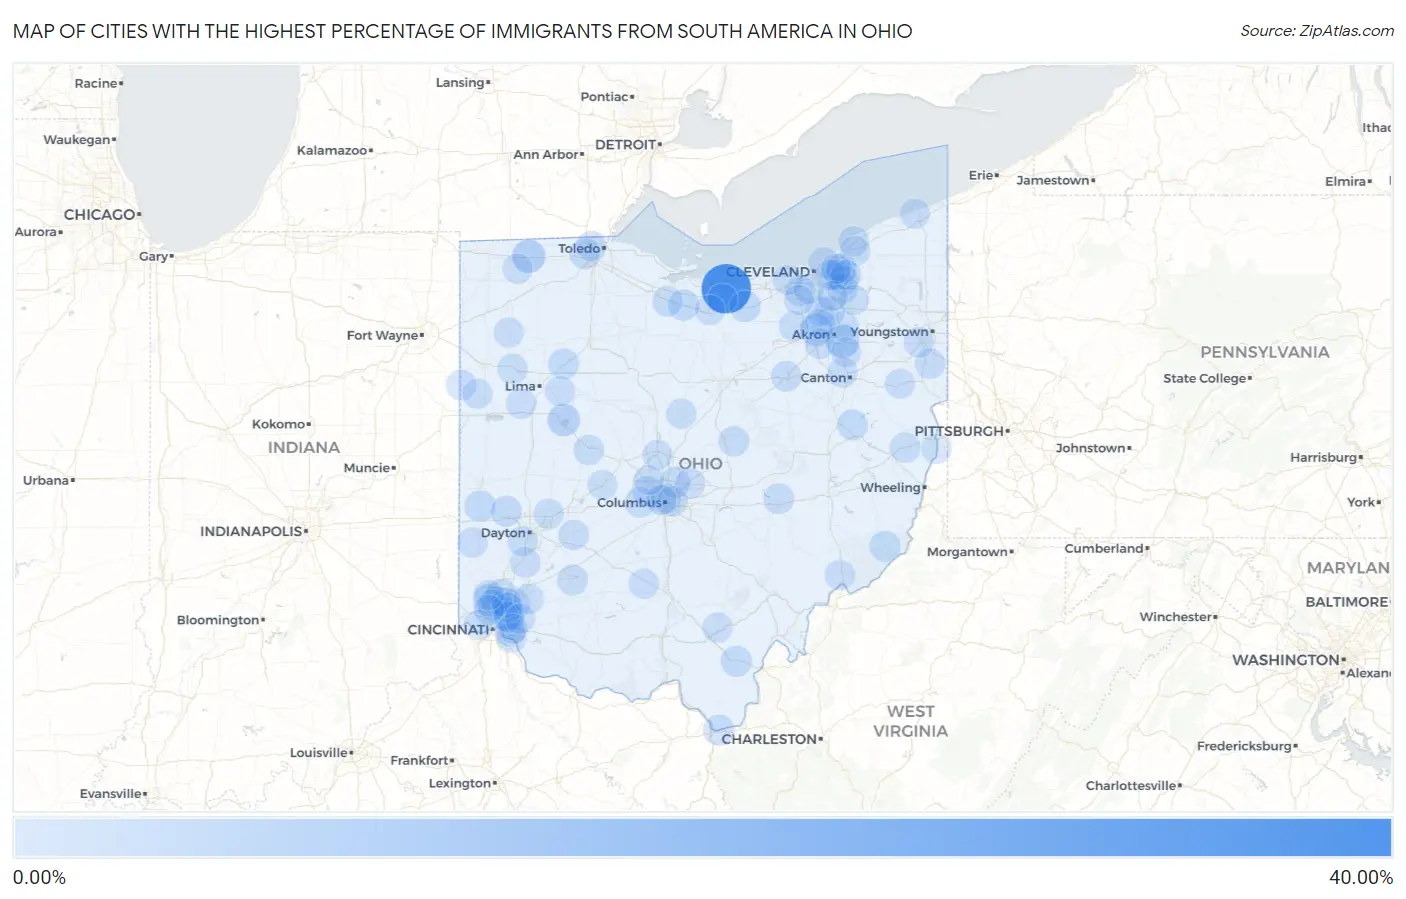
Map of Cities with the Highest Percentage of Immigrants from South America in Ohio
0.00%
40.00%
Cities with the Highest Percentage of Immigrants from South America in Ohio
| City | South America | vs State | vs National | |
| 1. | Mitiwanga | 36.55% | 0.19%(+36.4)#-1 | 1.10%(+35.4)#0 |
| 2. | Sawyerwood | 6.37% | 0.19%(+6.18)#0 | 1.10%(+5.27)#1 |
| 3. | Tedrow | 6.00% | 0.19%(+5.81)#27 | 1.10%(+4.90)#4,198 |
| 4. | Chippewa Park | 4.62% | 0.19%(+4.42)#28 | 1.10%(+3.52)#4,199 |
| 5. | Pigeon Creek | 4.56% | 0.19%(+4.37)#29 | 1.10%(+3.46)#4,200 |
| 6. | Pleasant Run Farm | 2.94% | 0.19%(+2.74)#289 | 1.10%(+1.84)#13,129 |
| 7. | Kipton | 2.63% | 0.19%(+2.44)#290 | 1.10%(+1.53)#13,130 |
| 8. | Castine | 2.48% | 0.19%(+2.28)#291 | 1.10%(+1.38)#13,131 |
| 9. | Bellevue | 2.30% | 0.19%(+2.11)#394 | 1.10%(+1.20)#14,269 |
| 10. | Antioch | 2.13% | 0.19%(+1.93)#395 | 1.10%(+1.03)#14,270 |
| 11. | Rio Grande | 2.10% | 0.19%(+1.91)#396 | 1.10%(+1.00)#14,271 |
| 12. | Bass Lake | 1.85% | 0.19%(+1.66)#397 | 1.10%(+0.756)#14,272 |
| 13. | Roswell | 1.84% | 0.19%(+1.65)#398 | 1.10%(+0.745)#14,273 |
| 14. | Burlington | 1.76% | 0.19%(+1.57)#399 | 1.10%(+0.664)#14,274 |
| 15. | Phillipsburg | 1.76% | 0.19%(+1.56)#400 | 1.10%(+0.661)#14,275 |
| 16. | Bluffton | 1.58% | 0.19%(+1.39)#401 | 1.10%(+0.484)#14,276 |
| 17. | Kenwood | 1.53% | 0.19%(+1.34)#402 | 1.10%(+0.434)#14,277 |
| 18. | Wilmington | 1.45% | 0.19%(+1.26)#403 | 1.10%(+0.354)#14,278 |
| 19. | Valley Hi | 1.29% | 0.19%(+1.10)#404 | 1.10%(+0.192)#14,279 |
| 20. | Hopedale | 1.29% | 0.19%(+1.09)#405 | 1.10%(+0.191)#14,280 |
| 21. | Holland | 1.28% | 0.19%(+1.09)#406 | 1.10%(+0.183)#14,281 |
| 22. | North Zanesville | 1.25% | 0.19%(+1.06)#407 | 1.10%(+0.155)#14,282 |
| 23. | Lake Darby | 1.23% | 0.19%(+1.03)#408 | 1.10%(+0.127)#14,283 |
| 24. | Clyde | 1.17% | 0.19%(+0.977)#409 | 1.10%(+0.074)#14,284 |
| 25. | Beckett Ridge | 1.14% | 0.19%(+0.949)#410 | 1.10%(+0.045)#14,285 |
| 26. | Coldstream | 1.13% | 0.19%(+0.937)#411 | 1.10%(+0.034)#14,286 |
| 27. | Gambier | 1.10% | 0.19%(+0.905)#412 | 1.10%(+0.002)#14,287 |
| 28. | Bratenahl | 1.05% | 0.19%(+0.860)#413 | 1.10%(-0.043)#14,288 |
| 29. | Hilliard | 1.05% | 0.19%(+0.852)#414 | 1.10%(-0.051)#14,289 |
| 30. | Huber Ridge | 1.05% | 0.19%(+0.851)#415 | 1.10%(-0.052)#14,290 |
| 31. | Springdale | 1.02% | 0.19%(+0.824)#416 | 1.10%(-0.079)#14,291 |
| 32. | Greenhills | 0.97% | 0.19%(+0.778)#417 | 1.10%(-0.126)#14,292 |
| 33. | Mentor | 0.96% | 0.19%(+0.761)#418 | 1.10%(-0.143)#14,293 |
| 34. | Silverton | 0.94% | 0.19%(+0.747)#419 | 1.10%(-0.156)#14,294 |
| 35. | Wooster | 0.94% | 0.19%(+0.745)#420 | 1.10%(-0.158)#14,295 |
| 36. | Columbiana | 0.93% | 0.19%(+0.732)#421 | 1.10%(-0.171)#14,296 |
| 37. | Cedarville | 0.92% | 0.19%(+0.725)#422 | 1.10%(-0.179)#14,297 |
| 38. | Frankfort | 0.89% | 0.19%(+0.699)#423 | 1.10%(-0.205)#14,298 |
| 39. | Hanoverton | 0.89% | 0.19%(+0.696)#424 | 1.10%(-0.208)#14,299 |
| 40. | Pepper Pike | 0.87% | 0.19%(+0.676)#425 | 1.10%(-0.228)#14,300 |
| 41. | Sixteen Mile Stand | 0.87% | 0.19%(+0.676)#426 | 1.10%(-0.228)#14,301 |
| 42. | Springboro | 0.83% | 0.19%(+0.633)#427 | 1.10%(-0.271)#14,302 |
| 43. | Norton | 0.79% | 0.19%(+0.596)#428 | 1.10%(-0.308)#14,303 |
| 44. | Hills And Dales | 0.79% | 0.19%(+0.593)#429 | 1.10%(-0.311)#14,304 |
| 45. | Willshire | 0.78% | 0.19%(+0.583)#430 | 1.10%(-0.321)#14,305 |
| 46. | Buckland | 0.78% | 0.19%(+0.581)#431 | 1.10%(-0.323)#14,306 |
| 47. | Lake Lakengren | 0.77% | 0.19%(+0.576)#432 | 1.10%(-0.328)#14,307 |
| 48. | Beachwood | 0.76% | 0.19%(+0.564)#433 | 1.10%(-0.340)#14,308 |
| 49. | Munroe Falls | 0.74% | 0.19%(+0.540)#434 | 1.10%(-0.363)#14,309 |
| 50. | Bexley | 0.72% | 0.19%(+0.529)#435 | 1.10%(-0.374)#14,310 |
| 51. | Devola | 0.71% | 0.19%(+0.517)#436 | 1.10%(-0.386)#14,311 |
| 52. | Sherwood | 0.70% | 0.19%(+0.510)#437 | 1.10%(-0.394)#14,312 |
| 53. | Solon | 0.70% | 0.19%(+0.504)#438 | 1.10%(-0.400)#14,313 |
| 54. | Moreland Hills | 0.70% | 0.19%(+0.503)#439 | 1.10%(-0.401)#14,314 |
| 55. | Shaker Heights | 0.69% | 0.19%(+0.498)#440 | 1.10%(-0.405)#14,315 |
| 56. | Mayfield Heights | 0.68% | 0.19%(+0.486)#441 | 1.10%(-0.418)#14,316 |
| 57. | Canfield | 0.68% | 0.19%(+0.484)#442 | 1.10%(-0.420)#14,317 |
| 58. | Mingo Junction | 0.67% | 0.19%(+0.479)#443 | 1.10%(-0.425)#14,318 |
| 59. | Archbold | 0.65% | 0.19%(+0.459)#444 | 1.10%(-0.445)#14,319 |
| 60. | Wellston | 0.65% | 0.19%(+0.451)#445 | 1.10%(-0.453)#14,320 |
| 61. | Delphos | 0.64% | 0.19%(+0.449)#446 | 1.10%(-0.455)#14,321 |
| 62. | Covedale | 0.64% | 0.19%(+0.443)#447 | 1.10%(-0.460)#14,322 |
| 63. | Peninsula | 0.63% | 0.19%(+0.437)#448 | 1.10%(-0.466)#14,323 |
| 64. | Crystal Lakes | 0.62% | 0.19%(+0.428)#449 | 1.10%(-0.475)#14,324 |
| 65. | Rockford | 0.61% | 0.19%(+0.414)#450 | 1.10%(-0.490)#14,325 |
| 66. | Madeira | 0.59% | 0.19%(+0.400)#451 | 1.10%(-0.504)#14,326 |
| 67. | Kirtland Hills | 0.59% | 0.19%(+0.395)#452 | 1.10%(-0.508)#14,327 |
| 68. | Ottawa Hills | 0.56% | 0.19%(+0.370)#453 | 1.10%(-0.534)#14,328 |
| 69. | Middleburg Heights | 0.56% | 0.19%(+0.365)#454 | 1.10%(-0.539)#14,329 |
| 70. | Oakwood | 0.55% | 0.19%(+0.353)#455 | 1.10%(-0.551)#14,330 |
| 71. | Berlin Heights | 0.55% | 0.19%(+0.353)#456 | 1.10%(-0.551)#14,331 |
| 72. | Richfield | 0.54% | 0.19%(+0.343)#457 | 1.10%(-0.560)#14,332 |
| 73. | Moraine | 0.51% | 0.19%(+0.314)#458 | 1.10%(-0.589)#14,333 |
| 74. | Hunting Valley | 0.50% | 0.19%(+0.305)#459 | 1.10%(-0.598)#14,334 |
| 75. | Sharonville | 0.50% | 0.19%(+0.305)#460 | 1.10%(-0.599)#14,335 |
| 76. | Blue Ash | 0.50% | 0.19%(+0.301)#461 | 1.10%(-0.603)#14,336 |
| 77. | Maineville | 0.49% | 0.19%(+0.292)#462 | 1.10%(-0.612)#14,337 |
| 78. | Fairfield | 0.48% | 0.19%(+0.287)#463 | 1.10%(-0.616)#14,338 |
| 79. | Aurora | 0.48% | 0.19%(+0.287)#464 | 1.10%(-0.616)#14,339 |
| 80. | Montrose Ghent | 0.48% | 0.19%(+0.284)#465 | 1.10%(-0.620)#14,340 |
| 81. | Columbus | 0.47% | 0.19%(+0.271)#466 | 1.10%(-0.633)#14,341 |
| 82. | Dry Run | 0.46% | 0.19%(+0.264)#467 | 1.10%(-0.640)#14,342 |
| 83. | Mount Healthy | 0.45% | 0.19%(+0.252)#468 | 1.10%(-0.652)#14,343 |
| 84. | Westlake | 0.44% | 0.19%(+0.246)#469 | 1.10%(-0.657)#14,344 |
| 85. | Parma | 0.44% | 0.19%(+0.242)#470 | 1.10%(-0.661)#14,345 |
| 86. | Medina | 0.43% | 0.19%(+0.239)#471 | 1.10%(-0.665)#14,346 |
| 87. | Milford | 0.43% | 0.19%(+0.233)#472 | 1.10%(-0.671)#14,347 |
| 88. | Norwalk | 0.42% | 0.19%(+0.228)#473 | 1.10%(-0.676)#14,348 |
| 89. | Harrod | 0.41% | 0.19%(+0.219)#474 | 1.10%(-0.685)#14,349 |
| 90. | Grandview Heights | 0.41% | 0.19%(+0.217)#475 | 1.10%(-0.687)#14,350 |
| 91. | Edison | 0.40% | 0.19%(+0.208)#476 | 1.10%(-0.696)#14,351 |
| 92. | Delaware | 0.40% | 0.19%(+0.204)#477 | 1.10%(-0.700)#14,352 |
| 93. | Northfield | 0.39% | 0.19%(+0.200)#478 | 1.10%(-0.703)#14,353 |
| 94. | Ashtabula | 0.39% | 0.19%(+0.200)#479 | 1.10%(-0.704)#14,354 |
| 95. | Lyndhurst | 0.39% | 0.19%(+0.192)#480 | 1.10%(-0.711)#14,355 |
| 96. | Dublin | 0.38% | 0.19%(+0.188)#481 | 1.10%(-0.716)#14,356 |
| 97. | Mechanicsburg | 0.38% | 0.19%(+0.182)#482 | 1.10%(-0.722)#14,357 |
| 98. | Uniontown | 0.37% | 0.19%(+0.180)#483 | 1.10%(-0.724)#14,358 |
| 99. | New Albany | 0.37% | 0.19%(+0.176)#484 | 1.10%(-0.727)#14,359 |
| 100. | Strongsville | 0.36% | 0.19%(+0.169)#485 | 1.10%(-0.734)#14,360 |
Common Questions
What are the Top 10 Cities with the Highest Percentage of Immigrants from South America in Ohio?
Top 10 Cities with the Highest Percentage of Immigrants from South America in Ohio are:
#1
36.55%
#2
6.37%
#3
6.00%
#4
4.62%
#5
4.56%
#6
2.94%
#7
2.63%
#8
2.48%
#9
2.30%
#10
2.13%
What city has the Highest Percentage of Immigrants from South America in Ohio?
Mitiwanga has the Highest Percentage of Immigrants from South America in Ohio with 36.55%.
What is the Percentage of Immigrants from South America in the State of Ohio?
Percentage of Immigrants from South America in Ohio is 0.19%.
What is the Percentage of Immigrants from South America in the United States?
Percentage of Immigrants from South America in the United States is 1.10%.