Cities with the Highest Percentage of Immigrants from Belgium in Ohio
RELATED REPORTS & OPTIONS
Belgium
Ohio
Compare Cities
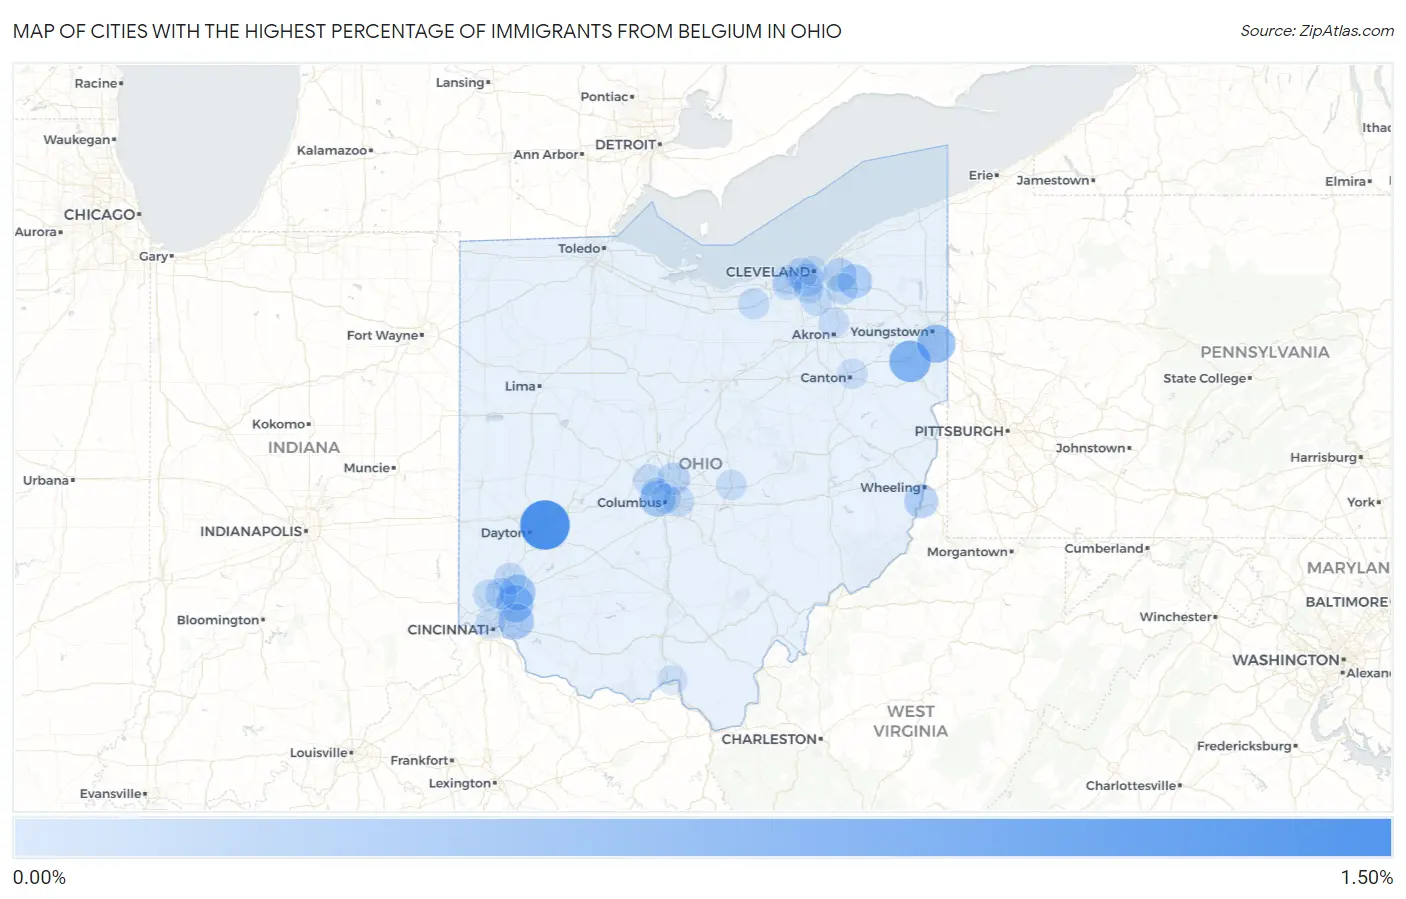
Map of Cities with the Highest Percentage of Immigrants from Belgium in Ohio
0.00%
1.50%
Cities with the Highest Percentage of Immigrants from Belgium in Ohio
| City | Belgium | vs State | vs National | |
| 1. | Wright Patterson Afb | 1.03% | 0.0059%(+1.02)#1 | 0.010%(+1.02)#41 |
| 2. | Salem | 0.58% | 0.0059%(+0.576)#2 | 0.010%(+0.571)#92 |
| 3. | Poland | 0.43% | 0.0059%(+0.422)#3 | 0.010%(+0.417)#118 |
| 4. | Sixteen Mile Stand | 0.35% | 0.0059%(+0.348)#4 | 0.010%(+0.343)#133 |
| 5. | Mason | 0.30% | 0.0059%(+0.296)#5 | 0.010%(+0.292)#152 |
| 6. | Marble Cliff | 0.30% | 0.0059%(+0.291)#6 | 0.010%(+0.287)#156 |
| 7. | Terrace Park | 0.28% | 0.0059%(+0.273)#7 | 0.010%(+0.269)#164 |
| 8. | South Russell | 0.20% | 0.0059%(+0.196)#8 | 0.010%(+0.191)#228 |
| 9. | Shadyside | 0.20% | 0.0059%(+0.193)#9 | 0.010%(+0.189)#231 |
| 10. | Pepper Pike | 0.18% | 0.0059%(+0.171)#10 | 0.010%(+0.167)#250 |
| 11. | Brooklyn | 0.15% | 0.0059%(+0.145)#11 | 0.010%(+0.141)#283 |
| 12. | Westerville | 0.12% | 0.0059%(+0.117)#12 | 0.010%(+0.113)#326 |
| 13. | Lakewood | 0.10% | 0.0059%(+0.095)#13 | 0.010%(+0.090)#358 |
| 14. | Monroe | 0.092% | 0.0059%(+0.086)#14 | 0.010%(+0.082)#379 |
| 15. | Beckett Ridge | 0.091% | 0.0059%(+0.085)#15 | 0.010%(+0.081)#381 |
| 16. | Solon | 0.075% | 0.0059%(+0.069)#16 | 0.010%(+0.064)#425 |
| 17. | Dublin | 0.070% | 0.0059%(+0.064)#17 | 0.010%(+0.059)#441 |
| 18. | Fairfield | 0.070% | 0.0059%(+0.064)#18 | 0.010%(+0.059)#442 |
| 19. | Oberlin | 0.061% | 0.0059%(+0.055)#19 | 0.010%(+0.051)#471 |
| 20. | Broadview Heights | 0.061% | 0.0059%(+0.055)#20 | 0.010%(+0.050)#475 |
| 21. | Whitehall | 0.050% | 0.0059%(+0.044)#21 | 0.010%(+0.039)#510 |
| 22. | Newark | 0.032% | 0.0059%(+0.026)#22 | 0.010%(+0.021)#609 |
| 23. | Cuyahoga Falls | 0.024% | 0.0059%(+0.018)#23 | 0.010%(+0.013)#667 |
| 24. | Canton | 0.020% | 0.0059%(+0.014)#24 | 0.010%(+0.009)#713 |
| 25. | Westlake | 0.018% | 0.0059%(+0.012)#25 | 0.010%(+0.007)#738 |
| 26. | North Olmsted | 0.016% | 0.0059%(+0.010)#26 | 0.010%(+0.005)#773 |
| 27. | Upper Arlington | 0.014% | 0.0059%(+0.008)#27 | 0.010%(+0.003)#794 |
| 28. | Parma | 0.011% | 0.0059%(+0.005)#28 | 0.010%(+0.001)#838 |
| 29. | Cincinnati | 0.0091% | 0.0059%(+0.003)#29 | 0.010%(-0.001)#869 |
| 30. | Portsmouth | 0.0055% | 0.0059%(-0.000)#30 | 0.010%(-0.005)#919 |
| 31. | Columbus | 0.0039% | 0.0059%(-0.002)#31 | 0.010%(-0.007)#944 |
| 32. | Cleveland | 0.0016% | 0.0059%(-0.004)#32 | 0.010%(-0.009)#967 |
Common Questions
What are the Top 10 Cities with the Highest Percentage of Immigrants from Belgium in Ohio?
Top 10 Cities with the Highest Percentage of Immigrants from Belgium in Ohio are:
#1
1.03%
#2
0.58%
#3
0.43%
#4
0.35%
#5
0.30%
#6
0.30%
#7
0.28%
#8
0.20%
#9
0.20%
#10
0.18%
What city has the Highest Percentage of Immigrants from Belgium in Ohio?
Wright Patterson AFB has the Highest Percentage of Immigrants from Belgium in Ohio with 1.03%.
What is the Percentage of Immigrants from Belgium in the State of Ohio?
Percentage of Immigrants from Belgium in Ohio is 0.0059%.
What is the Percentage of Immigrants from Belgium in the United States?
Percentage of Immigrants from Belgium in the United States is 0.010%.