San Juan Capistrano, CA Map & Demographics
San Juan Capistrano Map
San Juan Capistrano Overview
$55,855
PER CAPITA INCOME
$141,663
AVG FAMILY INCOME
$123,474
AVG HOUSEHOLD INCOME
24.0%
WAGE / INCOME GAP [ % ]
76.0¢/ $1
WAGE / INCOME GAP [ $ ]
$13,453
FAMILY INCOME DEFICIT
0.45
INEQUALITY / GINI INDEX
35,099
TOTAL POPULATION
16,914
MALE POPULATION
18,185
FEMALE POPULATION
93.01
MALES / 100 FEMALES
107.51
FEMALES / 100 MALES
42.4
MEDIAN AGE
3.5
AVG FAMILY SIZE
3.0
AVG HOUSEHOLD SIZE
17,983
LABOR FORCE [ PEOPLE ]
63.8%
PERCENT IN LABOR FORCE
4.1%
UNEMPLOYMENT RATE
San Juan Capistrano Zip Codes
Income in San Juan Capistrano
Income Overview in San Juan Capistrano
Per Capita Income in San Juan Capistrano is $55,855, while median incomes of families and households are $141,663 and $123,474 respectively.
| Characteristic | Number | Measure |
| Per Capita Income | 35,099 | $55,855 |
| Median Family Income | 8,675 | $141,663 |
| Mean Family Income | 8,675 | $184,038 |
| Median Household Income | 11,769 | $123,474 |
| Mean Household Income | 11,769 | $163,359 |
| Income Deficit | 8,675 | $13,453 |
| Wage / Income Gap (%) | 35,099 | 24.03% |
| Wage / Income Gap ($) | 35,099 | 75.97¢ per $1 |
| Gini / Inequality Index | 35,099 | 0.45 |
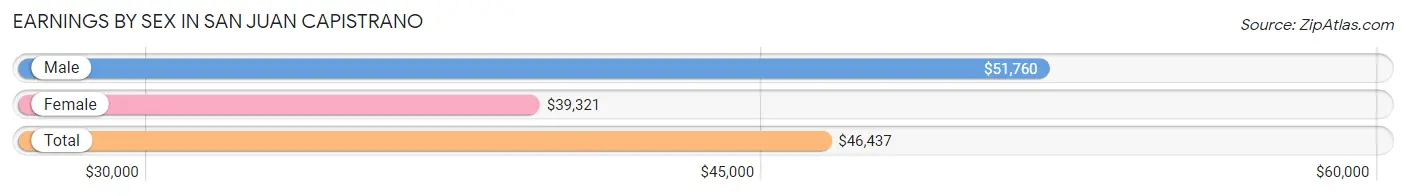
Earnings by Sex in San Juan Capistrano
Average Earnings in San Juan Capistrano are $46,437, $51,760 for men and $39,321 for women, a difference of 24.0%.
| Sex | Number | Average Earnings |
| Male | 10,651 (57.5%) | $51,760 |
| Female | 7,865 (42.5%) | $39,321 |
| Total | 18,516 (100.0%) | $46,437 |
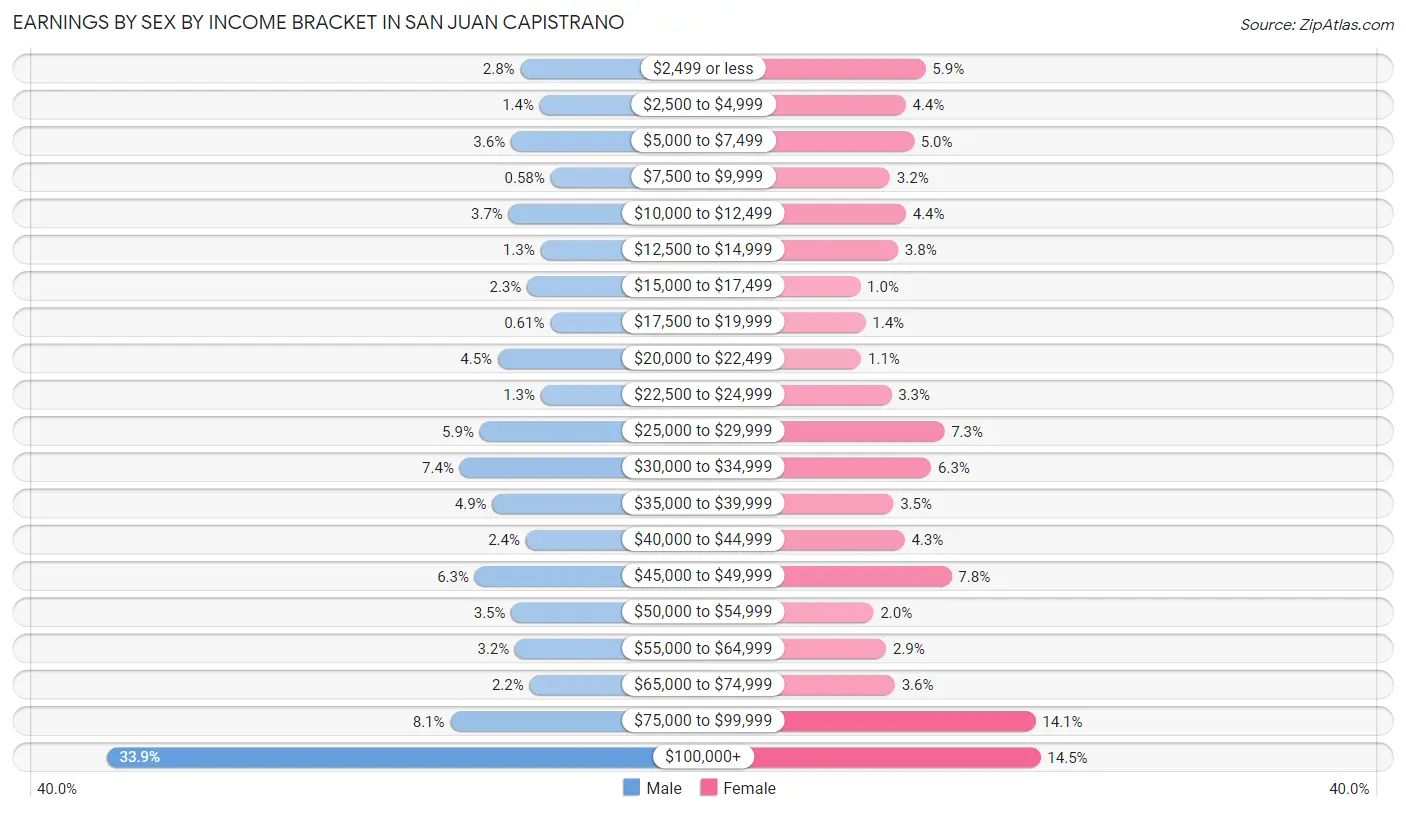
Earnings by Sex by Income Bracket in San Juan Capistrano
The most common earnings brackets in San Juan Capistrano are $100,000+ for men (3,605 | 33.9%) and $100,000+ for women (1,141 | 14.5%).
| Income | Male | Female |
| $2,499 or less | 303 (2.8%) | 463 (5.9%) |
| $2,500 to $4,999 | 148 (1.4%) | 346 (4.4%) |
| $5,000 to $7,499 | 378 (3.5%) | 395 (5.0%) |
| $7,500 to $9,999 | 62 (0.6%) | 254 (3.2%) |
| $10,000 to $12,499 | 396 (3.7%) | 348 (4.4%) |
| $12,500 to $14,999 | 143 (1.3%) | 301 (3.8%) |
| $15,000 to $17,499 | 249 (2.3%) | 79 (1.0%) |
| $17,500 to $19,999 | 65 (0.6%) | 109 (1.4%) |
| $20,000 to $22,499 | 483 (4.5%) | 84 (1.1%) |
| $22,500 to $24,999 | 140 (1.3%) | 262 (3.3%) |
| $25,000 to $29,999 | 627 (5.9%) | 574 (7.3%) |
| $30,000 to $34,999 | 787 (7.4%) | 497 (6.3%) |
| $35,000 to $39,999 | 526 (4.9%) | 274 (3.5%) |
| $40,000 to $44,999 | 260 (2.4%) | 340 (4.3%) |
| $45,000 to $49,999 | 667 (6.3%) | 617 (7.8%) |
| $50,000 to $54,999 | 375 (3.5%) | 157 (2.0%) |
| $55,000 to $64,999 | 345 (3.2%) | 231 (2.9%) |
| $65,000 to $74,999 | 230 (2.2%) | 282 (3.6%) |
| $75,000 to $99,999 | 862 (8.1%) | 1,111 (14.1%) |
| $100,000+ | 3,605 (33.9%) | 1,141 (14.5%) |
| Total | 10,651 (100.0%) | 7,865 (100.0%) |
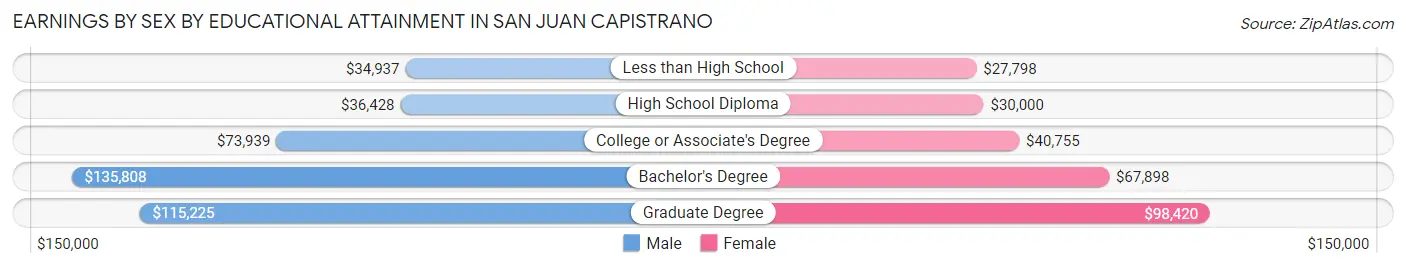
Earnings by Sex by Educational Attainment in San Juan Capistrano
Average earnings in San Juan Capistrano are $59,502 for men and $44,279 for women, a difference of 25.6%. Men with an educational attainment of bachelor's degree enjoy the highest average annual earnings of $135,808, while those with less than high school education earn the least with $34,937. Women with an educational attainment of graduate degree earn the most with the average annual earnings of $98,420, while those with less than high school education have the smallest earnings of $27,798.
| Educational Attainment | Male Income | Female Income |
| Less than High School | $34,937 | $27,798 |
| High School Diploma | $36,428 | $30,000 |
| College or Associate's Degree | $73,939 | $40,755 |
| Bachelor's Degree | $135,808 | $67,898 |
| Graduate Degree | $115,225 | $98,420 |
| Total | $59,502 | $44,279 |
Family Income in San Juan Capistrano
Family Income Brackets in San Juan Capistrano
According to the San Juan Capistrano family income data, there are 2,672 families falling into the $200,000+ income range, which is the most common income bracket and makes up 30.8% of all families. Conversely, the $10,000 to $14,999 income bracket is the least frequent group with only 121 families (1.4%) belonging to this category.
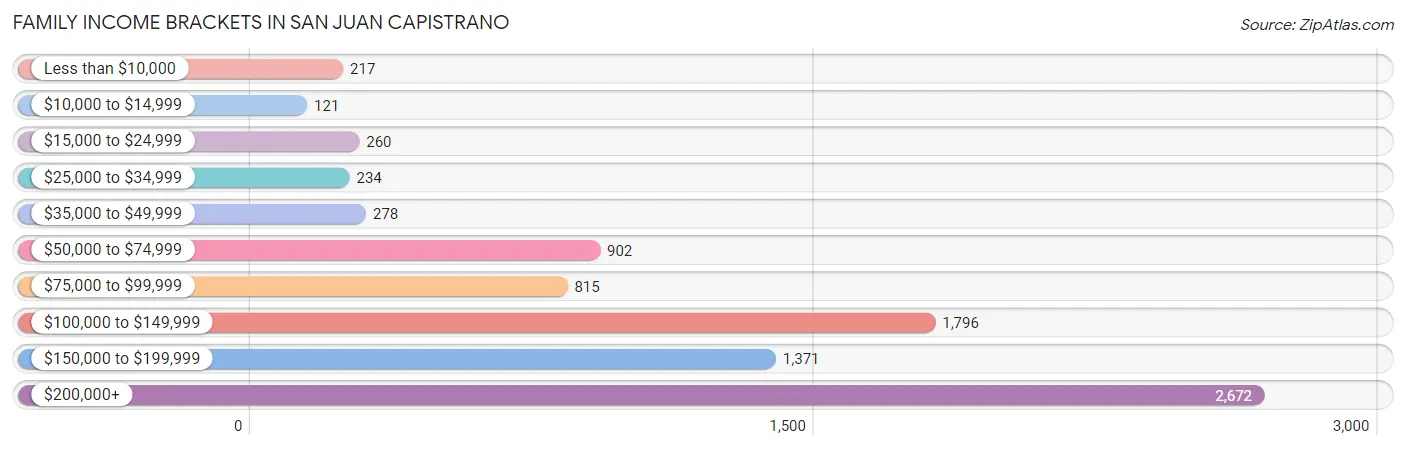
| Income Bracket | # Families | % Families |
| Less than $10,000 | 217 | 2.5% |
| $10,000 to $14,999 | 121 | 1.4% |
| $15,000 to $24,999 | 260 | 3.0% |
| $25,000 to $34,999 | 234 | 2.7% |
| $35,000 to $49,999 | 278 | 3.2% |
| $50,000 to $74,999 | 902 | 10.4% |
| $75,000 to $99,999 | 815 | 9.4% |
| $100,000 to $149,999 | 1,796 | 20.7% |
| $150,000 to $199,999 | 1,371 | 15.8% |
| $200,000+ | 2,672 | 30.8% |
Family Income by Famaliy Size in San Juan Capistrano
4-person families (1,981 | 22.8%) account for the highest median family income in San Juan Capistrano with $192,547 per family, while 2-person families (3,754 | 43.3%) have the highest median income of $64,966 per family member.
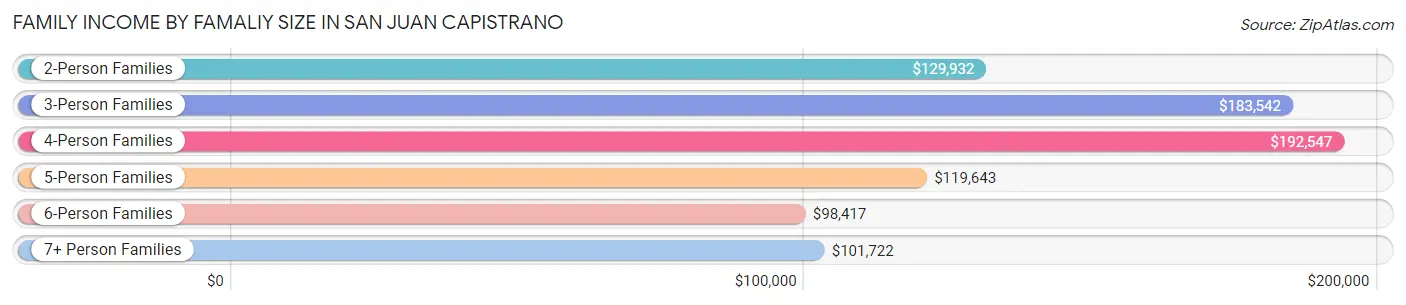
| Income Bracket | # Families | Median Income |
| 2-Person Families | 3,754 (43.3%) | $129,932 |
| 3-Person Families | 1,430 (16.5%) | $183,542 |
| 4-Person Families | 1,981 (22.8%) | $192,547 |
| 5-Person Families | 752 (8.7%) | $119,643 |
| 6-Person Families | 249 (2.9%) | $98,417 |
| 7+ Person Families | 509 (5.9%) | $101,722 |
| Total | 8,675 (100.0%) | $141,663 |
Family Income by Number of Earners in San Juan Capistrano
The median family income in San Juan Capistrano is $141,663, with families comprising 3+ earners (1,641) having the highest median family income of $160,149, while families with no earners (1,111) have the lowest median family income of $67,386, accounting for 18.9% and 12.8% of families, respectively.
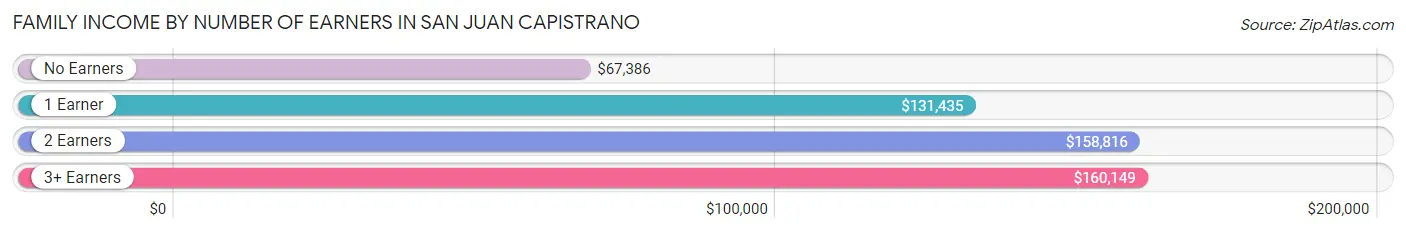
| Number of Earners | # Families | Median Income |
| No Earners | 1,111 (12.8%) | $67,386 |
| 1 Earner | 2,407 (27.8%) | $131,435 |
| 2 Earners | 3,516 (40.5%) | $158,816 |
| 3+ Earners | 1,641 (18.9%) | $160,149 |
| Total | 8,675 (100.0%) | $141,663 |
Household Income in San Juan Capistrano
Household Income Brackets in San Juan Capistrano
With 2,895 households falling in the category, the $200,000+ income range is the most frequent in San Juan Capistrano, accounting for 24.6% of all households. In contrast, only 165 households (1.4%) fall into the $10,000 to $14,999 income bracket, making it the least populous group.
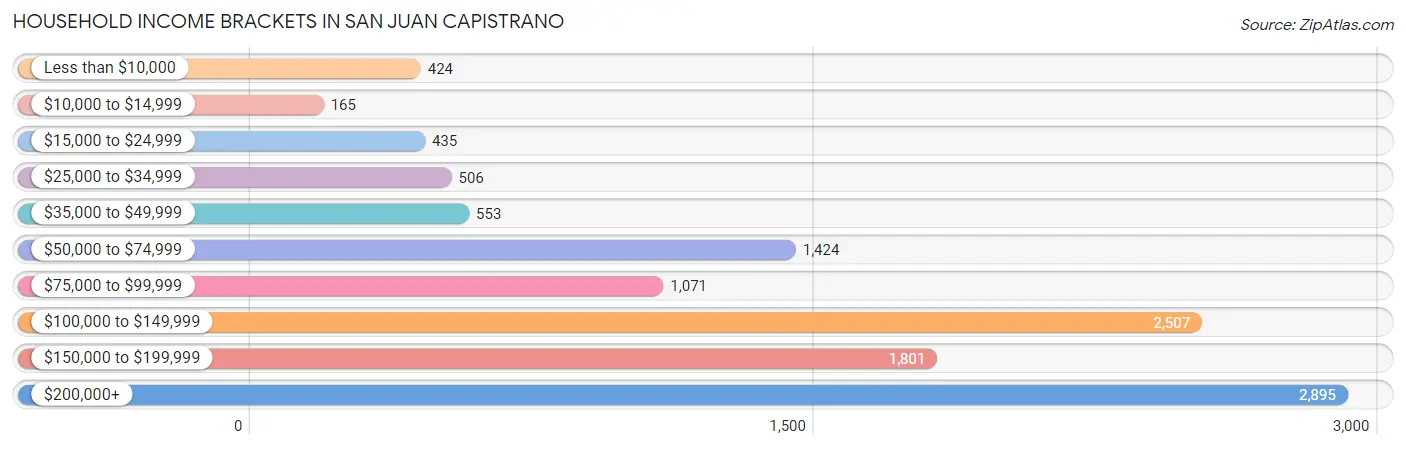
| Income Bracket | # Households | % Households |
| Less than $10,000 | 424 | 3.6% |
| $10,000 to $14,999 | 165 | 1.4% |
| $15,000 to $24,999 | 435 | 3.7% |
| $25,000 to $34,999 | 506 | 4.3% |
| $35,000 to $49,999 | 553 | 4.7% |
| $50,000 to $74,999 | 1,424 | 12.1% |
| $75,000 to $99,999 | 1,071 | 9.1% |
| $100,000 to $149,999 | 2,507 | 21.3% |
| $150,000 to $199,999 | 1,801 | 15.3% |
| $200,000+ | 2,895 | 24.6% |
Household Income by Householder Age in San Juan Capistrano
The median household income in San Juan Capistrano is $123,474, with the highest median household income of $145,423 found in the 45 to 64 years age bracket for the primary householder. A total of 5,550 households (47.2%) fall into this category. Meanwhile, the 65+ years age bracket for the primary householder has the lowest median household income of $87,433, with 3,881 households (33.0%) in this group.
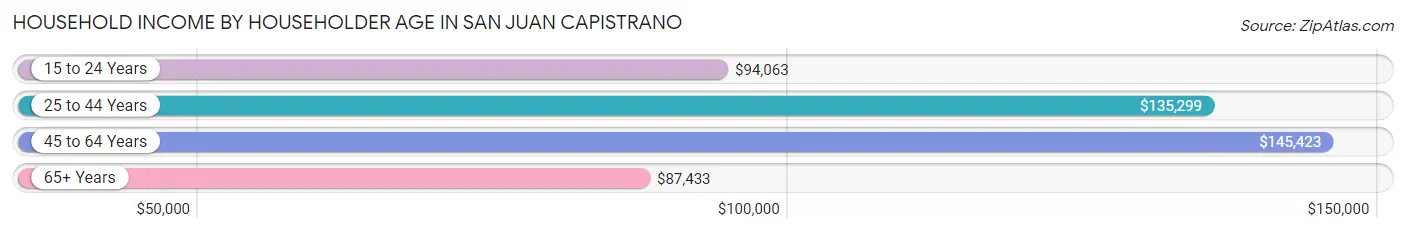
| Income Bracket | # Households | Median Income |
| 15 to 24 Years | 87 (0.7%) | $94,063 |
| 25 to 44 Years | 2,251 (19.1%) | $135,299 |
| 45 to 64 Years | 5,550 (47.2%) | $145,423 |
| 65+ Years | 3,881 (33.0%) | $87,433 |
| Total | 11,769 (100.0%) | $123,474 |
Poverty in San Juan Capistrano
Income Below Poverty by Sex and Age in San Juan Capistrano
With 6.9% poverty level for males and 11.1% for females among the residents of San Juan Capistrano, 12 to 14 year old males and 5 year old females are the most vulnerable to poverty, with 215 males (30.9%) and 108 females (37.1%) in their respective age groups living below the poverty level.
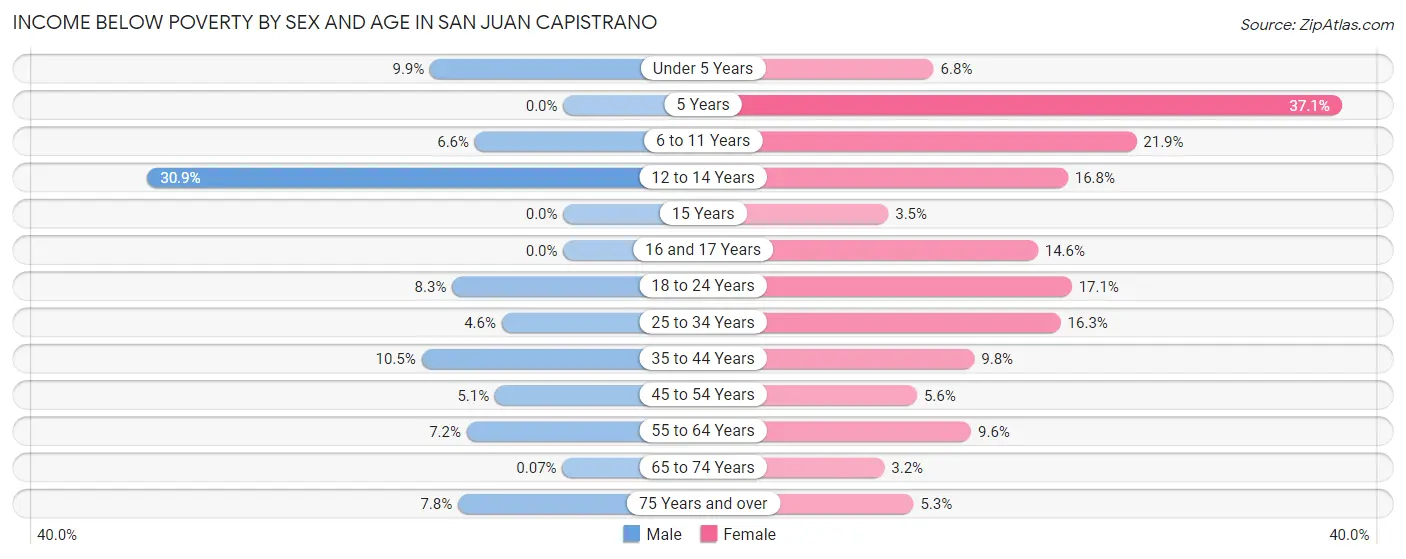
| Age Bracket | Male | Female |
| Under 5 Years | 78 (9.9%) | 58 (6.8%) |
| 5 Years | 0 (0.0%) | 108 (37.1%) |
| 6 to 11 Years | 84 (6.6%) | 375 (21.9%) |
| 12 to 14 Years | 215 (30.9%) | 73 (16.8%) |
| 15 Years | 0 (0.0%) | 12 (3.5%) |
| 16 and 17 Years | 0 (0.0%) | 94 (14.5%) |
| 18 to 24 Years | 88 (8.3%) | 269 (17.1%) |
| 25 to 34 Years | 103 (4.6%) | 279 (16.3%) |
| 35 to 44 Years | 181 (10.5%) | 197 (9.8%) |
| 45 to 54 Years | 150 (5.1%) | 122 (5.6%) |
| 55 to 64 Years | 165 (7.2%) | 262 (9.6%) |
| 65 to 74 Years | 1 (0.1%) | 50 (3.2%) |
| 75 Years and over | 105 (7.8%) | 106 (5.3%) |
| Total | 1,170 (6.9%) | 2,005 (11.1%) |
Income Above Poverty by Sex and Age in San Juan Capistrano
According to the poverty statistics in San Juan Capistrano, males aged 5 years and females aged 65 to 74 years are the age groups that are most secure financially, with 100.0% of males and 96.8% of females in these age groups living above the poverty line.
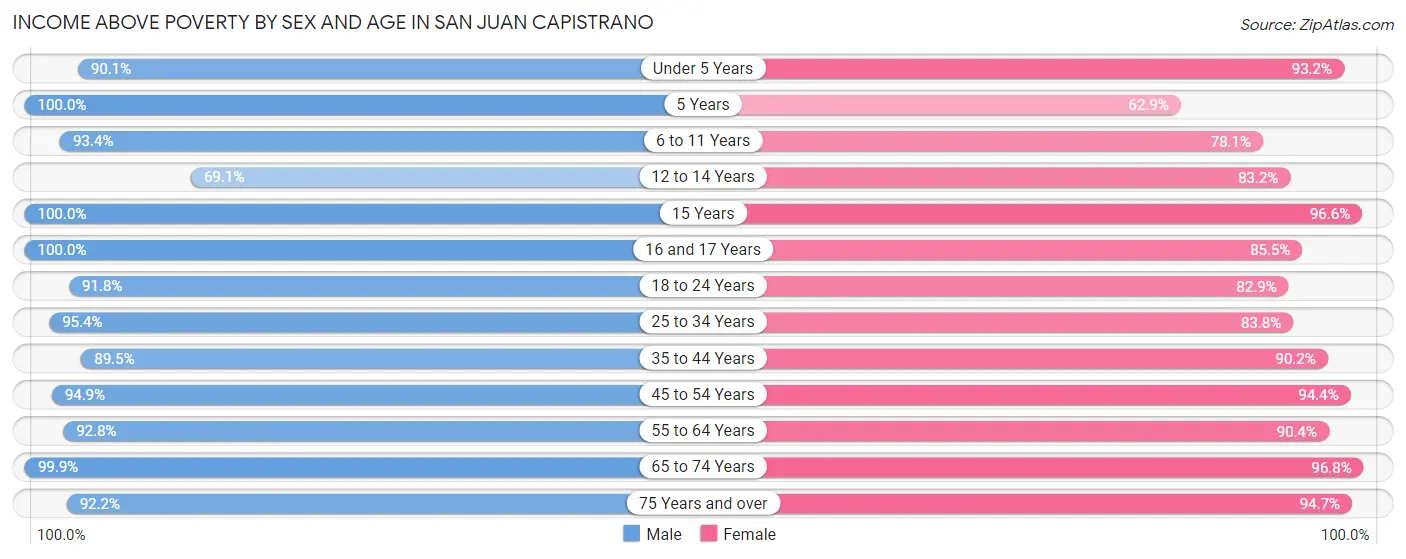
| Age Bracket | Male | Female |
| Under 5 Years | 711 (90.1%) | 792 (93.2%) |
| 5 Years | 97 (100.0%) | 183 (62.9%) |
| 6 to 11 Years | 1,194 (93.4%) | 1,340 (78.1%) |
| 12 to 14 Years | 481 (69.1%) | 362 (83.2%) |
| 15 Years | 319 (100.0%) | 336 (96.6%) |
| 16 and 17 Years | 554 (100.0%) | 552 (85.5%) |
| 18 to 24 Years | 979 (91.7%) | 1,307 (82.9%) |
| 25 to 34 Years | 2,153 (95.4%) | 1,438 (83.8%) |
| 35 to 44 Years | 1,538 (89.5%) | 1,806 (90.2%) |
| 45 to 54 Years | 2,810 (94.9%) | 2,064 (94.4%) |
| 55 to 64 Years | 2,137 (92.8%) | 2,467 (90.4%) |
| 65 to 74 Years | 1,466 (99.9%) | 1,532 (96.8%) |
| 75 Years and over | 1,238 (92.2%) | 1,888 (94.7%) |
| Total | 15,677 (93.1%) | 16,067 (88.9%) |
Income Below Poverty Among Married-Couple Families in San Juan Capistrano
The poverty statistics for married-couple families in San Juan Capistrano show that 6.0% or 435 of the total 7,223 families live below the poverty line. Families with 3 or 4 children have the highest poverty rate of 29.5%, comprising of 233 families. On the other hand, families with 5 or more children have the lowest poverty rate of 0.0%, which includes 0 families.

| Children | Above Poverty | Below Poverty |
| No Children | 3,644 (95.5%) | 172 (4.5%) |
| 1 or 2 Children | 2,526 (98.8%) | 30 (1.2%) |
| 3 or 4 Children | 557 (70.5%) | 233 (29.5%) |
| 5 or more Children | 61 (100.0%) | 0 (0.0%) |
| Total | 6,788 (94.0%) | 435 (6.0%) |
Income Below Poverty Among Single-Parent Households in San Juan Capistrano
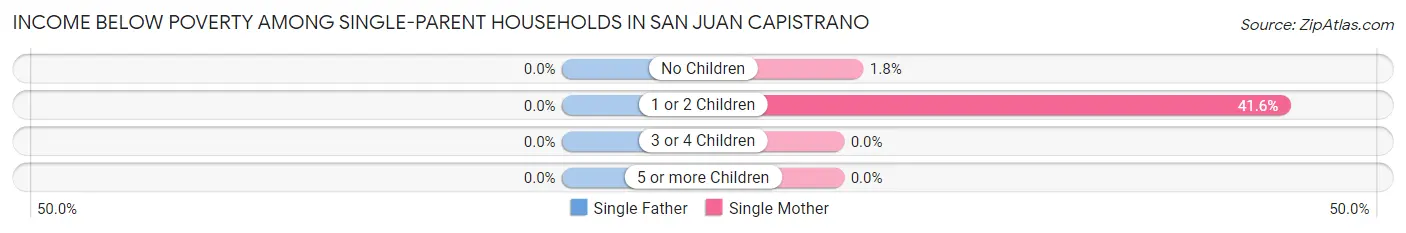
| Children | Single Father | Single Mother |
| No Children | 0 (0.0%) | 12 (1.8%) |
| 1 or 2 Children | 0 (0.0%) | 143 (41.6%) |
| 3 or 4 Children | 0 (0.0%) | 0 (0.0%) |
| 5 or more Children | 0 (0.0%) | 0 (0.0%) |
| Total | 0 (0.0%) | 155 (15.0%) |
Income Below Poverty Among Married-Couple vs Single-Parent Households in San Juan Capistrano
The poverty data for San Juan Capistrano shows that 435 of the married-couple family households (6.0%) and 155 of the single-parent households (10.7%) are living below the poverty level. Within the married-couple family households, those with 3 or 4 children have the highest poverty rate, with 233 households (29.5%) falling below the poverty line. Among the single-parent households, those with 1 or 2 children have the highest poverty rate, with 143 household (30.7%) living below poverty.
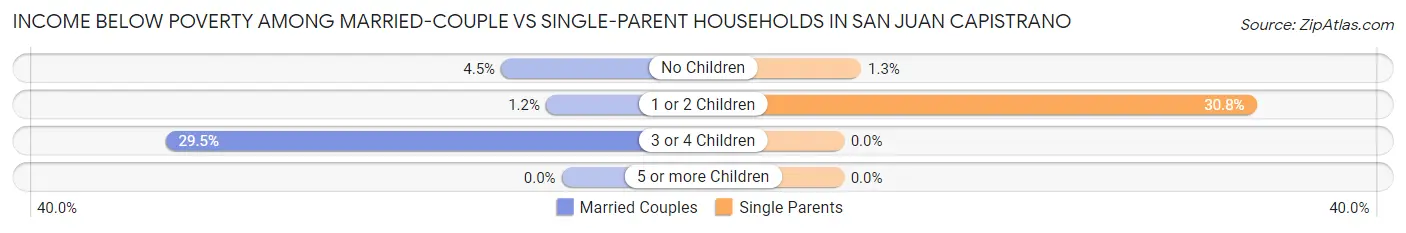
| Children | Married-Couple Families | Single-Parent Households |
| No Children | 172 (4.5%) | 12 (1.3%) |
| 1 or 2 Children | 30 (1.2%) | 143 (30.7%) |
| 3 or 4 Children | 233 (29.5%) | 0 (0.0%) |
| 5 or more Children | 0 (0.0%) | 0 (0.0%) |
| Total | 435 (6.0%) | 155 (10.7%) |
Race in San Juan Capistrano
The most populous races in San Juan Capistrano are White / Caucasian (22,764 | 64.9%), Hispanic or Latino (13,476 | 38.4%), and Two or more Races (5,698 | 16.2%).
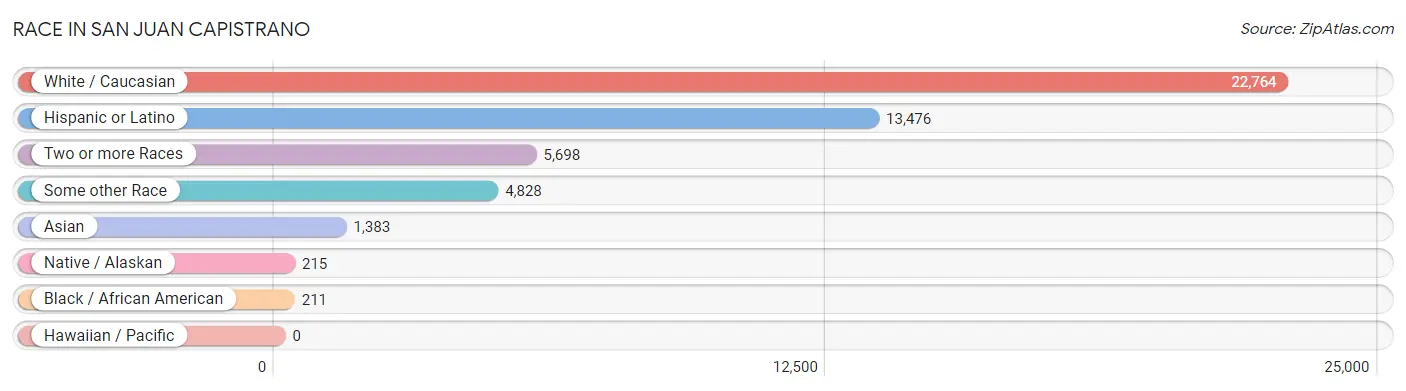
| Race | # Population | % Population |
| Asian | 1,383 | 3.9% |
| Black / African American | 211 | 0.6% |
| Hawaiian / Pacific | 0 | 0.0% |
| Hispanic or Latino | 13,476 | 38.4% |
| Native / Alaskan | 215 | 0.6% |
| White / Caucasian | 22,764 | 64.9% |
| Two or more Races | 5,698 | 16.2% |
| Some other Race | 4,828 | 13.8% |
| Total | 35,099 | 100.0% |
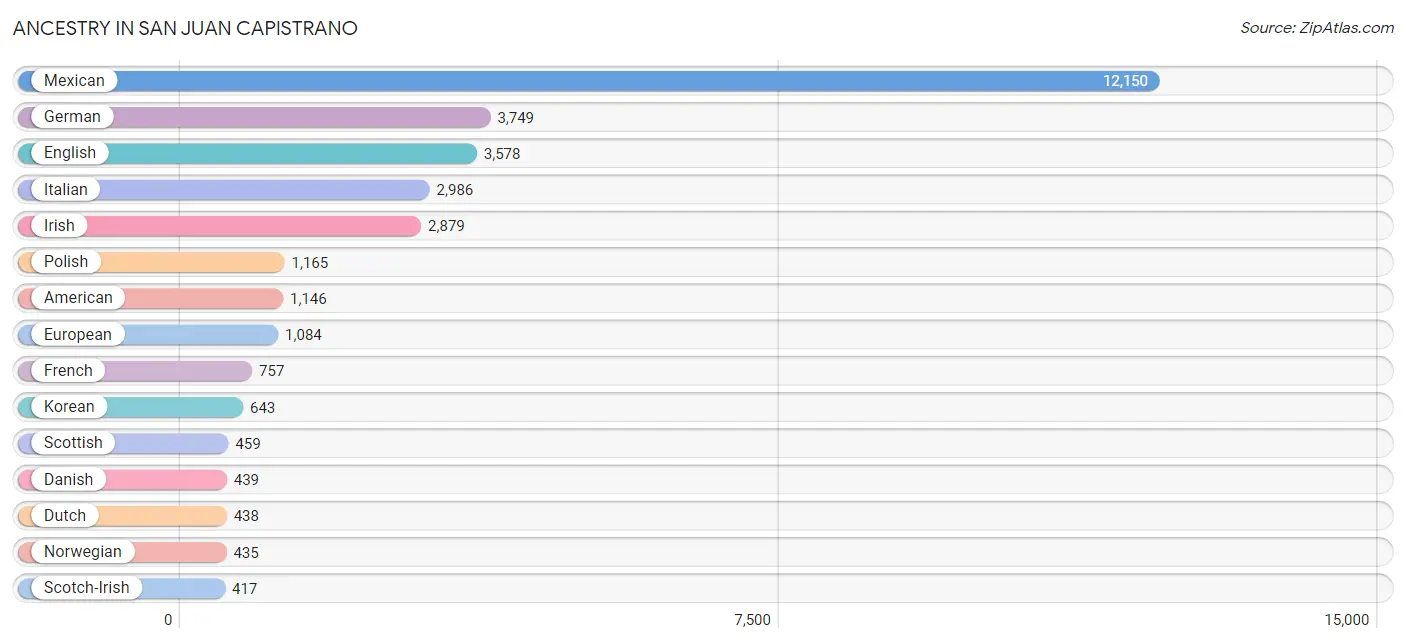
Ancestry in San Juan Capistrano
The most populous ancestries reported in San Juan Capistrano are Mexican (12,150 | 34.6%), German (3,749 | 10.7%), English (3,578 | 10.2%), Italian (2,986 | 8.5%), and Irish (2,879 | 8.2%), together accounting for 72.2% of all San Juan Capistrano residents.
| Ancestry | # Population | % Population |
| African | 35 | 0.1% |
| American | 1,146 | 3.3% |
| Apache | 24 | 0.1% |
| Arab | 227 | 0.6% |
| Argentinean | 65 | 0.2% |
| Armenian | 47 | 0.1% |
| Austrian | 41 | 0.1% |
| Basque | 68 | 0.2% |
| Belgian | 75 | 0.2% |
| Bhutanese | 328 | 0.9% |
| Blackfeet | 25 | 0.1% |
| Bolivian | 15 | 0.0% |
| Brazilian | 28 | 0.1% |
| British | 129 | 0.4% |
| Burmese | 232 | 0.7% |
| Canadian | 94 | 0.3% |
| Central American | 225 | 0.6% |
| Central American Indian | 6 | 0.0% |
| Cherokee | 10 | 0.0% |
| Colombian | 122 | 0.4% |
| Croatian | 62 | 0.2% |
| Cuban | 21 | 0.1% |
| Czech | 82 | 0.2% |
| Czechoslovakian | 122 | 0.4% |
| Danish | 439 | 1.3% |
| Dutch | 438 | 1.3% |
| Eastern European | 338 | 1.0% |
| Ecuadorian | 79 | 0.2% |
| Egyptian | 8 | 0.0% |
| English | 3,578 | 10.2% |
| European | 1,084 | 3.1% |
| Filipino | 34 | 0.1% |
| French | 757 | 2.2% |
| French Canadian | 76 | 0.2% |
| German | 3,749 | 10.7% |
| Ghanaian | 13 | 0.0% |
| Greek | 90 | 0.3% |
| Hungarian | 162 | 0.5% |
| Indian (Asian) | 367 | 1.1% |
| Iranian | 129 | 0.4% |
| Iraqi | 85 | 0.2% |
| Irish | 2,879 | 8.2% |
| Italian | 2,986 | 8.5% |
| Jamaican | 22 | 0.1% |
| Jordanian | 14 | 0.0% |
| Kenyan | 13 | 0.0% |
| Korean | 643 | 1.8% |
| Lebanese | 108 | 0.3% |
| Lithuanian | 39 | 0.1% |
| Luxembourger | 7 | 0.0% |
| Maltese | 13 | 0.0% |
| Mexican | 12,150 | 34.6% |
| Mexican American Indian | 98 | 0.3% |
| Native Hawaiian | 30 | 0.1% |
| Nicaraguan | 20 | 0.1% |
| Northern European | 11 | 0.0% |
| Norwegian | 435 | 1.2% |
| Pakistani | 94 | 0.3% |
| Peruvian | 47 | 0.1% |
| Polish | 1,165 | 3.3% |
| Portuguese | 31 | 0.1% |
| Pueblo | 29 | 0.1% |
| Puerto Rican | 135 | 0.4% |
| Romanian | 11 | 0.0% |
| Russian | 391 | 1.1% |
| Salvadoran | 205 | 0.6% |
| Samoan | 160 | 0.5% |
| Scandinavian | 187 | 0.5% |
| Scotch-Irish | 417 | 1.2% |
| Scottish | 459 | 1.3% |
| Serbian | 9 | 0.0% |
| Sioux | 32 | 0.1% |
| Slovak | 52 | 0.2% |
| South American | 328 | 0.9% |
| South American Indian | 47 | 0.1% |
| Spaniard | 214 | 0.6% |
| Spanish | 109 | 0.3% |
| Sri Lankan | 143 | 0.4% |
| Subsaharan African | 61 | 0.2% |
| Swedish | 359 | 1.0% |
| Swiss | 25 | 0.1% |
| Syrian | 12 | 0.0% |
| Thai | 182 | 0.5% |
| Ukrainian | 93 | 0.3% |
| Welsh | 205 | 0.6% |
| Yaqui | 16 | 0.1% |
| Yugoslavian | 60 | 0.2% | View All 87 Rows |
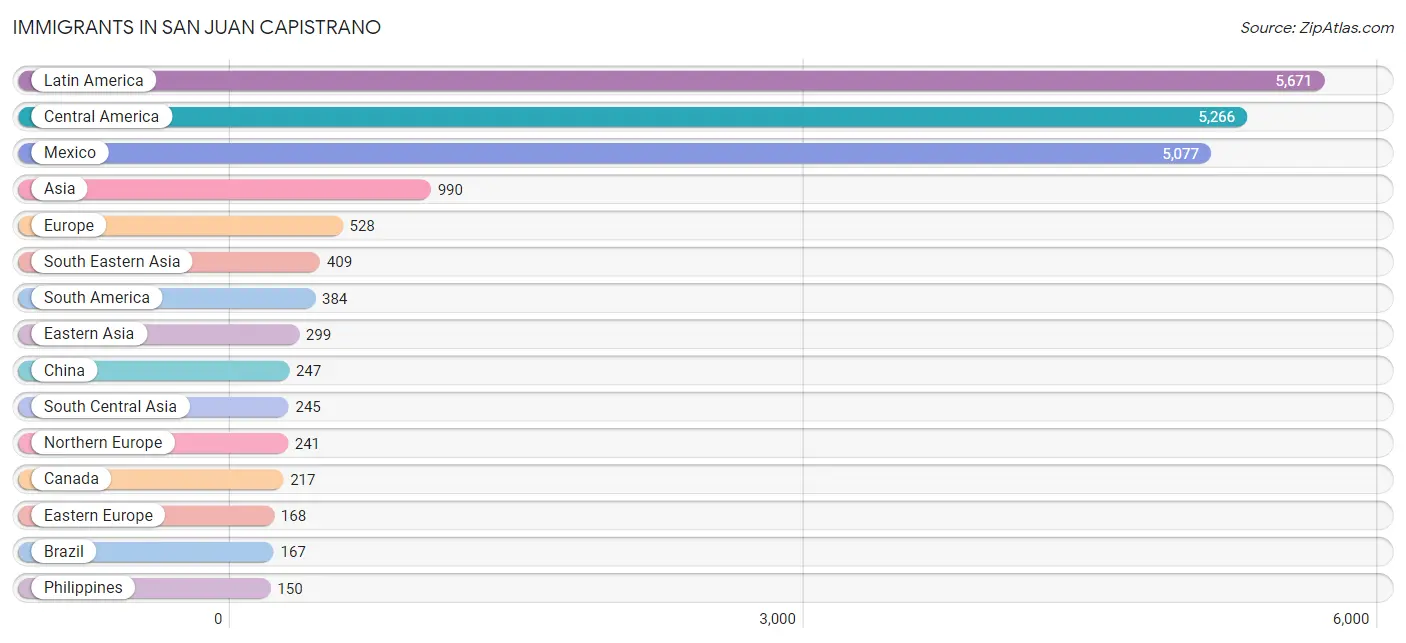
Immigrants in San Juan Capistrano
The most numerous immigrant groups reported in San Juan Capistrano came from Latin America (5,671 | 16.2%), Central America (5,266 | 15.0%), Mexico (5,077 | 14.5%), Asia (990 | 2.8%), and Europe (528 | 1.5%), together accounting for 49.9% of all San Juan Capistrano residents.
| Immigration Origin | # Population | % Population |
| Africa | 81 | 0.2% |
| Asia | 990 | 2.8% |
| Belgium | 56 | 0.2% |
| Brazil | 167 | 0.5% |
| Cambodia | 75 | 0.2% |
| Canada | 217 | 0.6% |
| Caribbean | 21 | 0.1% |
| Central America | 5,266 | 15.0% |
| China | 247 | 0.7% |
| Colombia | 107 | 0.3% |
| Congo | 17 | 0.1% |
| Croatia | 14 | 0.0% |
| Cuba | 21 | 0.1% |
| Denmark | 67 | 0.2% |
| Eastern Africa | 13 | 0.0% |
| Eastern Asia | 299 | 0.9% |
| Eastern Europe | 168 | 0.5% |
| Ecuador | 17 | 0.1% |
| El Salvador | 136 | 0.4% |
| England | 72 | 0.2% |
| Europe | 528 | 1.5% |
| Germany | 38 | 0.1% |
| Ghana | 13 | 0.0% |
| Hong Kong | 19 | 0.1% |
| Hungary | 13 | 0.0% |
| India | 93 | 0.3% |
| Iran | 57 | 0.2% |
| Ireland | 16 | 0.1% |
| Israel | 16 | 0.1% |
| Japan | 13 | 0.0% |
| Jordan | 14 | 0.0% |
| Kenya | 13 | 0.0% |
| Korea | 39 | 0.1% |
| Latin America | 5,671 | 16.2% |
| Lebanon | 7 | 0.0% |
| Malaysia | 21 | 0.1% |
| Mexico | 5,077 | 14.5% |
| Middle Africa | 17 | 0.1% |
| Netherlands | 15 | 0.0% |
| Nicaragua | 53 | 0.2% |
| Northern Europe | 241 | 0.7% |
| Oceania | 19 | 0.1% |
| Pakistan | 14 | 0.0% |
| Peru | 28 | 0.1% |
| Philippines | 150 | 0.4% |
| Poland | 66 | 0.2% |
| Romania | 75 | 0.2% |
| South Africa | 38 | 0.1% |
| South America | 384 | 1.1% |
| South Central Asia | 245 | 0.7% |
| South Eastern Asia | 409 | 1.2% |
| Southern Europe | 10 | 0.0% |
| Spain | 10 | 0.0% |
| Taiwan | 88 | 0.3% |
| Thailand | 94 | 0.3% |
| Vietnam | 69 | 0.2% |
| Western Africa | 13 | 0.0% |
| Western Asia | 37 | 0.1% |
| Western Europe | 109 | 0.3% | View All 59 Rows |
Sex and Age in San Juan Capistrano
Sex and Age in San Juan Capistrano
The most populous age groups in San Juan Capistrano are 50 to 54 Years (1,642 | 9.7%) for men and 55 to 59 Years (1,424 | 7.8%) for women.
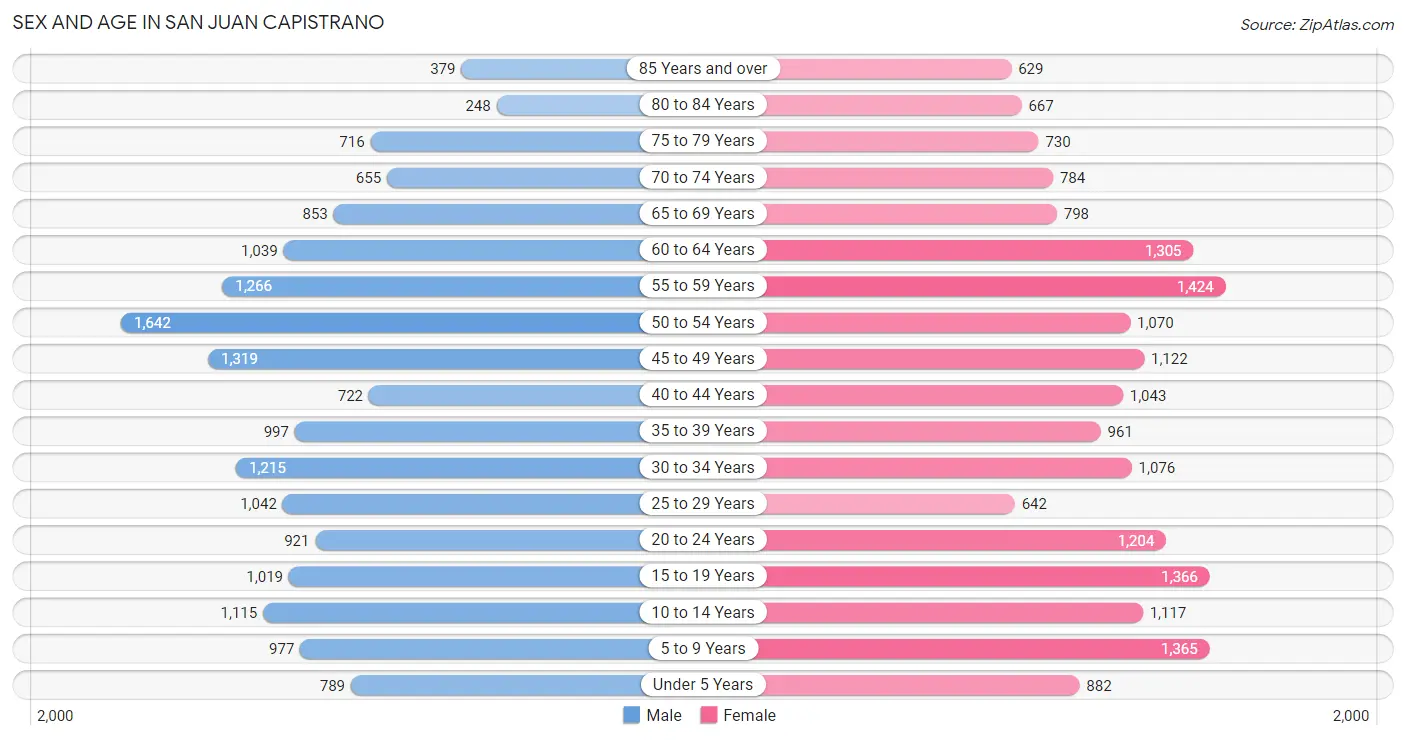
| Age Bracket | Male | Female |
| Under 5 Years | 789 (4.7%) | 882 (4.9%) |
| 5 to 9 Years | 977 (5.8%) | 1,365 (7.5%) |
| 10 to 14 Years | 1,115 (6.6%) | 1,117 (6.1%) |
| 15 to 19 Years | 1,019 (6.0%) | 1,366 (7.5%) |
| 20 to 24 Years | 921 (5.4%) | 1,204 (6.6%) |
| 25 to 29 Years | 1,042 (6.2%) | 642 (3.5%) |
| 30 to 34 Years | 1,215 (7.2%) | 1,076 (5.9%) |
| 35 to 39 Years | 997 (5.9%) | 961 (5.3%) |
| 40 to 44 Years | 722 (4.3%) | 1,043 (5.7%) |
| 45 to 49 Years | 1,319 (7.8%) | 1,122 (6.2%) |
| 50 to 54 Years | 1,642 (9.7%) | 1,070 (5.9%) |
| 55 to 59 Years | 1,266 (7.5%) | 1,424 (7.8%) |
| 60 to 64 Years | 1,039 (6.1%) | 1,305 (7.2%) |
| 65 to 69 Years | 853 (5.0%) | 798 (4.4%) |
| 70 to 74 Years | 655 (3.9%) | 784 (4.3%) |
| 75 to 79 Years | 716 (4.2%) | 730 (4.0%) |
| 80 to 84 Years | 248 (1.5%) | 667 (3.7%) |
| 85 Years and over | 379 (2.2%) | 629 (3.5%) |
| Total | 16,914 (100.0%) | 18,185 (100.0%) |
Families and Households in San Juan Capistrano
Median Family Size in San Juan Capistrano
The median family size in San Juan Capistrano is 3.46 persons per family, with married-couple families (7,223 | 83.3%) accounting for the largest median family size of 3.53 persons per family. On the other hand, single female/mother families (1,034 | 11.9%) represent the smallest median family size with 2.96 persons per family.
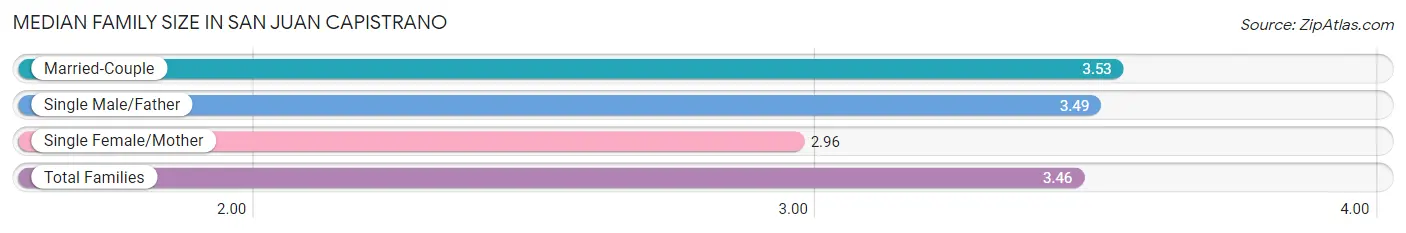
| Family Type | # Families | Family Size |
| Married-Couple | 7,223 (83.3%) | 3.53 |
| Single Male/Father | 418 (4.8%) | 3.49 |
| Single Female/Mother | 1,034 (11.9%) | 2.96 |
| Total Families | 8,675 (100.0%) | 3.46 |
Median Household Size in San Juan Capistrano
The median household size in San Juan Capistrano is 2.96 persons per household, with single male/father households (418 | 3.5%) accounting for the largest median household size of 3.74 persons per household. non-family households (3,094 | 26.3%) represent the smallest median household size with 1.24 persons per household.
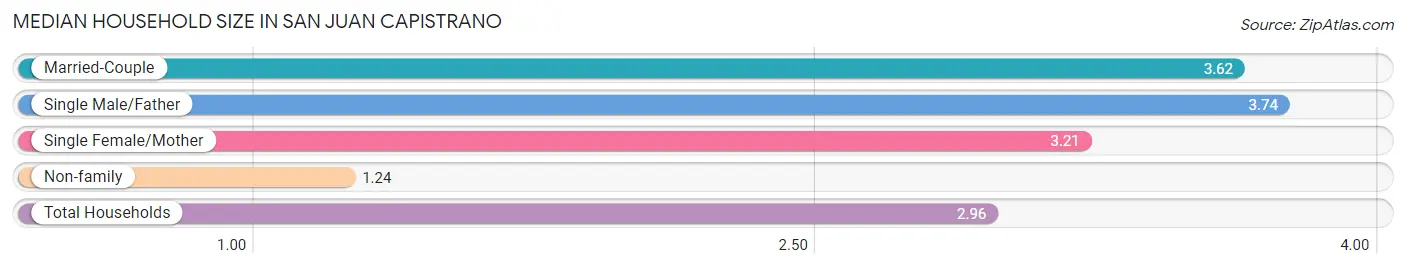
| Household Type | # Households | Household Size |
| Married-Couple | 7,223 (61.4%) | 3.62 |
| Single Male/Father | 418 (3.5%) | 3.74 |
| Single Female/Mother | 1,034 (8.8%) | 3.21 |
| Non-family | 3,094 (26.3%) | 1.24 |
| Total Households | 11,769 (100.0%) | 2.96 |
Household Size by Marriage Status in San Juan Capistrano
Out of a total of 11,769 households in San Juan Capistrano, 8,675 (73.7%) are family households, while 3,094 (26.3%) are nonfamily households. The most numerous type of family households are 2-person households, comprising 3,616, and the most common type of nonfamily households are 1-person households, comprising 2,557.
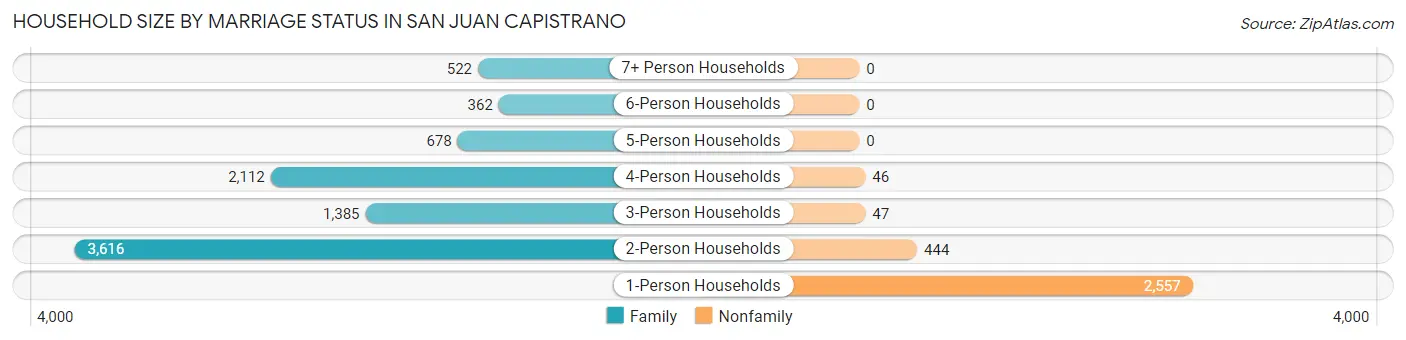
| Household Size | Family Households | Nonfamily Households |
| 1-Person Households | - | 2,557 (21.7%) |
| 2-Person Households | 3,616 (30.7%) | 444 (3.8%) |
| 3-Person Households | 1,385 (11.8%) | 47 (0.4%) |
| 4-Person Households | 2,112 (17.9%) | 46 (0.4%) |
| 5-Person Households | 678 (5.8%) | 0 (0.0%) |
| 6-Person Households | 362 (3.1%) | 0 (0.0%) |
| 7+ Person Households | 522 (4.4%) | 0 (0.0%) |
| Total | 8,675 (73.7%) | 3,094 (26.3%) |
Female Fertility in San Juan Capistrano
Fertility by Age in San Juan Capistrano
Average fertility rate in San Juan Capistrano is 62.0 births per 1,000 women. Women in the age bracket of 20 to 34 years have the highest fertility rate with 136.0 births per 1,000 women. Women in the age bracket of 20 to 34 years acount for 84.3% of all women with births.
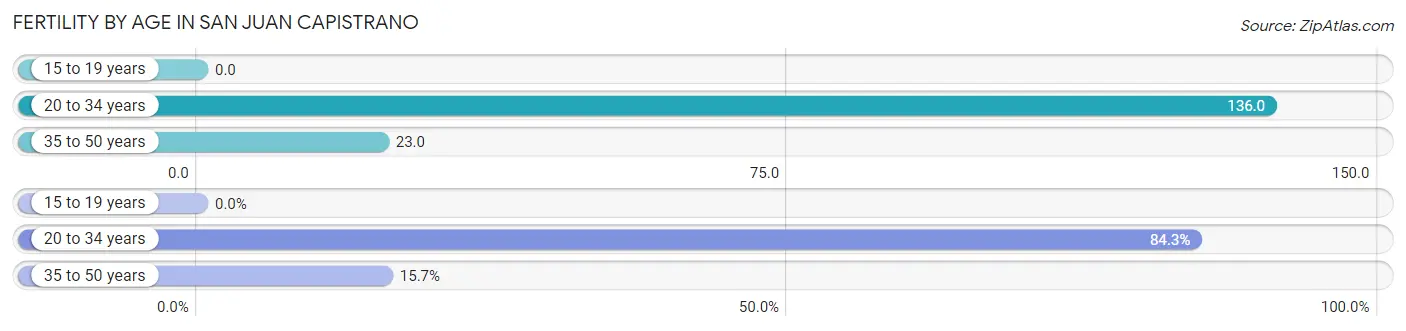
| Age Bracket | Women with Births | Births / 1,000 Women |
| 15 to 19 years | 0 (0.0%) | 0.0 |
| 20 to 34 years | 398 (84.3%) | 136.0 |
| 35 to 50 years | 74 (15.7%) | 23.0 |
| Total | 472 (100.0%) | 62.0 |
Fertility by Age by Marriage Status in San Juan Capistrano
75.0% of women with births (472) in San Juan Capistrano are married. The highest percentage of unmarried women with births falls into 35 to 50 years age bracket with 50.0% of them unmarried at the time of birth, while the lowest percentage of unmarried women with births belong to 20 to 34 years age bracket with 20.4% of them unmarried.
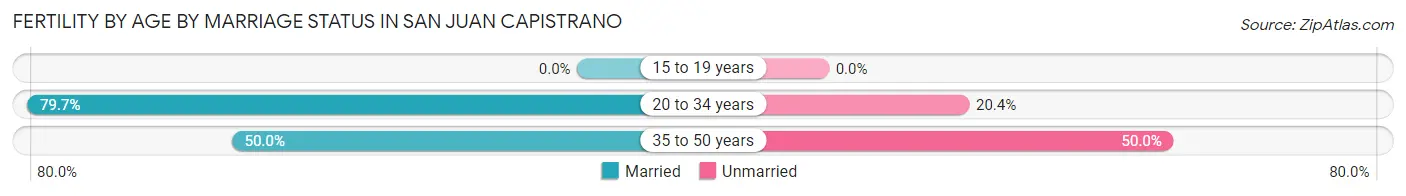
| Age Bracket | Married | Unmarried |
| 15 to 19 years | 0 (0.0%) | 0 (0.0%) |
| 20 to 34 years | 317 (79.6%) | 81 (20.3%) |
| 35 to 50 years | 37 (50.0%) | 37 (50.0%) |
| Total | 354 (75.0%) | 118 (25.0%) |
Fertility by Education in San Juan Capistrano
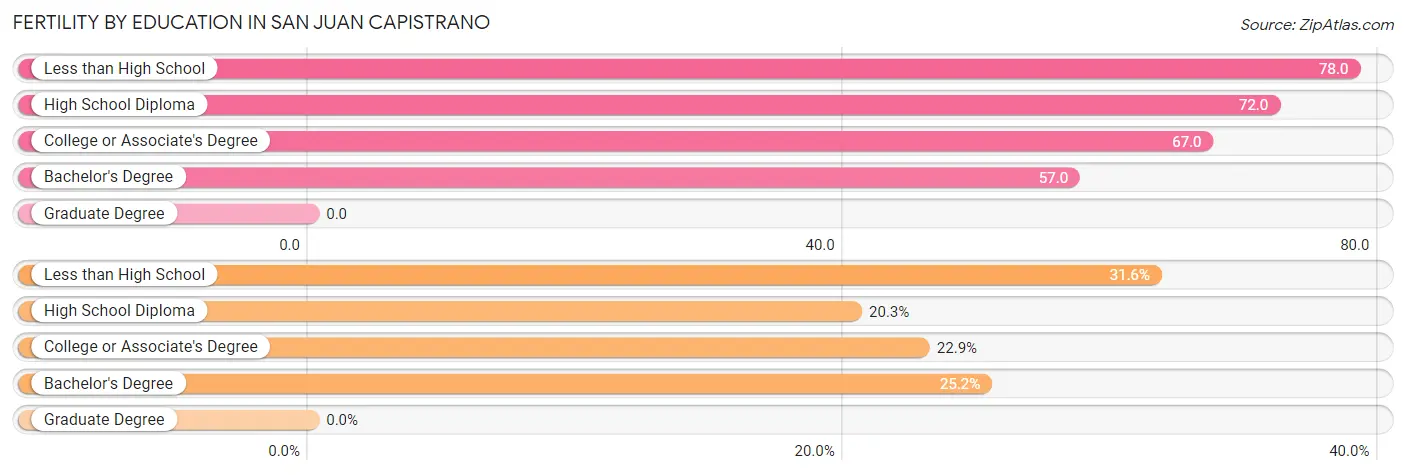
| Educational Attainment | Women with Births | Births / 1,000 Women |
| Less than High School | 149 (31.6%) | 78.0 |
| High School Diploma | 96 (20.3%) | 72.0 |
| College or Associate's Degree | 108 (22.9%) | 67.0 |
| Bachelor's Degree | 119 (25.2%) | 57.0 |
| Graduate Degree | 0 (0.0%) | 0.0 |
| Total | 472 (100.0%) | 62.0 |
Fertility by Education by Marriage Status in San Juan Capistrano
25.0% of women with births in San Juan Capistrano are unmarried. Women with the educational attainment of high school diploma are most likely to be married with 100.0% of them married at childbirth, while women with the educational attainment of college or associate's degree are least likely to be married with 57.4% of them unmarried at childbirth.
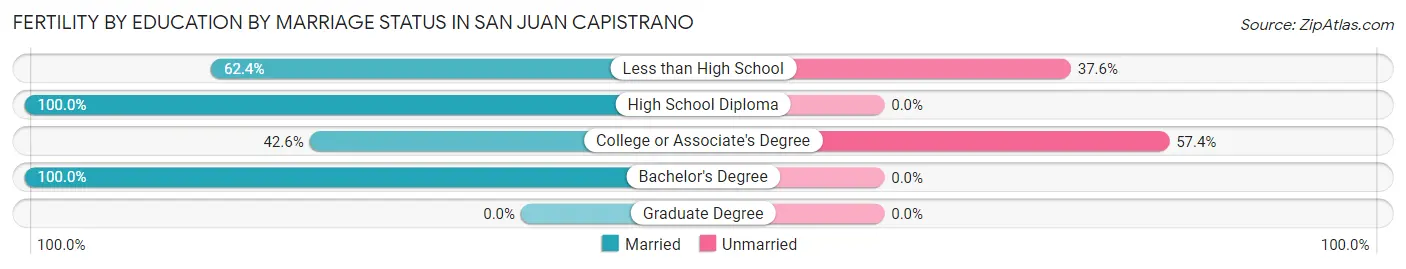
| Educational Attainment | Married | Unmarried |
| Less than High School | 93 (62.4%) | 56 (37.6%) |
| High School Diploma | 96 (100.0%) | 0 (0.0%) |
| College or Associate's Degree | 46 (42.6%) | 62 (57.4%) |
| Bachelor's Degree | 119 (100.0%) | 0 (0.0%) |
| Graduate Degree | 0 (0.0%) | 0 (0.0%) |
| Total | 354 (75.0%) | 118 (25.0%) |
Employment Characteristics in San Juan Capistrano
Employment by Class of Employer in San Juan Capistrano
Among the 17,012 employed individuals in San Juan Capistrano, private company employees (11,081 | 65.1%), self-employed (not incorporated) (1,973 | 11.6%), and self-employed (incorporated) (1,428 | 8.4%) make up the most common classes of employment.
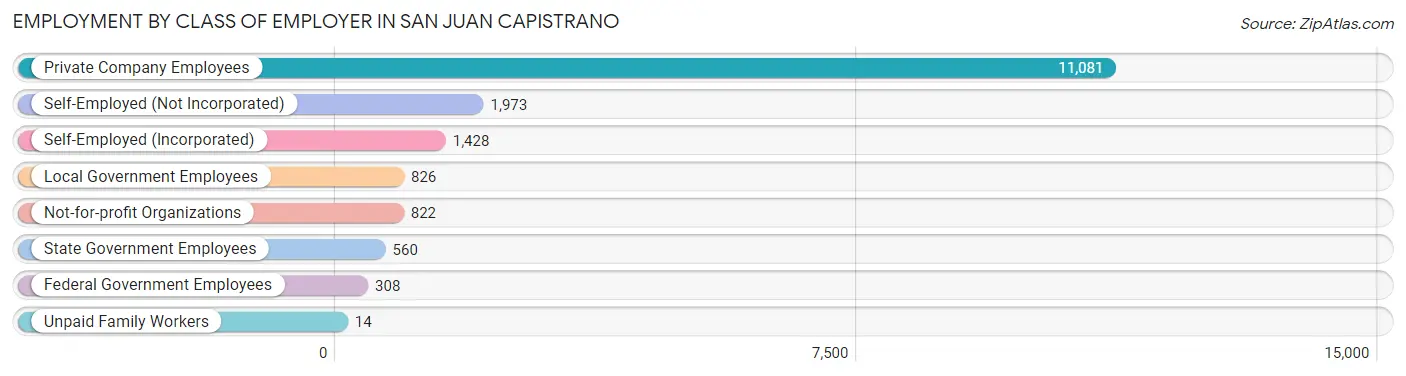
| Employer Class | # Employees | % Employees |
| Private Company Employees | 11,081 | 65.1% |
| Self-Employed (Incorporated) | 1,428 | 8.4% |
| Self-Employed (Not Incorporated) | 1,973 | 11.6% |
| Not-for-profit Organizations | 822 | 4.8% |
| Local Government Employees | 826 | 4.9% |
| State Government Employees | 560 | 3.3% |
| Federal Government Employees | 308 | 1.8% |
| Unpaid Family Workers | 14 | 0.1% |
| Total | 17,012 | 100.0% |
Employment Status by Age in San Juan Capistrano
According to the labor force statistics for San Juan Capistrano, out of the total population over 16 years of age (28,187), 63.8% or 17,983 individuals are in the labor force, with 4.1% or 737 of them unemployed. The age group with the highest labor force participation rate is 25 to 29 years, with 87.1% or 1,467 individuals in the labor force. Within the labor force, the 16 to 19 years age range has the highest percentage of unemployed individuals, with 8.5% or 58 of them being unemployed.
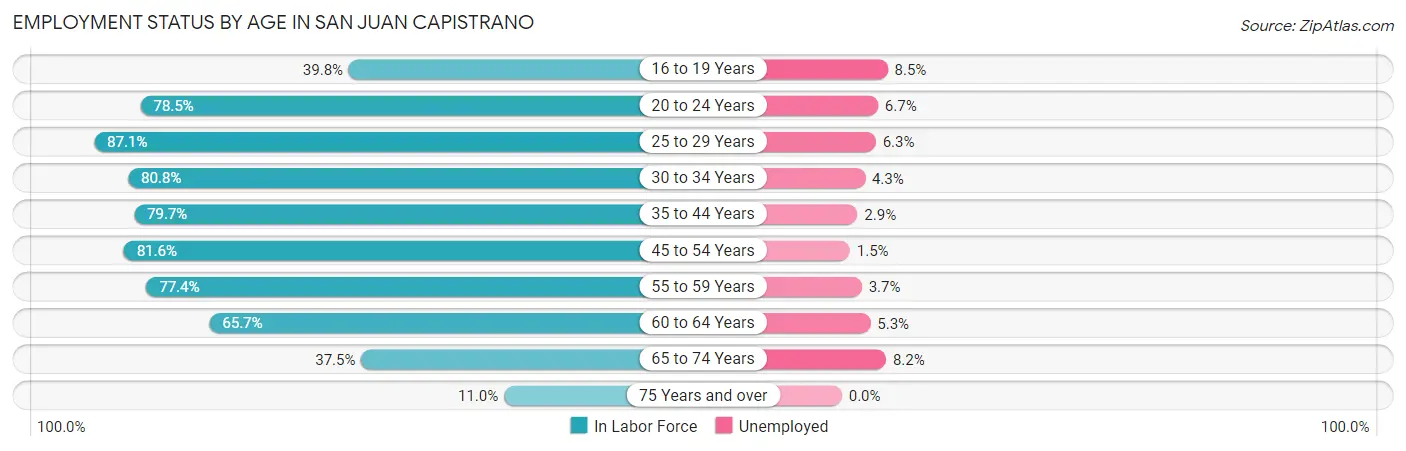
| Age Bracket | In Labor Force | Unemployed |
| 16 to 19 Years | 684 (39.8%) | 58 (8.5%) |
| 20 to 24 Years | 1,668 (78.5%) | 112 (6.7%) |
| 25 to 29 Years | 1,467 (87.1%) | 92 (6.3%) |
| 30 to 34 Years | 1,851 (80.8%) | 80 (4.3%) |
| 35 to 44 Years | 2,967 (79.7%) | 86 (2.9%) |
| 45 to 54 Years | 4,205 (81.6%) | 63 (1.5%) |
| 55 to 59 Years | 2,082 (77.4%) | 77 (3.7%) |
| 60 to 64 Years | 1,540 (65.7%) | 82 (5.3%) |
| 65 to 74 Years | 1,159 (37.5%) | 95 (8.2%) |
| 75 Years and over | 371 (11.0%) | 0 (0.0%) |
| Total | 17,983 (63.8%) | 737 (4.1%) |
Employment Status by Educational Attainment in San Juan Capistrano
According to labor force statistics for San Juan Capistrano, 78.9% of individuals (14,111) out of the total population between 25 and 64 years of age (17,885) are in the labor force, with 3.4% or 480 of them being unemployed. The group with the highest labor force participation rate are those with the educational attainment of bachelor's degree or higher, with 80.7% or 5,929 individuals in the labor force. Within the labor force, individuals with high school diploma education have the highest percentage of unemployment, with 6.6% or 167 of them being unemployed.
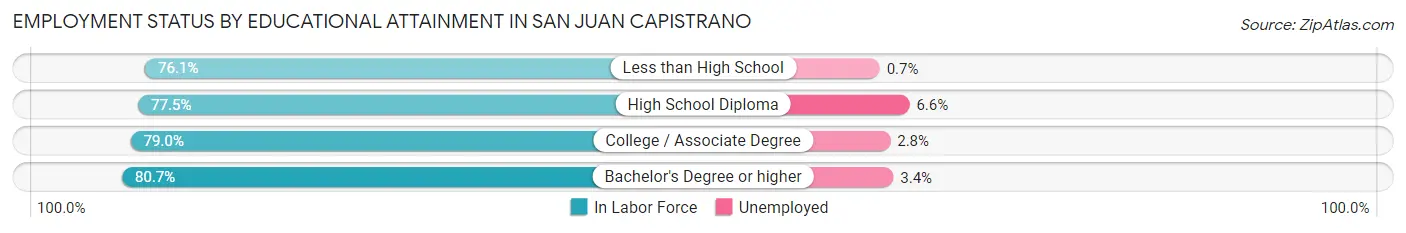
| Educational Attainment | In Labor Force | Unemployed |
| Less than High School | 2,289 (76.1%) | 21 (0.7%) |
| High School Diploma | 2,533 (77.5%) | 216 (6.6%) |
| College / Associate Degree | 3,366 (79.0%) | 119 (2.8%) |
| Bachelor's Degree or higher | 5,929 (80.7%) | 250 (3.4%) |
| Total | 14,111 (78.9%) | 608 (3.4%) |
Employment Occupations by Sex in San Juan Capistrano
Management, Business, Science and Arts Occupations
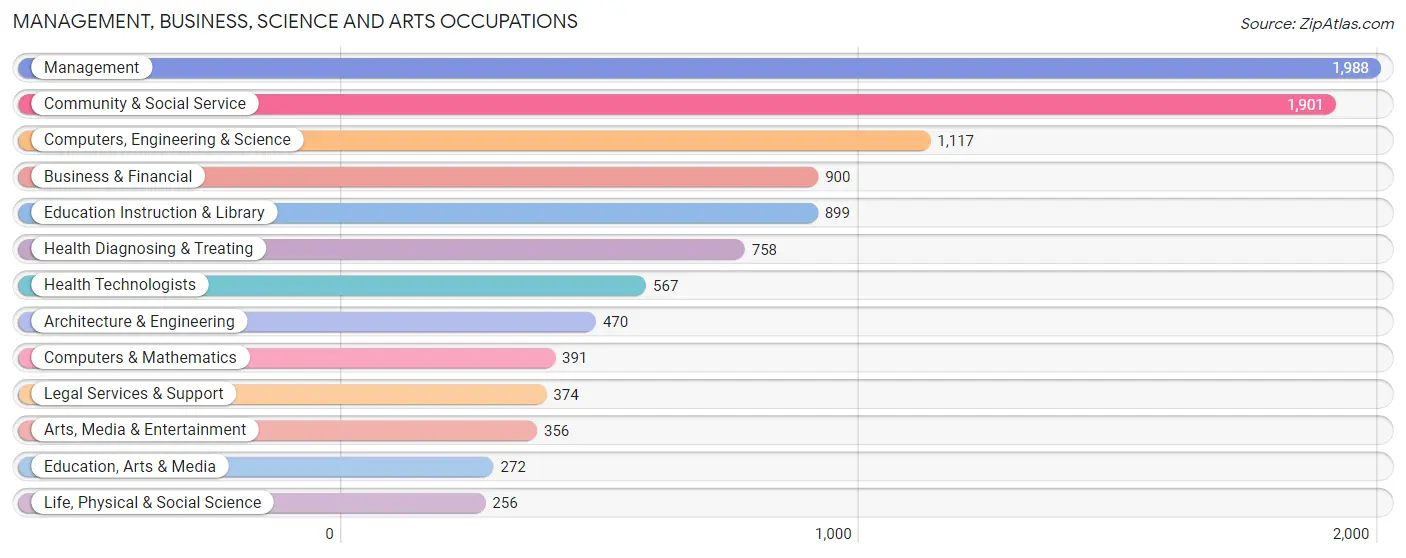
The most common Management, Business, Science and Arts occupations in San Juan Capistrano are Management (1,988 | 11.6%), Community & Social Service (1,901 | 11.1%), Computers, Engineering & Science (1,117 | 6.5%), Business & Financial (900 | 5.2%), and Education Instruction & Library (899 | 5.2%).
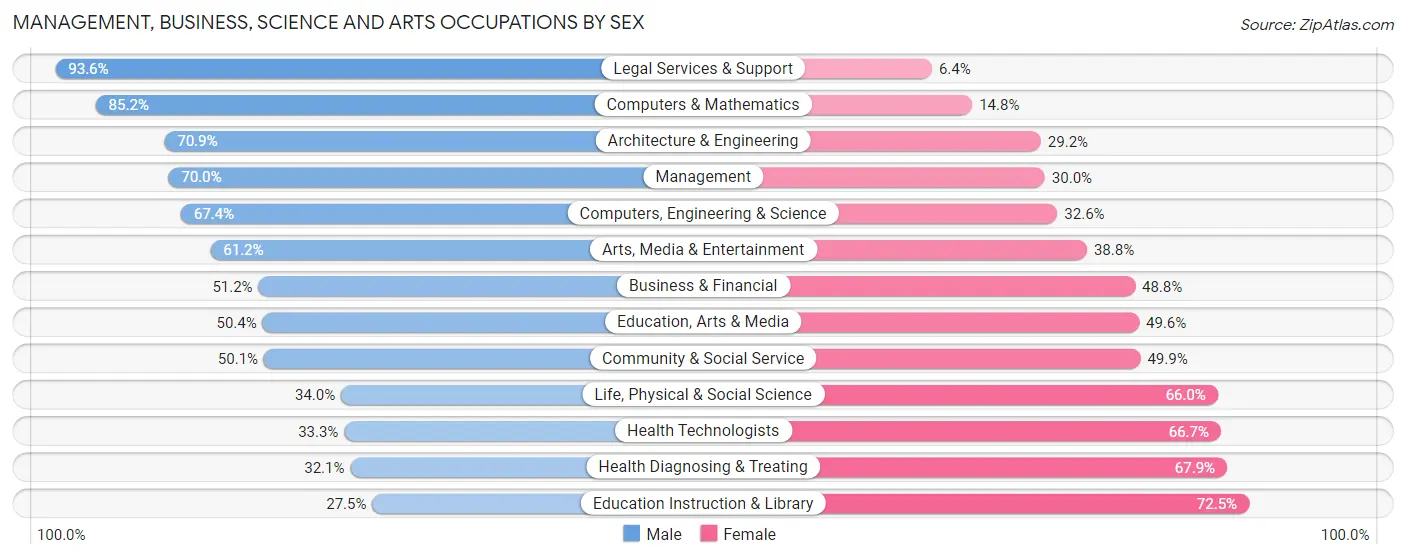
Management, Business, Science and Arts Occupations by Sex
Within the Management, Business, Science and Arts occupations in San Juan Capistrano, the most male-oriented occupations are Legal Services & Support (93.6%), Computers & Mathematics (85.2%), and Architecture & Engineering (70.9%), while the most female-oriented occupations are Education Instruction & Library (72.5%), Health Diagnosing & Treating (67.9%), and Health Technologists (66.7%).
| Occupation | Male | Female |
| Management | 1,392 (70.0%) | 596 (30.0%) |
| Business & Financial | 461 (51.2%) | 439 (48.8%) |
| Computers, Engineering & Science | 753 (67.4%) | 364 (32.6%) |
| Computers & Mathematics | 333 (85.2%) | 58 (14.8%) |
| Architecture & Engineering | 333 (70.9%) | 137 (29.1%) |
| Life, Physical & Social Science | 87 (34.0%) | 169 (66.0%) |
| Community & Social Service | 952 (50.1%) | 949 (49.9%) |
| Education, Arts & Media | 137 (50.4%) | 135 (49.6%) |
| Legal Services & Support | 350 (93.6%) | 24 (6.4%) |
| Education Instruction & Library | 247 (27.5%) | 652 (72.5%) |
| Arts, Media & Entertainment | 218 (61.2%) | 138 (38.8%) |
| Health Diagnosing & Treating | 243 (32.1%) | 515 (67.9%) |
| Health Technologists | 189 (33.3%) | 378 (66.7%) |
| Total (Category) | 3,801 (57.0%) | 2,863 (43.0%) |
| Total (Overall) | 9,932 (57.8%) | 7,243 (42.2%) |
Services Occupations
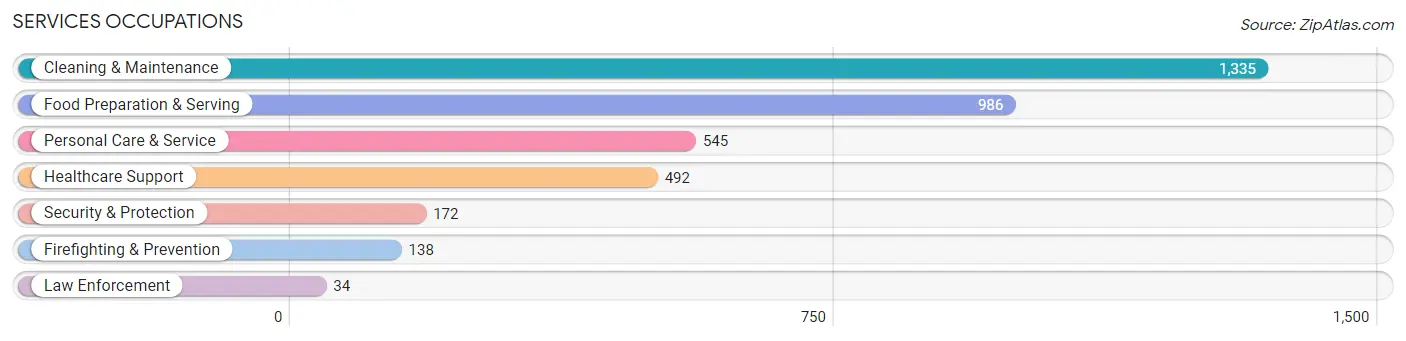
The most common Services occupations in San Juan Capistrano are Cleaning & Maintenance (1,335 | 7.8%), Food Preparation & Serving (986 | 5.7%), Personal Care & Service (545 | 3.2%), Healthcare Support (492 | 2.9%), and Security & Protection (172 | 1.0%).
Services Occupations by Sex
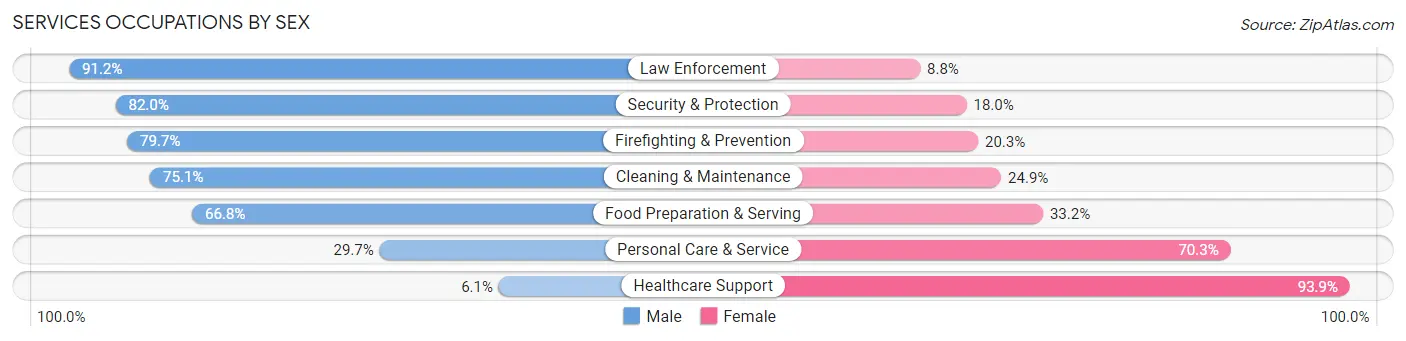
Within the Services occupations in San Juan Capistrano, the most male-oriented occupations are Law Enforcement (91.2%), Security & Protection (82.0%), and Firefighting & Prevention (79.7%), while the most female-oriented occupations are Healthcare Support (93.9%), Personal Care & Service (70.3%), and Food Preparation & Serving (33.2%).
| Occupation | Male | Female |
| Healthcare Support | 30 (6.1%) | 462 (93.9%) |
| Security & Protection | 141 (82.0%) | 31 (18.0%) |
| Firefighting & Prevention | 110 (79.7%) | 28 (20.3%) |
| Law Enforcement | 31 (91.2%) | 3 (8.8%) |
| Food Preparation & Serving | 659 (66.8%) | 327 (33.2%) |
| Cleaning & Maintenance | 1,003 (75.1%) | 332 (24.9%) |
| Personal Care & Service | 162 (29.7%) | 383 (70.3%) |
| Total (Category) | 1,995 (56.5%) | 1,535 (43.5%) |
| Total (Overall) | 9,932 (57.8%) | 7,243 (42.2%) |
Sales and Office Occupations
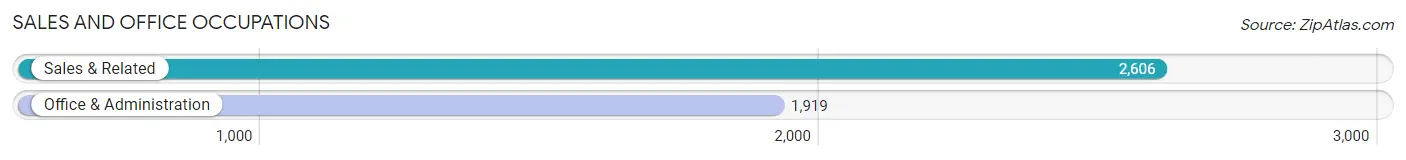
The most common Sales and Office occupations in San Juan Capistrano are Sales & Related (2,606 | 15.2%), and Office & Administration (1,919 | 11.2%).
Sales and Office Occupations by Sex
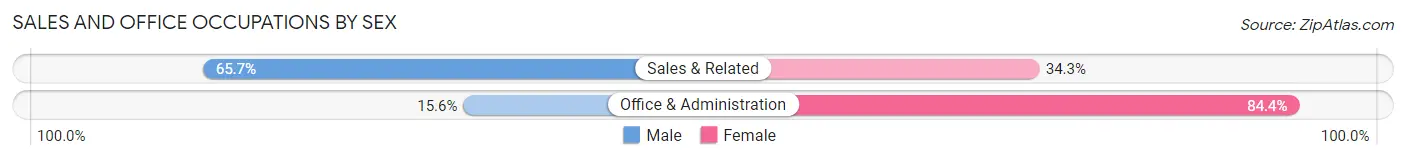
| Occupation | Male | Female |
| Sales & Related | 1,713 (65.7%) | 893 (34.3%) |
| Office & Administration | 300 (15.6%) | 1,619 (84.4%) |
| Total (Category) | 2,013 (44.5%) | 2,512 (55.5%) |
| Total (Overall) | 9,932 (57.8%) | 7,243 (42.2%) |
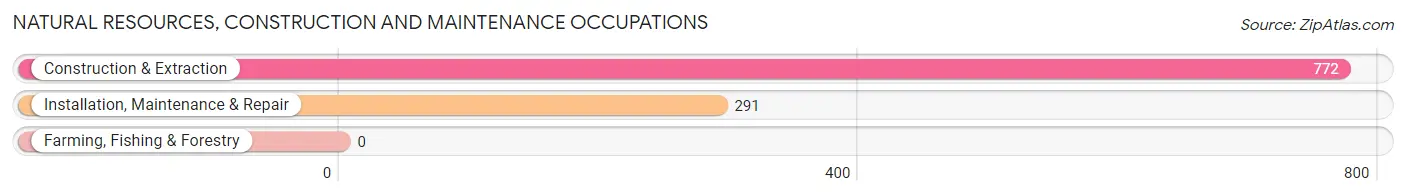
Natural Resources, Construction and Maintenance Occupations
The most common Natural Resources, Construction and Maintenance occupations in San Juan Capistrano are Construction & Extraction (772 | 4.5%), and Installation, Maintenance & Repair (291 | 1.7%).
Natural Resources, Construction and Maintenance Occupations by Sex
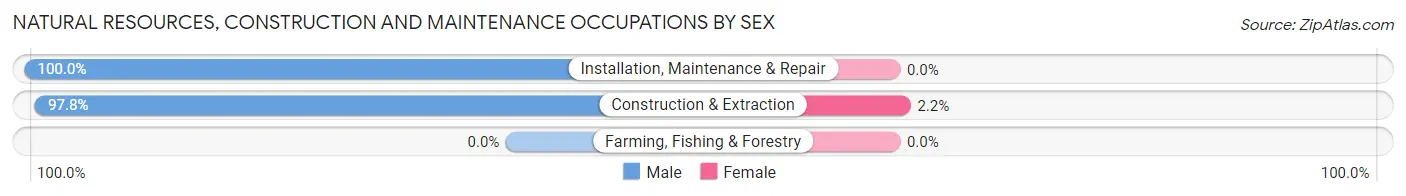
| Occupation | Male | Female |
| Farming, Fishing & Forestry | 0 (0.0%) | 0 (0.0%) |
| Construction & Extraction | 755 (97.8%) | 17 (2.2%) |
| Installation, Maintenance & Repair | 291 (100.0%) | 0 (0.0%) |
| Total (Category) | 1,046 (98.4%) | 17 (1.6%) |
| Total (Overall) | 9,932 (57.8%) | 7,243 (42.2%) |
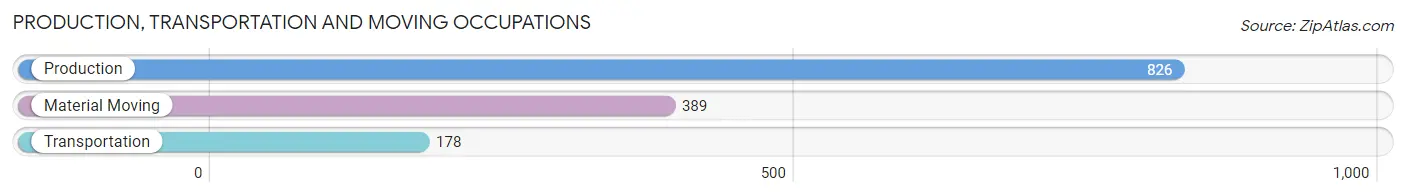
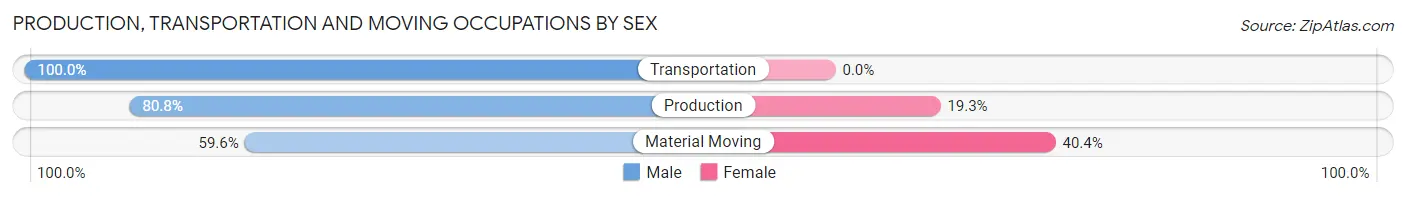
Production, Transportation and Moving Occupations
The most common Production, Transportation and Moving occupations in San Juan Capistrano are Production (826 | 4.8%), Material Moving (389 | 2.3%), and Transportation (178 | 1.0%).
Production, Transportation and Moving Occupations by Sex
| Occupation | Male | Female |
| Production | 667 (80.7%) | 159 (19.3%) |
| Transportation | 178 (100.0%) | 0 (0.0%) |
| Material Moving | 232 (59.6%) | 157 (40.4%) |
| Total (Category) | 1,077 (77.3%) | 316 (22.7%) |
| Total (Overall) | 9,932 (57.8%) | 7,243 (42.2%) |
Employment Industries by Sex in San Juan Capistrano
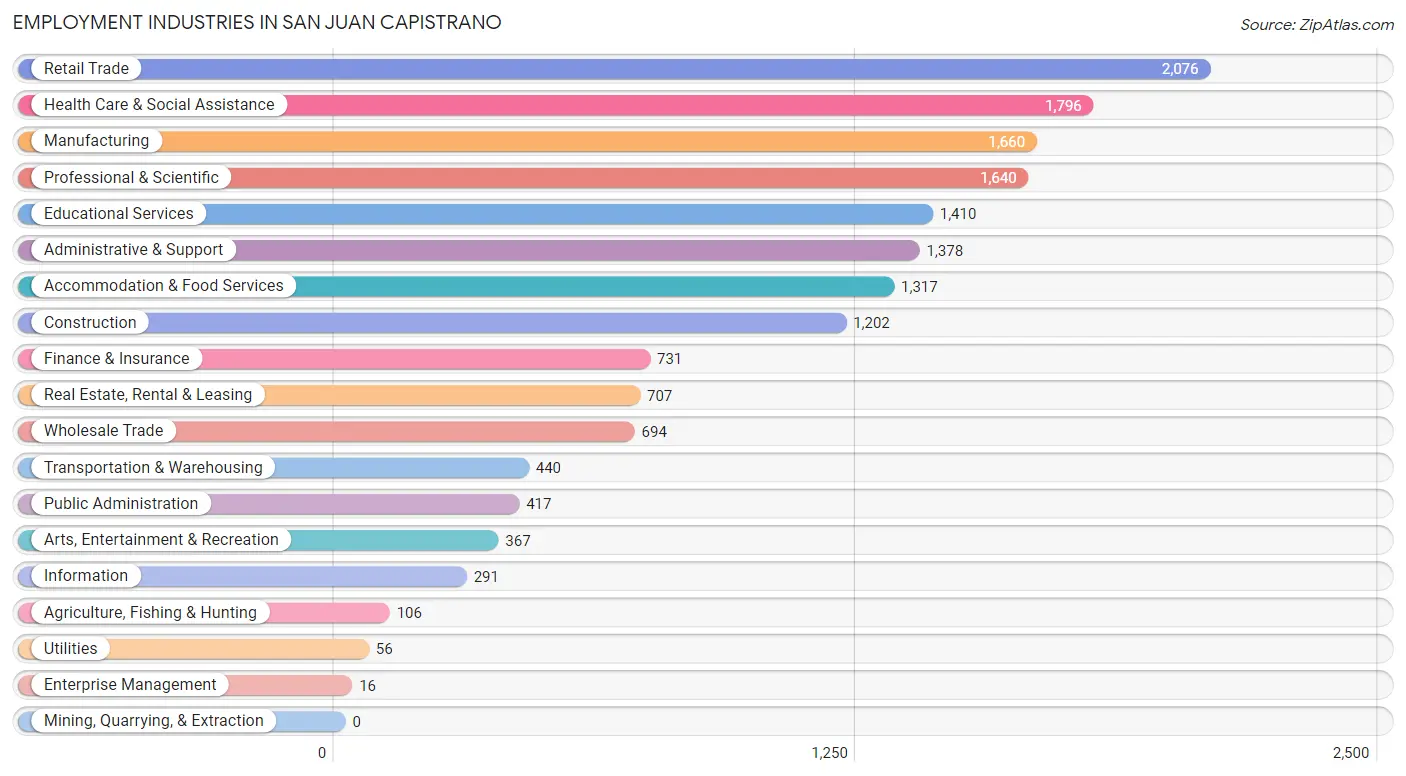
Employment Industries in San Juan Capistrano
The major employment industries in San Juan Capistrano include Retail Trade (2,076 | 12.1%), Health Care & Social Assistance (1,796 | 10.5%), Manufacturing (1,660 | 9.7%), Professional & Scientific (1,640 | 9.6%), and Educational Services (1,410 | 8.2%).
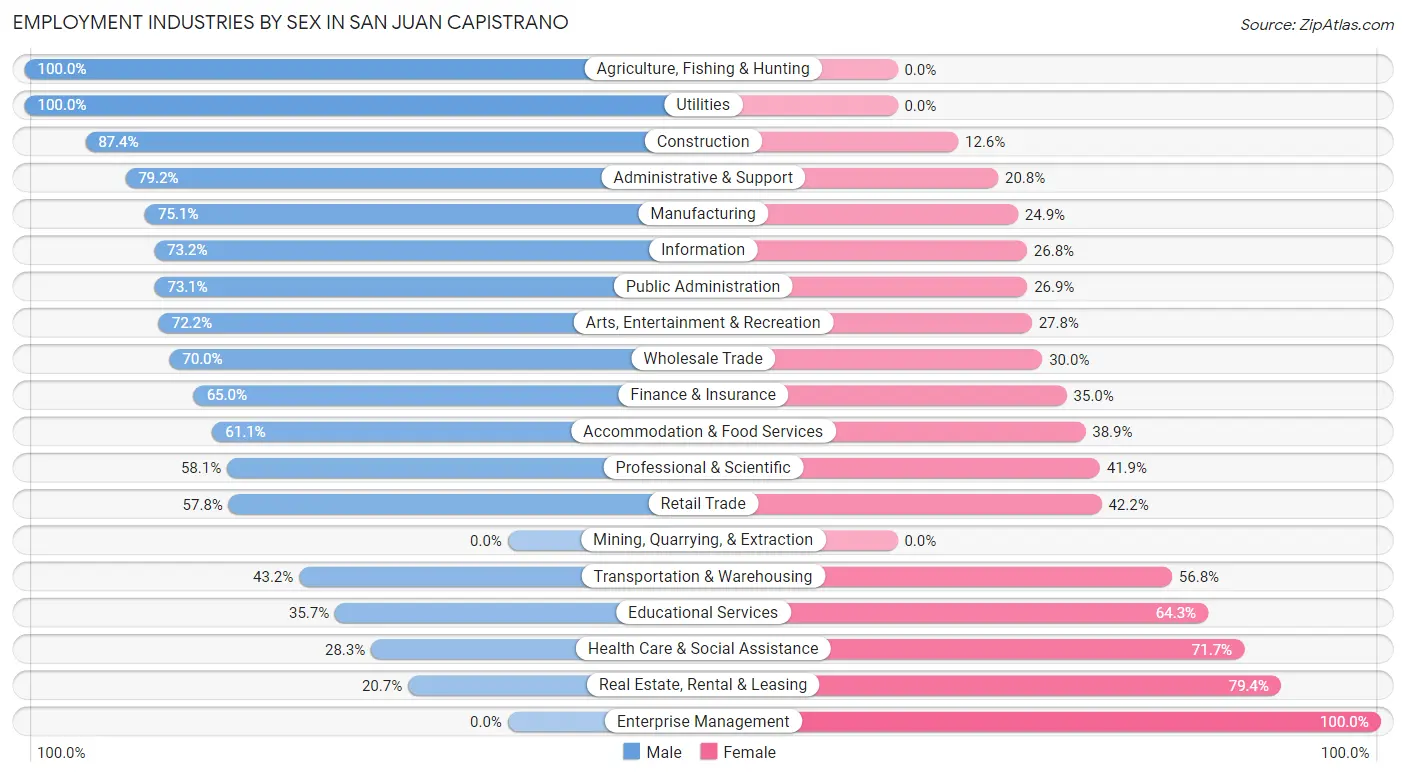
Employment Industries by Sex in San Juan Capistrano
The San Juan Capistrano industries that see more men than women are Agriculture, Fishing & Hunting (100.0%), Utilities (100.0%), and Construction (87.4%), whereas the industries that tend to have a higher number of women are Enterprise Management (100.0%), Real Estate, Rental & Leasing (79.3%), and Health Care & Social Assistance (71.7%).
| Industry | Male | Female |
| Agriculture, Fishing & Hunting | 106 (100.0%) | 0 (0.0%) |
| Mining, Quarrying, & Extraction | 0 (0.0%) | 0 (0.0%) |
| Construction | 1,051 (87.4%) | 151 (12.6%) |
| Manufacturing | 1,246 (75.1%) | 414 (24.9%) |
| Wholesale Trade | 486 (70.0%) | 208 (30.0%) |
| Retail Trade | 1,199 (57.8%) | 877 (42.2%) |
| Transportation & Warehousing | 190 (43.2%) | 250 (56.8%) |
| Utilities | 56 (100.0%) | 0 (0.0%) |
| Information | 213 (73.2%) | 78 (26.8%) |
| Finance & Insurance | 475 (65.0%) | 256 (35.0%) |
| Real Estate, Rental & Leasing | 146 (20.6%) | 561 (79.3%) |
| Professional & Scientific | 953 (58.1%) | 687 (41.9%) |
| Enterprise Management | 0 (0.0%) | 16 (100.0%) |
| Administrative & Support | 1,091 (79.2%) | 287 (20.8%) |
| Educational Services | 504 (35.7%) | 906 (64.3%) |
| Health Care & Social Assistance | 508 (28.3%) | 1,288 (71.7%) |
| Arts, Entertainment & Recreation | 265 (72.2%) | 102 (27.8%) |
| Accommodation & Food Services | 805 (61.1%) | 512 (38.9%) |
| Public Administration | 305 (73.1%) | 112 (26.9%) |
| Total | 9,932 (57.8%) | 7,243 (42.2%) |
Education in San Juan Capistrano
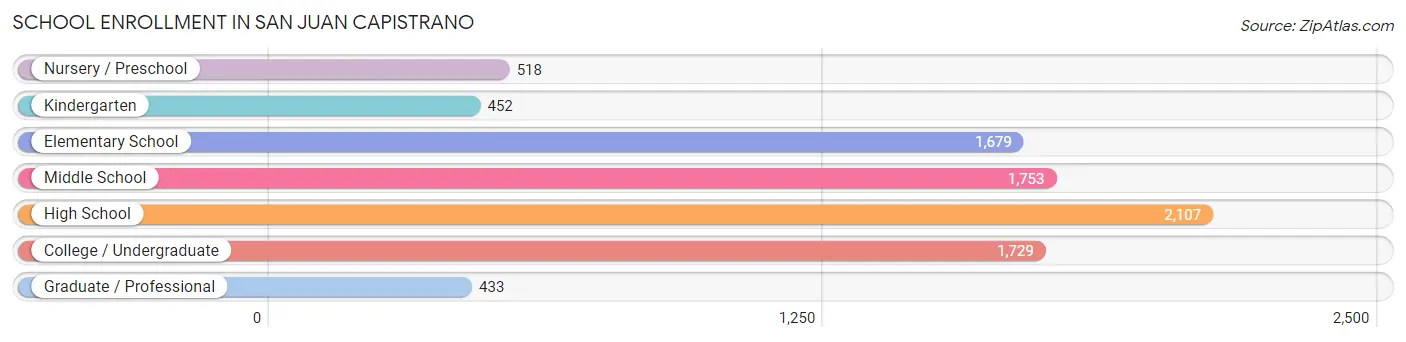
School Enrollment in San Juan Capistrano
The most common levels of schooling among the 8,671 students in San Juan Capistrano are high school (2,107 | 24.3%), middle school (1,753 | 20.2%), and college / undergraduate (1,729 | 19.9%).
| School Level | # Students | % Students |
| Nursery / Preschool | 518 | 6.0% |
| Kindergarten | 452 | 5.2% |
| Elementary School | 1,679 | 19.4% |
| Middle School | 1,753 | 20.2% |
| High School | 2,107 | 24.3% |
| College / Undergraduate | 1,729 | 19.9% |
| Graduate / Professional | 433 | 5.0% |
| Total | 8,671 | 100.0% |
School Enrollment by Age by Funding Source in San Juan Capistrano
Out of a total of 8,671 students who are enrolled in schools in San Juan Capistrano, 1,960 (22.6%) attend a private institution, while the remaining 6,711 (77.4%) are enrolled in public schools. The age group of 3 to 4 year olds has the highest likelihood of being enrolled in private schools, with 142 (45.5% in the age bracket) enrolled. Conversely, the age group of 25 to 34 year olds has the lowest likelihood of being enrolled in a private school, with 527 (92.8% in the age bracket) attending a public institution.
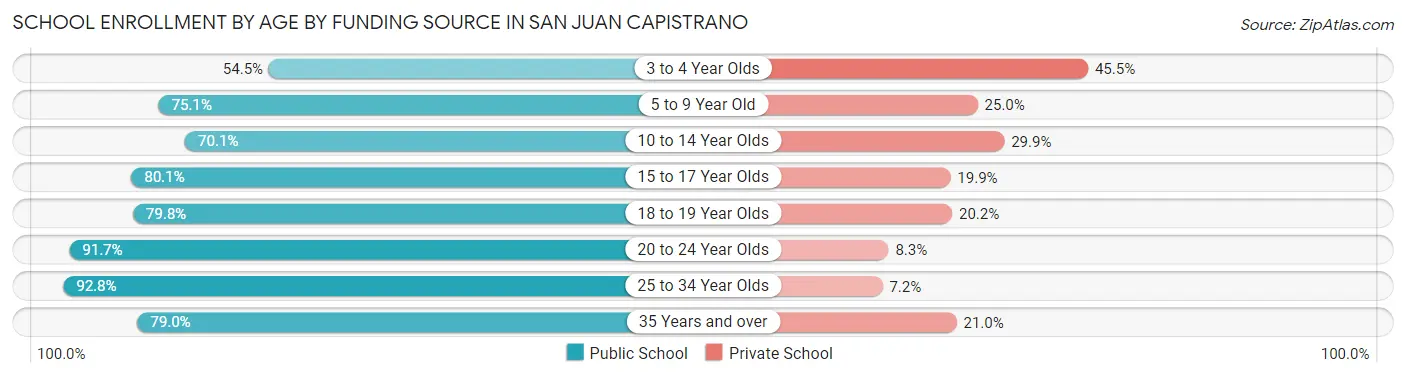
| Age Bracket | Public School | Private School |
| 3 to 4 Year Olds | 170 (54.5%) | 142 (45.5%) |
| 5 to 9 Year Old | 1,594 (75.0%) | 530 (24.9%) |
| 10 to 14 Year Olds | 1,486 (70.1%) | 634 (29.9%) |
| 15 to 17 Year Olds | 1,423 (80.1%) | 353 (19.9%) |
| 18 to 19 Year Olds | 273 (79.8%) | 69 (20.2%) |
| 20 to 24 Year Olds | 791 (91.7%) | 72 (8.3%) |
| 25 to 34 Year Olds | 527 (92.8%) | 41 (7.2%) |
| 35 Years and over | 447 (79.0%) | 119 (21.0%) |
| Total | 6,711 (77.4%) | 1,960 (22.6%) |
Educational Attainment by Field of Study in San Juan Capistrano
Business (2,317 | 21.7%), social sciences (1,429 | 13.4%), science & technology (956 | 9.0%), psychology (812 | 7.6%), and communications (729 | 6.8%) are the most common fields of study among 10,665 individuals in San Juan Capistrano who have obtained a bachelor's degree or higher.
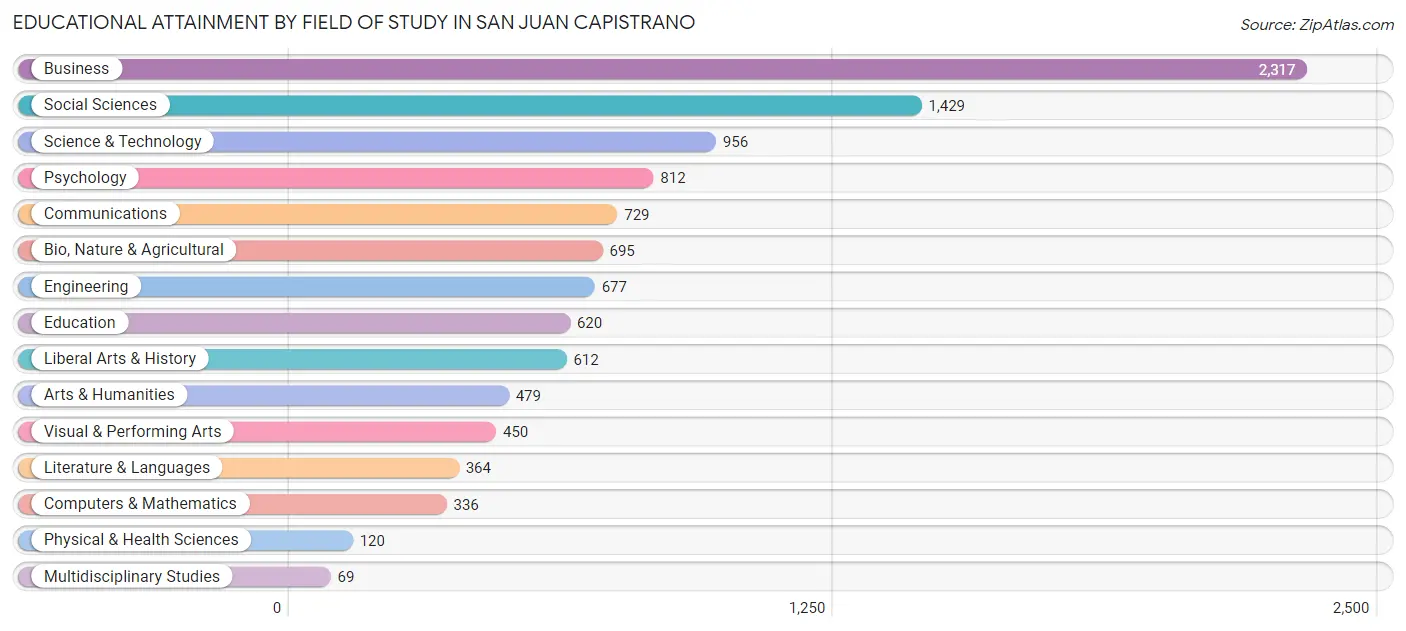
| Field of Study | # Graduates | % Graduates |
| Computers & Mathematics | 336 | 3.2% |
| Bio, Nature & Agricultural | 695 | 6.5% |
| Physical & Health Sciences | 120 | 1.1% |
| Psychology | 812 | 7.6% |
| Social Sciences | 1,429 | 13.4% |
| Engineering | 677 | 6.4% |
| Multidisciplinary Studies | 69 | 0.6% |
| Science & Technology | 956 | 9.0% |
| Business | 2,317 | 21.7% |
| Education | 620 | 5.8% |
| Literature & Languages | 364 | 3.4% |
| Liberal Arts & History | 612 | 5.7% |
| Visual & Performing Arts | 450 | 4.2% |
| Communications | 729 | 6.8% |
| Arts & Humanities | 479 | 4.5% |
| Total | 10,665 | 100.0% |
Transportation & Commute in San Juan Capistrano
Vehicle Availability by Sex in San Juan Capistrano
The most prevalent vehicle ownership categories in San Juan Capistrano are males with 2 vehicles (3,718, accounting for 37.6%) and females with 2 vehicles (2,630, making up 52.5%).
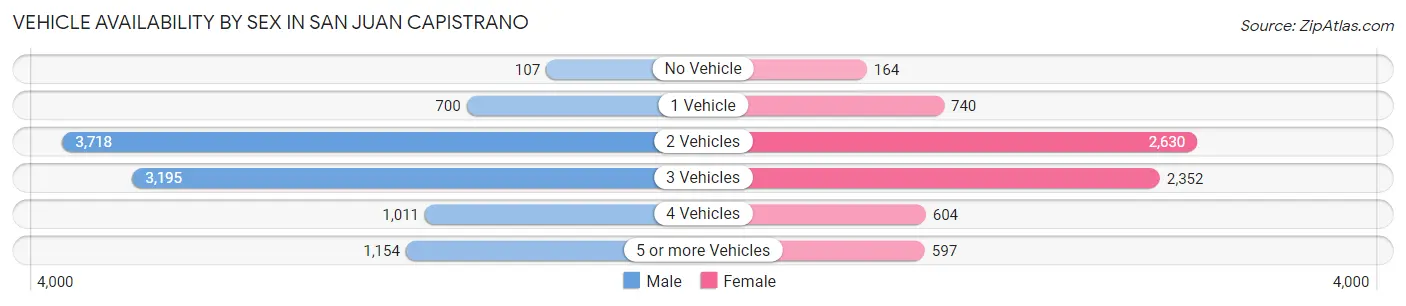
| Vehicles Available | Male | Female |
| No Vehicle | 107 (1.1%) | 164 (2.3%) |
| 1 Vehicle | 700 (7.1%) | 740 (10.4%) |
| 2 Vehicles | 3,718 (37.6%) | 2,630 (37.1%) |
| 3 Vehicles | 3,195 (32.3%) | 2,352 (33.2%) |
| 4 Vehicles | 1,011 (10.2%) | 604 (8.5%) |
| 5 or more Vehicles | 1,154 (11.7%) | 597 (8.4%) |
| Total | 9,885 (100.0%) | 7,087 (100.0%) |
Commute Time in San Juan Capistrano
The most frequently occuring commute durations in San Juan Capistrano are 15 to 19 minutes (2,477 commuters, 16.8%), 20 to 24 minutes (2,163 commuters, 14.7%), and 10 to 14 minutes (1,946 commuters, 13.2%).
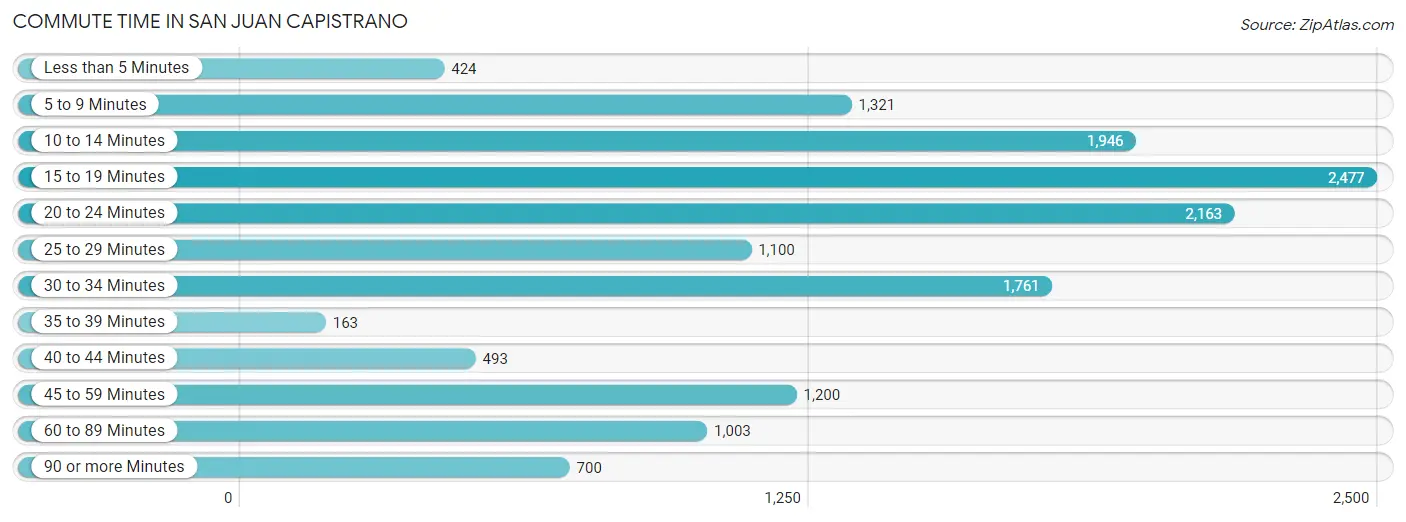
| Commute Time | # Commuters | % Commuters |
| Less than 5 Minutes | 424 | 2.9% |
| 5 to 9 Minutes | 1,321 | 9.0% |
| 10 to 14 Minutes | 1,946 | 13.2% |
| 15 to 19 Minutes | 2,477 | 16.8% |
| 20 to 24 Minutes | 2,163 | 14.7% |
| 25 to 29 Minutes | 1,100 | 7.5% |
| 30 to 34 Minutes | 1,761 | 11.9% |
| 35 to 39 Minutes | 163 | 1.1% |
| 40 to 44 Minutes | 493 | 3.3% |
| 45 to 59 Minutes | 1,200 | 8.1% |
| 60 to 89 Minutes | 1,003 | 6.8% |
| 90 or more Minutes | 700 | 4.8% |
Commute Time by Sex in San Juan Capistrano
The most common commute times in San Juan Capistrano are 15 to 19 minutes (1,473 commuters, 16.6%) for males and 20 to 24 minutes (1,049 commuters, 17.9%) for females.
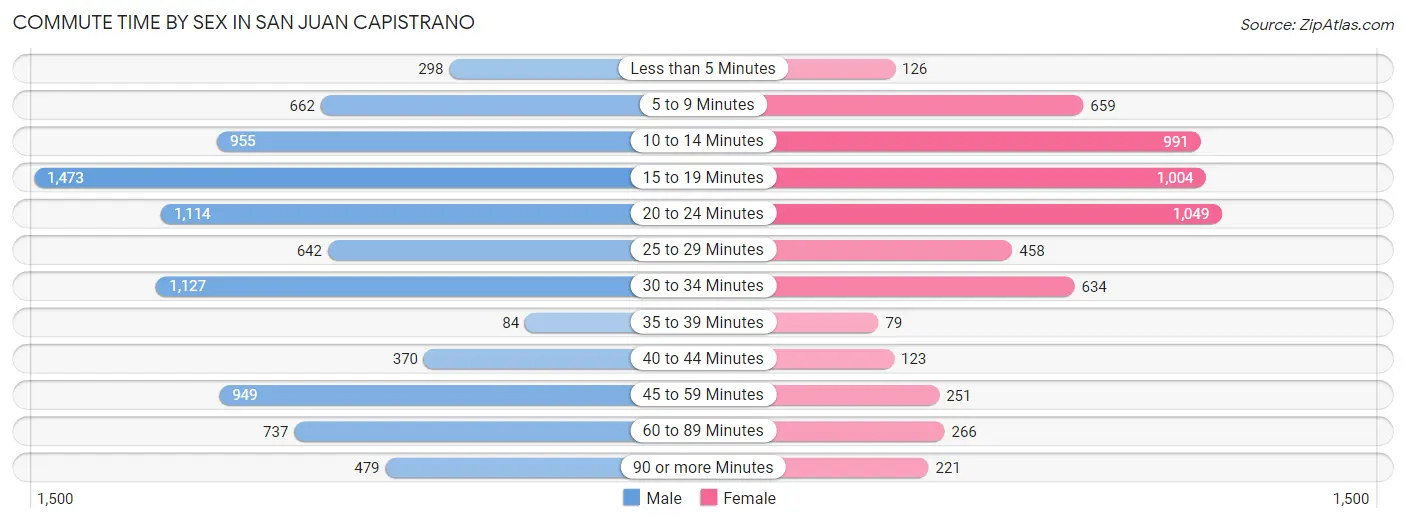
| Commute Time | Male | Female |
| Less than 5 Minutes | 298 (3.4%) | 126 (2.1%) |
| 5 to 9 Minutes | 662 (7.4%) | 659 (11.2%) |
| 10 to 14 Minutes | 955 (10.7%) | 991 (16.9%) |
| 15 to 19 Minutes | 1,473 (16.6%) | 1,004 (17.1%) |
| 20 to 24 Minutes | 1,114 (12.5%) | 1,049 (17.9%) |
| 25 to 29 Minutes | 642 (7.2%) | 458 (7.8%) |
| 30 to 34 Minutes | 1,127 (12.7%) | 634 (10.8%) |
| 35 to 39 Minutes | 84 (0.9%) | 79 (1.3%) |
| 40 to 44 Minutes | 370 (4.2%) | 123 (2.1%) |
| 45 to 59 Minutes | 949 (10.7%) | 251 (4.3%) |
| 60 to 89 Minutes | 737 (8.3%) | 266 (4.5%) |
| 90 or more Minutes | 479 (5.4%) | 221 (3.8%) |
Time of Departure to Work by Sex in San Juan Capistrano
The most frequent times of departure to work in San Juan Capistrano are 7:00 AM to 7:29 AM (1,169, 13.2%) for males and 7:00 AM to 7:29 AM (1,034, 17.6%) for females.
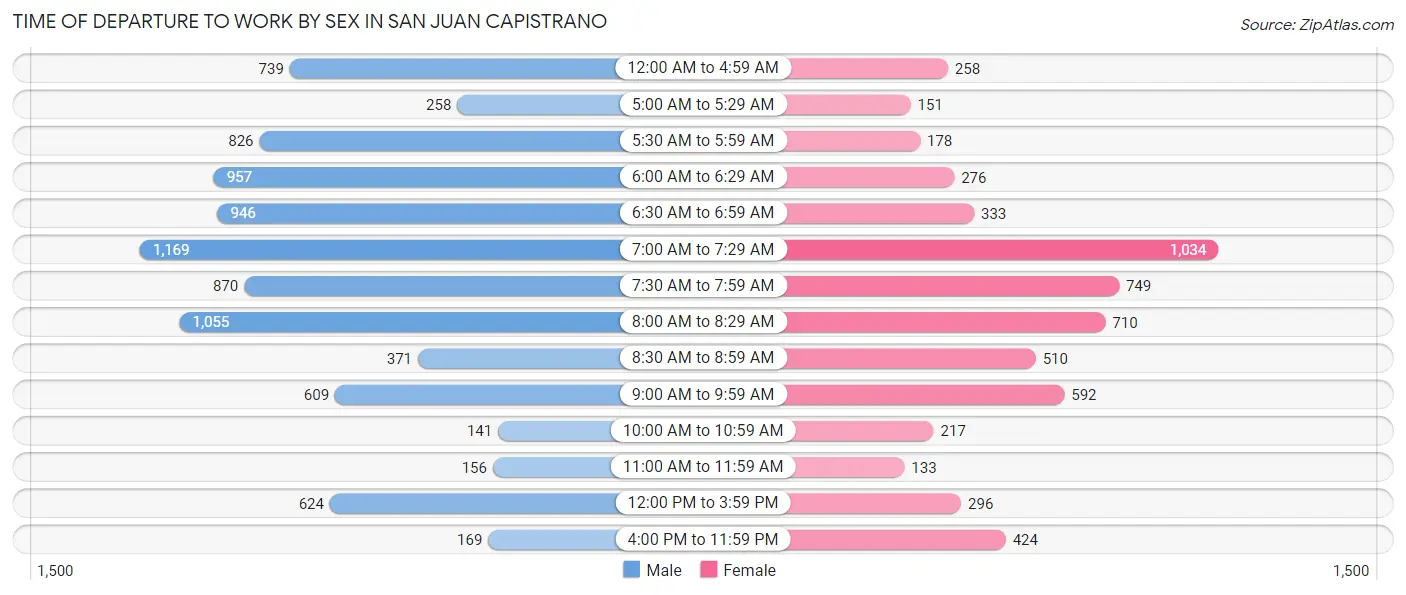
| Time of Departure | Male | Female |
| 12:00 AM to 4:59 AM | 739 (8.3%) | 258 (4.4%) |
| 5:00 AM to 5:29 AM | 258 (2.9%) | 151 (2.6%) |
| 5:30 AM to 5:59 AM | 826 (9.3%) | 178 (3.0%) |
| 6:00 AM to 6:29 AM | 957 (10.8%) | 276 (4.7%) |
| 6:30 AM to 6:59 AM | 946 (10.6%) | 333 (5.7%) |
| 7:00 AM to 7:29 AM | 1,169 (13.2%) | 1,034 (17.6%) |
| 7:30 AM to 7:59 AM | 870 (9.8%) | 749 (12.8%) |
| 8:00 AM to 8:29 AM | 1,055 (11.9%) | 710 (12.1%) |
| 8:30 AM to 8:59 AM | 371 (4.2%) | 510 (8.7%) |
| 9:00 AM to 9:59 AM | 609 (6.9%) | 592 (10.1%) |
| 10:00 AM to 10:59 AM | 141 (1.6%) | 217 (3.7%) |
| 11:00 AM to 11:59 AM | 156 (1.8%) | 133 (2.3%) |
| 12:00 PM to 3:59 PM | 624 (7.0%) | 296 (5.1%) |
| 4:00 PM to 11:59 PM | 169 (1.9%) | 424 (7.2%) |
| Total | 8,890 (100.0%) | 5,861 (100.0%) |
Housing Occupancy in San Juan Capistrano
Occupancy by Ownership in San Juan Capistrano
Of the total 11,769 dwellings in San Juan Capistrano, owner-occupied units account for 8,991 (76.4%), while renter-occupied units make up 2,778 (23.6%).
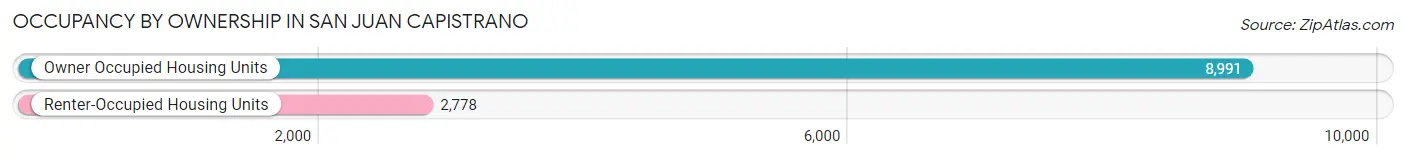
| Occupancy | # Housing Units | % Housing Units |
| Owner Occupied Housing Units | 8,991 | 76.4% |
| Renter-Occupied Housing Units | 2,778 | 23.6% |
| Total Occupied Housing Units | 11,769 | 100.0% |
Occupancy by Household Size in San Juan Capistrano
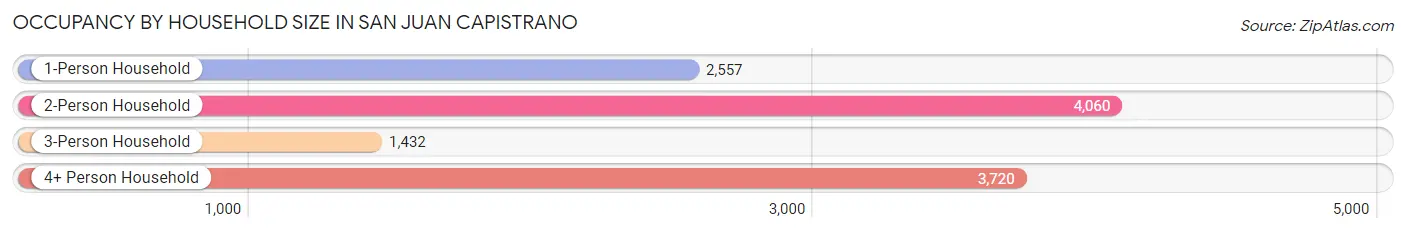
| Household Size | # Housing Units | % Housing Units |
| 1-Person Household | 2,557 | 21.7% |
| 2-Person Household | 4,060 | 34.5% |
| 3-Person Household | 1,432 | 12.2% |
| 4+ Person Household | 3,720 | 31.6% |
| Total Housing Units | 11,769 | 100.0% |
Occupancy by Ownership by Household Size in San Juan Capistrano
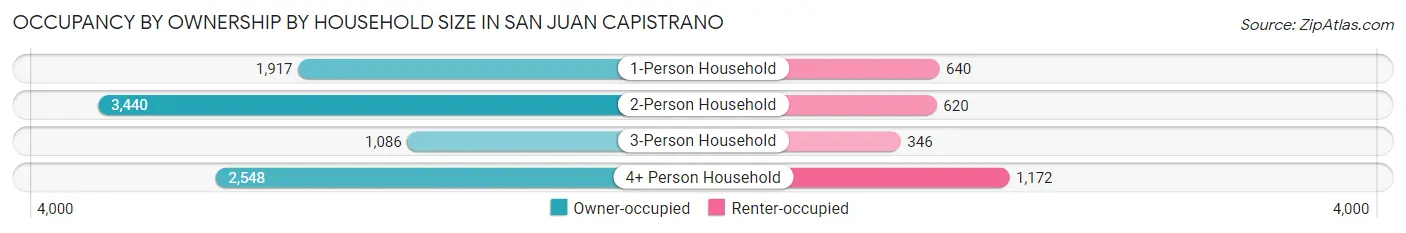
| Household Size | Owner-occupied | Renter-occupied |
| 1-Person Household | 1,917 (75.0%) | 640 (25.0%) |
| 2-Person Household | 3,440 (84.7%) | 620 (15.3%) |
| 3-Person Household | 1,086 (75.8%) | 346 (24.2%) |
| 4+ Person Household | 2,548 (68.5%) | 1,172 (31.5%) |
| Total Housing Units | 8,991 (76.4%) | 2,778 (23.6%) |
Occupancy by Educational Attainment in San Juan Capistrano
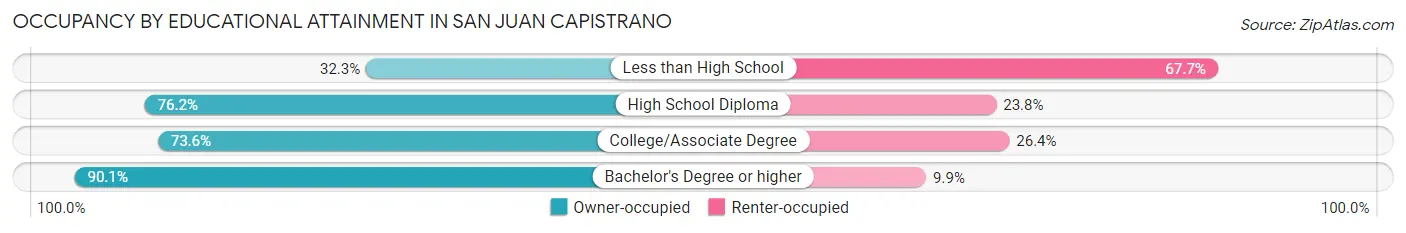
| Household Size | Owner-occupied | Renter-occupied |
| Less than High School | 480 (32.3%) | 1,006 (67.7%) |
| High School Diploma | 1,040 (76.2%) | 325 (23.8%) |
| College/Associate Degree | 2,510 (73.6%) | 901 (26.4%) |
| Bachelor's Degree or higher | 4,961 (90.1%) | 546 (9.9%) |
Occupancy by Age of Householder in San Juan Capistrano
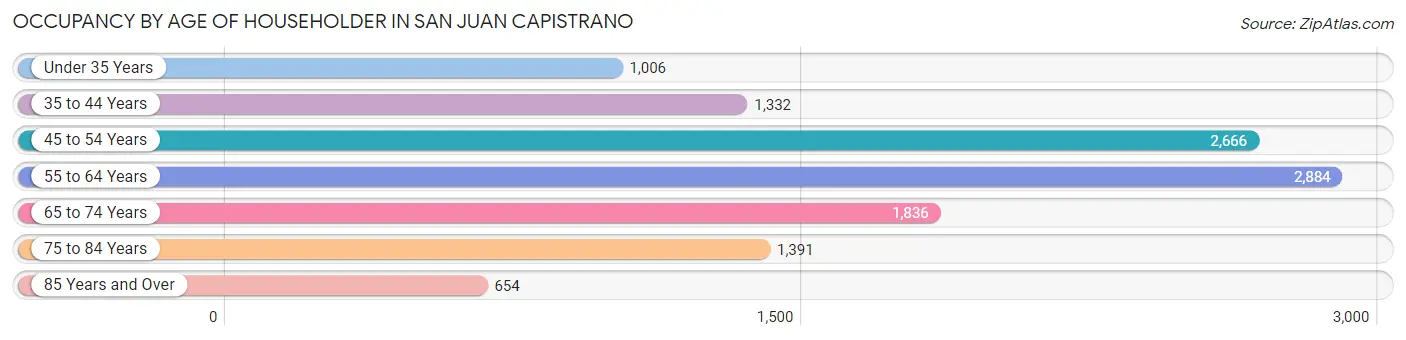
| Age Bracket | # Households | % Households |
| Under 35 Years | 1,006 | 8.6% |
| 35 to 44 Years | 1,332 | 11.3% |
| 45 to 54 Years | 2,666 | 22.7% |
| 55 to 64 Years | 2,884 | 24.5% |
| 65 to 74 Years | 1,836 | 15.6% |
| 75 to 84 Years | 1,391 | 11.8% |
| 85 Years and Over | 654 | 5.6% |
| Total | 11,769 | 100.0% |
Housing Finances in San Juan Capistrano
Median Income by Occupancy in San Juan Capistrano
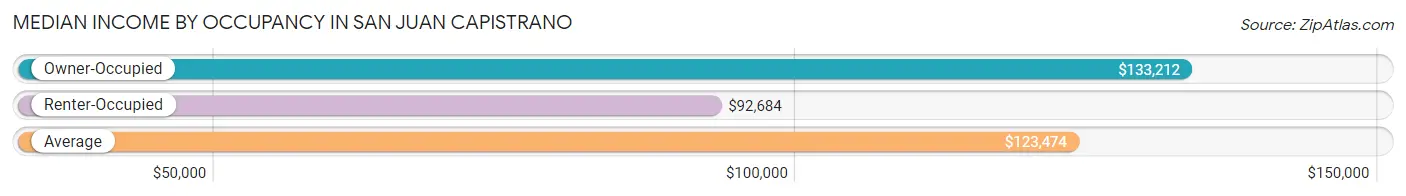
| Occupancy Type | # Households | Median Income |
| Owner-Occupied | 8,991 (76.4%) | $133,212 |
| Renter-Occupied | 2,778 (23.6%) | $92,684 |
| Average | 11,769 (100.0%) | $123,474 |
Occupancy by Householder Income Bracket in San Juan Capistrano
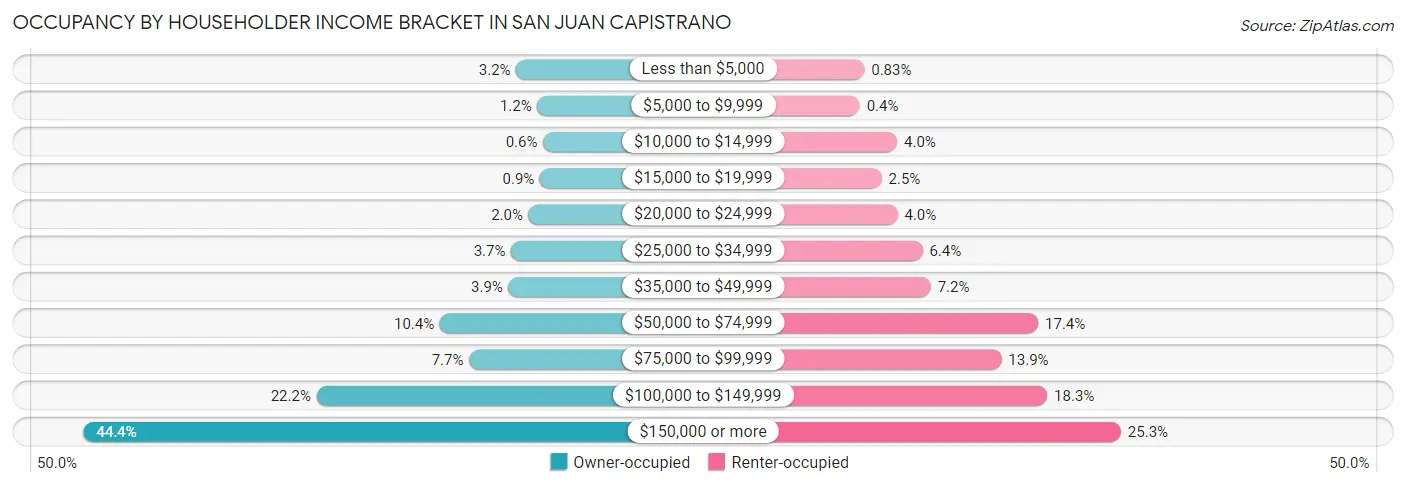
| Income Bracket | Owner-occupied | Renter-occupied |
| Less than $5,000 | 284 (3.2%) | 23 (0.8%) |
| $5,000 to $9,999 | 103 (1.1%) | 11 (0.4%) |
| $10,000 to $14,999 | 54 (0.6%) | 110 (4.0%) |
| $15,000 to $19,999 | 81 (0.9%) | 69 (2.5%) |
| $20,000 to $24,999 | 178 (2.0%) | 111 (4.0%) |
| $25,000 to $34,999 | 328 (3.6%) | 177 (6.4%) |
| $35,000 to $49,999 | 351 (3.9%) | 199 (7.2%) |
| $50,000 to $74,999 | 938 (10.4%) | 483 (17.4%) |
| $75,000 to $99,999 | 688 (7.6%) | 386 (13.9%) |
| $100,000 to $149,999 | 1,994 (22.2%) | 507 (18.2%) |
| $150,000 or more | 3,992 (44.4%) | 702 (25.3%) |
| Total | 8,991 (100.0%) | 2,778 (100.0%) |
Monthly Housing Cost Tiers in San Juan Capistrano
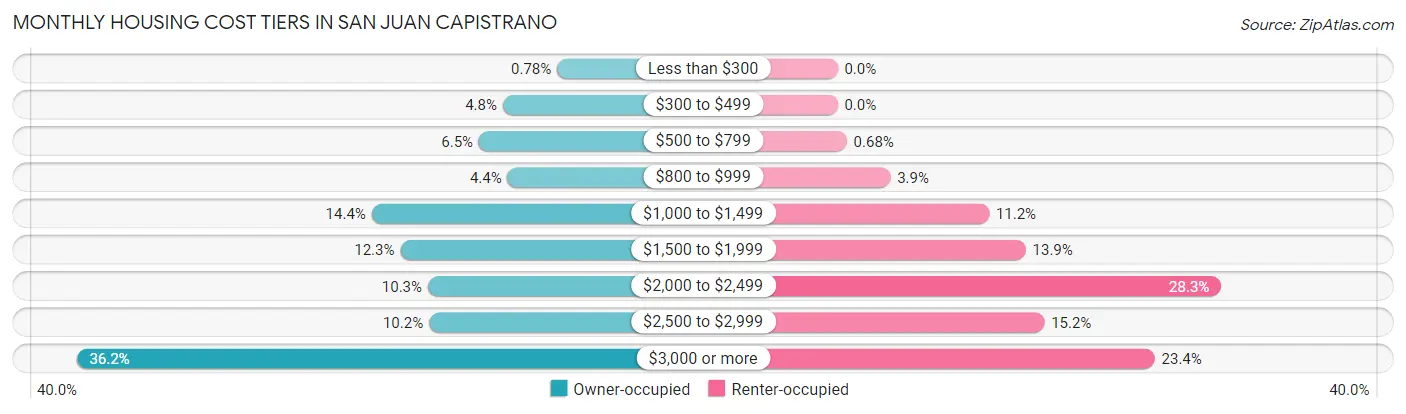
| Monthly Cost | Owner-occupied | Renter-occupied |
| Less than $300 | 70 (0.8%) | 0 (0.0%) |
| $300 to $499 | 430 (4.8%) | 0 (0.0%) |
| $500 to $799 | 588 (6.5%) | 19 (0.7%) |
| $800 to $999 | 398 (4.4%) | 108 (3.9%) |
| $1,000 to $1,499 | 1,298 (14.4%) | 310 (11.2%) |
| $1,500 to $1,999 | 1,109 (12.3%) | 385 (13.9%) |
| $2,000 to $2,499 | 926 (10.3%) | 785 (28.3%) |
| $2,500 to $2,999 | 919 (10.2%) | 423 (15.2%) |
| $3,000 or more | 3,253 (36.2%) | 649 (23.4%) |
| Total | 8,991 (100.0%) | 2,778 (100.0%) |
Physical Housing Characteristics in San Juan Capistrano
Housing Structures in San Juan Capistrano
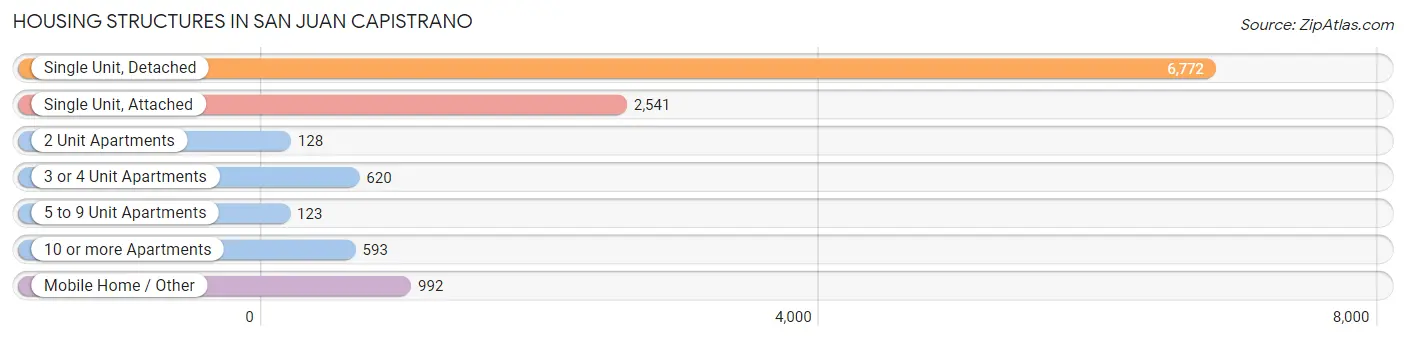
| Structure Type | # Housing Units | % Housing Units |
| Single Unit, Detached | 6,772 | 57.5% |
| Single Unit, Attached | 2,541 | 21.6% |
| 2 Unit Apartments | 128 | 1.1% |
| 3 or 4 Unit Apartments | 620 | 5.3% |
| 5 to 9 Unit Apartments | 123 | 1.1% |
| 10 or more Apartments | 593 | 5.0% |
| Mobile Home / Other | 992 | 8.4% |
| Total | 11,769 | 100.0% |
Housing Structures by Occupancy in San Juan Capistrano
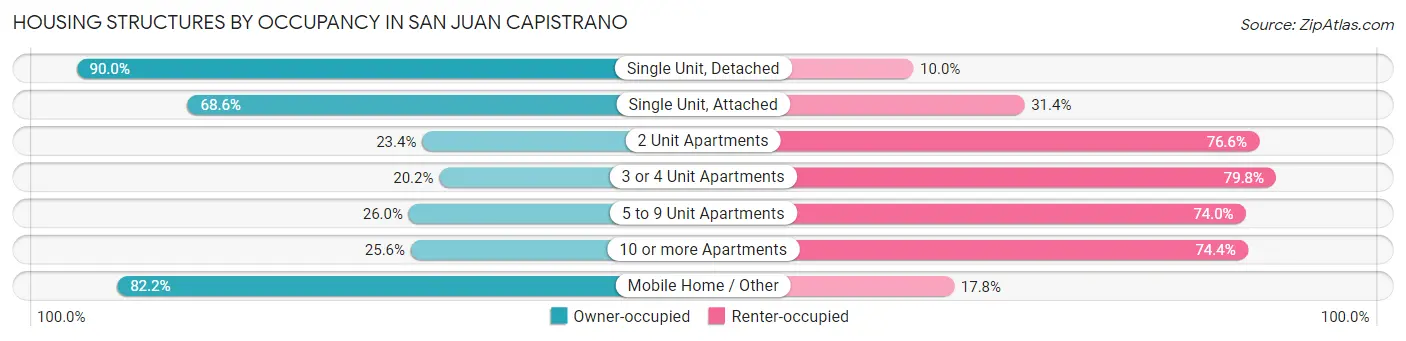
| Structure Type | Owner-occupied | Renter-occupied |
| Single Unit, Detached | 6,094 (90.0%) | 678 (10.0%) |
| Single Unit, Attached | 1,743 (68.6%) | 798 (31.4%) |
| 2 Unit Apartments | 30 (23.4%) | 98 (76.6%) |
| 3 or 4 Unit Apartments | 125 (20.2%) | 495 (79.8%) |
| 5 to 9 Unit Apartments | 32 (26.0%) | 91 (74.0%) |
| 10 or more Apartments | 152 (25.6%) | 441 (74.4%) |
| Mobile Home / Other | 815 (82.2%) | 177 (17.8%) |
| Total | 8,991 (76.4%) | 2,778 (23.6%) |
Housing Structures by Number of Rooms in San Juan Capistrano
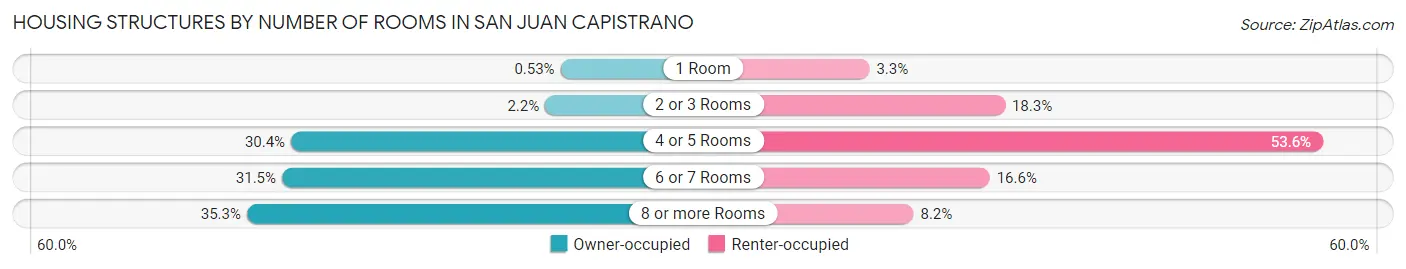
| Number of Rooms | Owner-occupied | Renter-occupied |
| 1 Room | 48 (0.5%) | 91 (3.3%) |
| 2 or 3 Rooms | 201 (2.2%) | 509 (18.3%) |
| 4 or 5 Rooms | 2,737 (30.4%) | 1,489 (53.6%) |
| 6 or 7 Rooms | 2,828 (31.5%) | 462 (16.6%) |
| 8 or more Rooms | 3,177 (35.3%) | 227 (8.2%) |
| Total | 8,991 (100.0%) | 2,778 (100.0%) |
Housing Structure by Heating Type in San Juan Capistrano
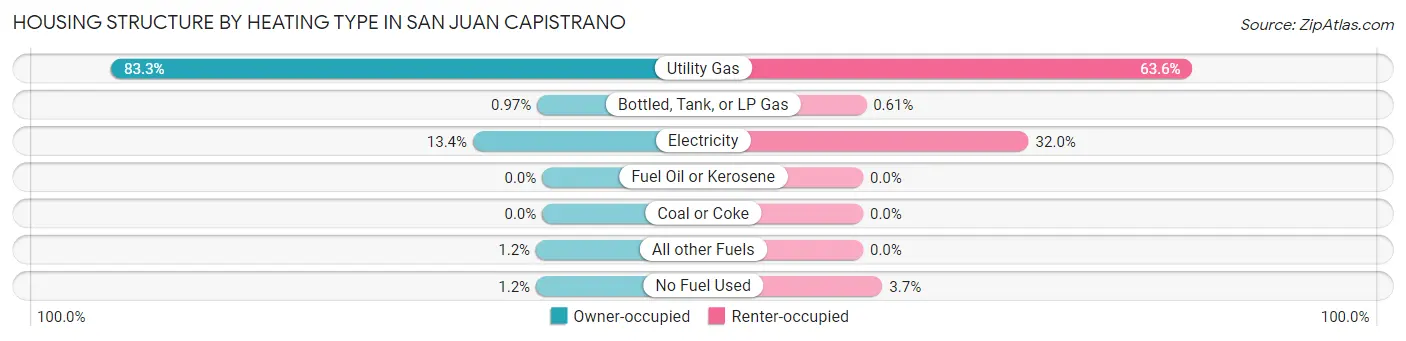
| Heating Type | Owner-occupied | Renter-occupied |
| Utility Gas | 7,487 (83.3%) | 1,768 (63.6%) |
| Bottled, Tank, or LP Gas | 87 (1.0%) | 17 (0.6%) |
| Electricity | 1,203 (13.4%) | 889 (32.0%) |
| Fuel Oil or Kerosene | 0 (0.0%) | 0 (0.0%) |
| Coal or Coke | 0 (0.0%) | 0 (0.0%) |
| All other Fuels | 107 (1.2%) | 0 (0.0%) |
| No Fuel Used | 107 (1.2%) | 104 (3.7%) |
| Total | 8,991 (100.0%) | 2,778 (100.0%) |
Household Vehicle Usage in San Juan Capistrano
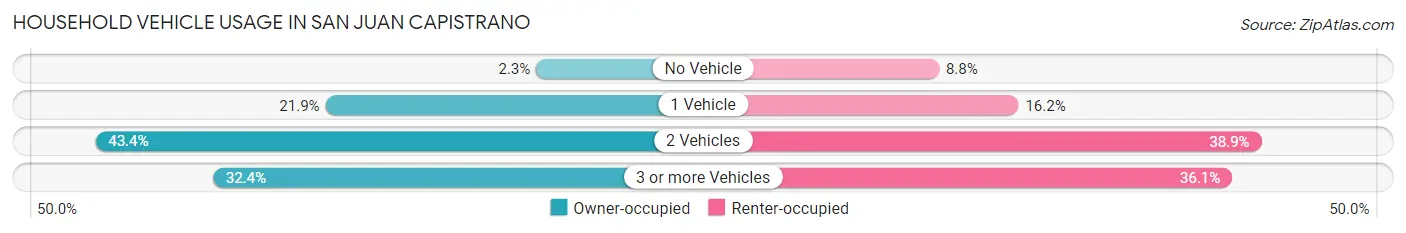
| Vehicles per Household | Owner-occupied | Renter-occupied |
| No Vehicle | 202 (2.2%) | 244 (8.8%) |
| 1 Vehicle | 1,971 (21.9%) | 450 (16.2%) |
| 2 Vehicles | 3,902 (43.4%) | 1,080 (38.9%) |
| 3 or more Vehicles | 2,916 (32.4%) | 1,004 (36.1%) |
| Total | 8,991 (100.0%) | 2,778 (100.0%) |
Real Estate & Mortgages in San Juan Capistrano
Real Estate and Mortgage Overview in San Juan Capistrano
| Characteristic | Without Mortgage | With Mortgage |
| Housing Units | 3,080 | 5,911 |
| Median Property Value | $796,900 | $917,400 |
| Median Household Income | $105,217 | $3,081 |
| Monthly Housing Costs | $1,056 | $3,194 |
| Real Estate Taxes | $4,766 | $160 |
Property Value by Mortgage Status in San Juan Capistrano
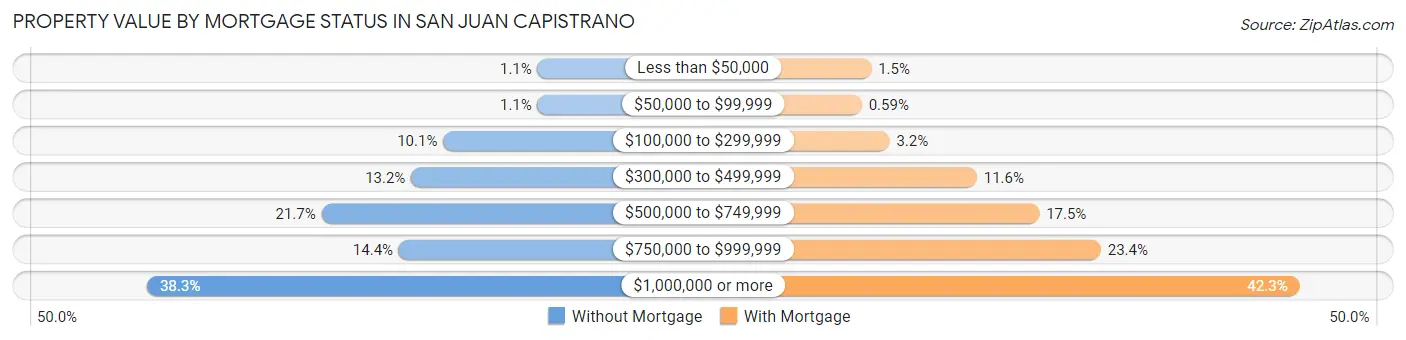
| Property Value | Without Mortgage | With Mortgage |
| Less than $50,000 | 35 (1.1%) | 88 (1.5%) |
| $50,000 to $99,999 | 35 (1.1%) | 35 (0.6%) |
| $100,000 to $299,999 | 312 (10.1%) | 191 (3.2%) |
| $300,000 to $499,999 | 406 (13.2%) | 683 (11.6%) |
| $500,000 to $749,999 | 669 (21.7%) | 1,034 (17.5%) |
| $750,000 to $999,999 | 442 (14.3%) | 1,381 (23.4%) |
| $1,000,000 or more | 1,181 (38.3%) | 2,499 (42.3%) |
| Total | 3,080 (100.0%) | 5,911 (100.0%) |
Household Income by Mortgage Status in San Juan Capistrano
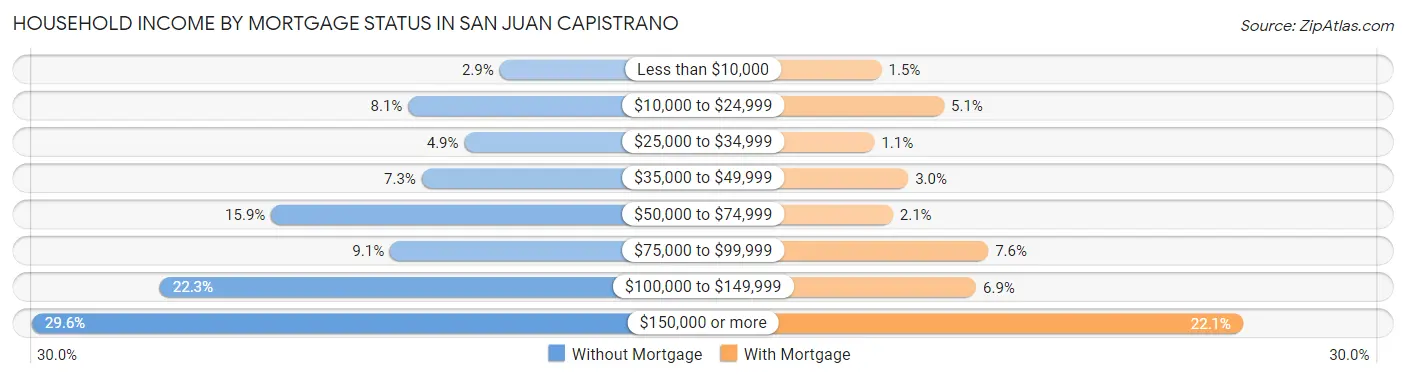
| Household Income | Without Mortgage | With Mortgage |
| Less than $10,000 | 88 (2.9%) | 88 (1.5%) |
| $10,000 to $24,999 | 249 (8.1%) | 299 (5.1%) |
| $25,000 to $34,999 | 150 (4.9%) | 64 (1.1%) |
| $35,000 to $49,999 | 225 (7.3%) | 178 (3.0%) |
| $50,000 to $74,999 | 490 (15.9%) | 126 (2.1%) |
| $75,000 to $99,999 | 281 (9.1%) | 448 (7.6%) |
| $100,000 to $149,999 | 686 (22.3%) | 407 (6.9%) |
| $150,000 or more | 911 (29.6%) | 1,308 (22.1%) |
| Total | 3,080 (100.0%) | 5,911 (100.0%) |
Property Value to Household Income Ratio in San Juan Capistrano
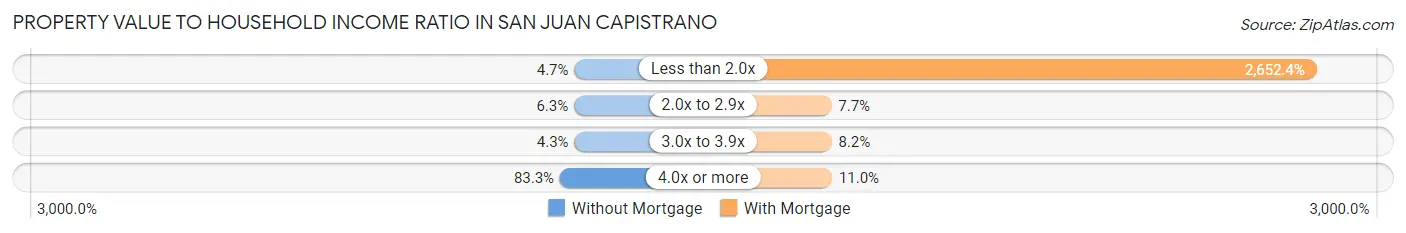
| Value-to-Income Ratio | Without Mortgage | With Mortgage |
| Less than 2.0x | 146 (4.7%) | 156,781 (2,652.4%) |
| 2.0x to 2.9x | 195 (6.3%) | 453 (7.7%) |
| 3.0x to 3.9x | 132 (4.3%) | 485 (8.2%) |
| 4.0x or more | 2,566 (83.3%) | 650 (11.0%) |
| Total | 3,080 (100.0%) | 5,911 (100.0%) |
Real Estate Taxes by Mortgage Status in San Juan Capistrano
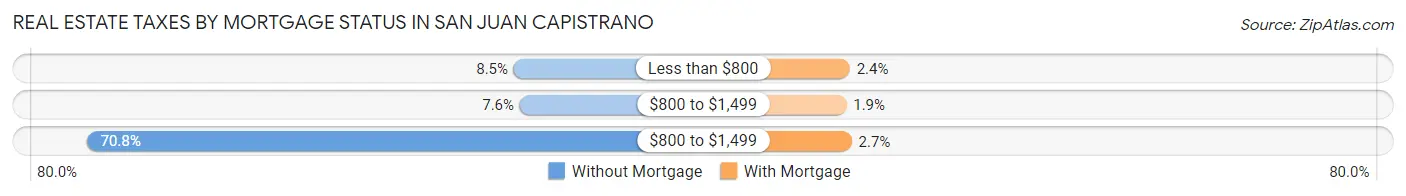
| Property Taxes | Without Mortgage | With Mortgage |
| Less than $800 | 262 (8.5%) | 144 (2.4%) |
| $800 to $1,499 | 235 (7.6%) | 114 (1.9%) |
| $800 to $1,499 | 2,181 (70.8%) | 160 (2.7%) |
| Total | 3,080 (100.0%) | 5,911 (100.0%) |
Health & Disability in San Juan Capistrano
Health Insurance Coverage by Age in San Juan Capistrano
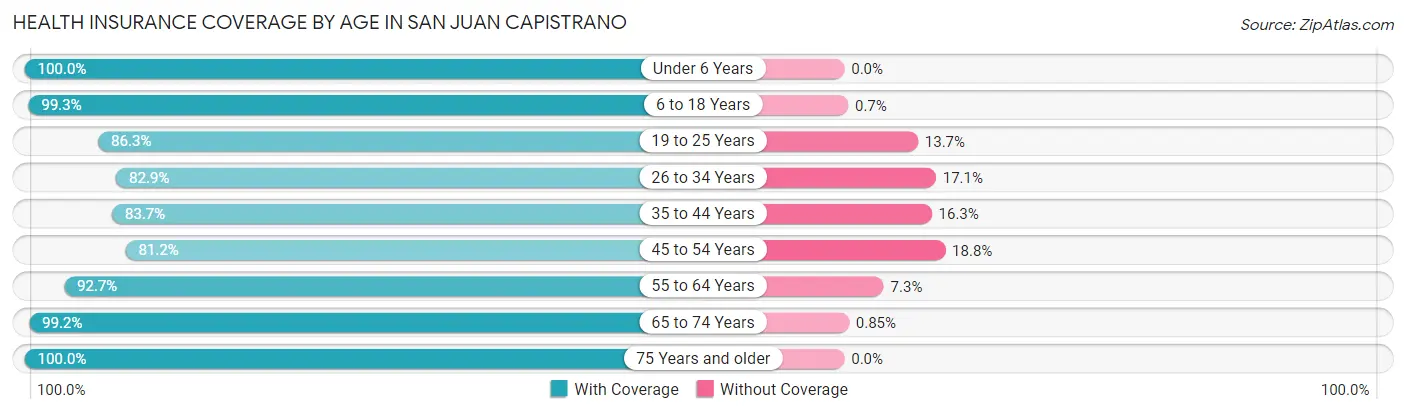
| Age Bracket | With Coverage | Without Coverage |
| Under 6 Years | 2,059 (100.0%) | 0 (0.0%) |
| 6 to 18 Years | 6,207 (99.3%) | 44 (0.7%) |
| 19 to 25 Years | 2,263 (86.3%) | 360 (13.7%) |
| 26 to 34 Years | 3,118 (82.9%) | 642 (17.1%) |
| 35 to 44 Years | 3,116 (83.7%) | 606 (16.3%) |
| 45 to 54 Years | 4,178 (81.2%) | 968 (18.8%) |
| 55 to 64 Years | 4,621 (92.7%) | 366 (7.3%) |
| 65 to 74 Years | 3,023 (99.2%) | 26 (0.9%) |
| 75 Years and older | 3,337 (100.0%) | 0 (0.0%) |
| Total | 31,922 (91.4%) | 3,012 (8.6%) |
Health Insurance Coverage by Citizenship Status in San Juan Capistrano
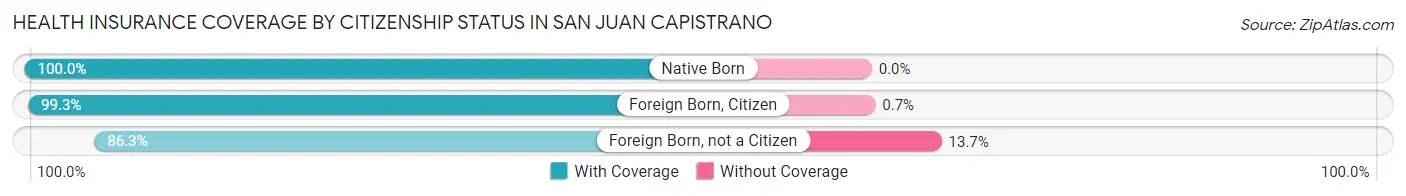
| Citizenship Status | With Coverage | Without Coverage |
| Native Born | 2,059 (100.0%) | 0 (0.0%) |
| Foreign Born, Citizen | 6,207 (99.3%) | 44 (0.7%) |
| Foreign Born, not a Citizen | 2,263 (86.3%) | 360 (13.7%) |
Health Insurance Coverage by Household Income in San Juan Capistrano
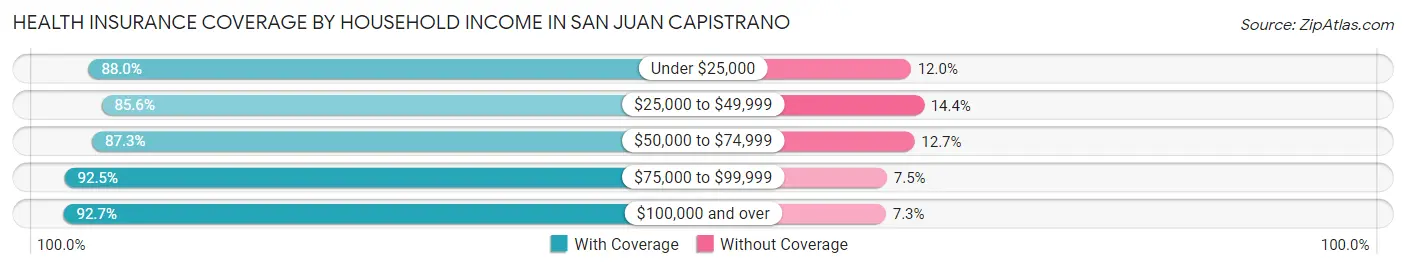
| Household Income | With Coverage | Without Coverage |
| Under $25,000 | 1,550 (88.0%) | 211 (12.0%) |
| $25,000 to $49,999 | 1,794 (85.6%) | 302 (14.4%) |
| $50,000 to $74,999 | 3,752 (87.3%) | 544 (12.7%) |
| $75,000 to $99,999 | 2,640 (92.5%) | 214 (7.5%) |
| $100,000 and over | 22,054 (92.7%) | 1,740 (7.3%) |
Public vs Private Health Insurance Coverage by Age in San Juan Capistrano
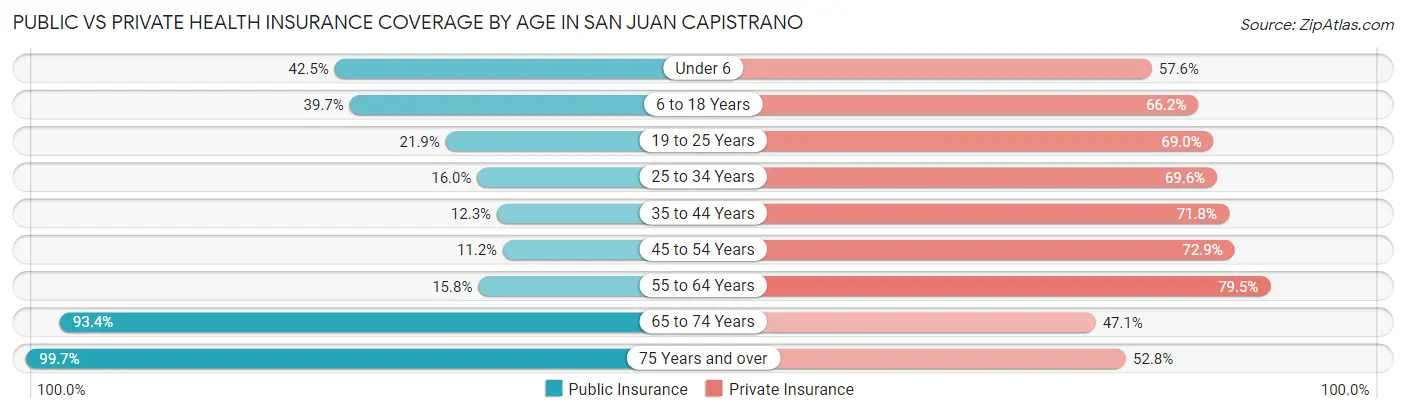
| Age Bracket | Public Insurance | Private Insurance |
| Under 6 | 874 (42.4%) | 1,185 (57.6%) |
| 6 to 18 Years | 2,480 (39.7%) | 4,135 (66.1%) |
| 19 to 25 Years | 573 (21.8%) | 1,810 (69.0%) |
| 25 to 34 Years | 601 (16.0%) | 2,618 (69.6%) |
| 35 to 44 Years | 459 (12.3%) | 2,673 (71.8%) |
| 45 to 54 Years | 577 (11.2%) | 3,751 (72.9%) |
| 55 to 64 Years | 788 (15.8%) | 3,965 (79.5%) |
| 65 to 74 Years | 2,849 (93.4%) | 1,437 (47.1%) |
| 75 Years and over | 3,326 (99.7%) | 1,761 (52.8%) |
| Total | 12,527 (35.9%) | 23,335 (66.8%) |
Disability Status by Sex by Age in San Juan Capistrano
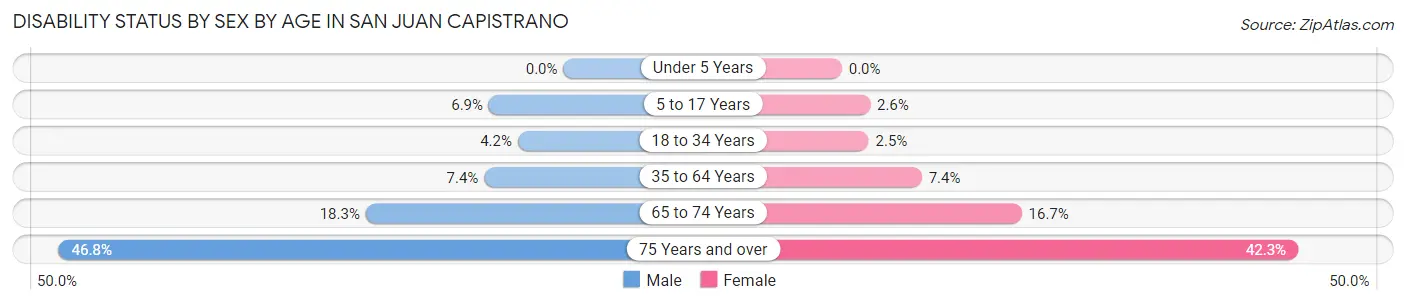
| Age Bracket | Male | Female |
| Under 5 Years | 0 (0.0%) | 0 (0.0%) |
| 5 to 17 Years | 205 (6.9%) | 91 (2.6%) |
| 18 to 34 Years | 139 (4.2%) | 82 (2.5%) |
| 35 to 64 Years | 510 (7.3%) | 513 (7.4%) |
| 65 to 74 Years | 269 (18.3%) | 264 (16.7%) |
| 75 Years and over | 629 (46.8%) | 844 (42.3%) |
Disability Class by Sex by Age in San Juan Capistrano
Disability Class: Hearing Difficulty
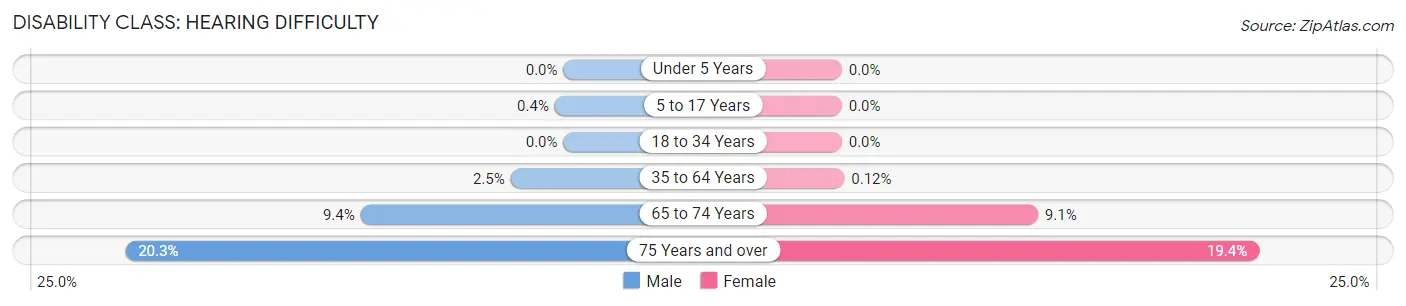
| Age Bracket | Male | Female |
| Under 5 Years | 0 (0.0%) | 0 (0.0%) |
| 5 to 17 Years | 12 (0.4%) | 0 (0.0%) |
| 18 to 34 Years | 0 (0.0%) | 0 (0.0%) |
| 35 to 64 Years | 170 (2.5%) | 8 (0.1%) |
| 65 to 74 Years | 138 (9.4%) | 144 (9.1%) |
| 75 Years and over | 273 (20.3%) | 386 (19.4%) |
Disability Class: Vision Difficulty
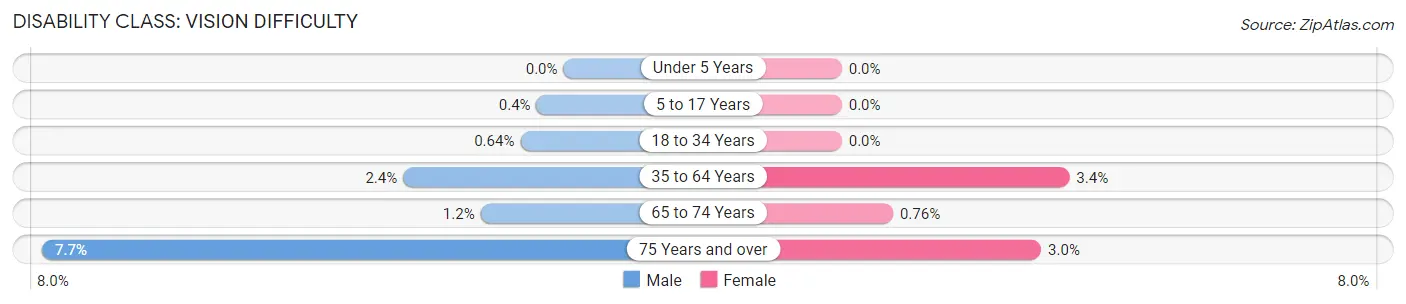
| Age Bracket | Male | Female |
| Under 5 Years | 0 (0.0%) | 0 (0.0%) |
| 5 to 17 Years | 12 (0.4%) | 0 (0.0%) |
| 18 to 34 Years | 21 (0.6%) | 0 (0.0%) |
| 35 to 64 Years | 165 (2.4%) | 234 (3.4%) |
| 65 to 74 Years | 18 (1.2%) | 12 (0.8%) |
| 75 Years and over | 104 (7.7%) | 59 (3.0%) |
Disability Class: Cognitive Difficulty
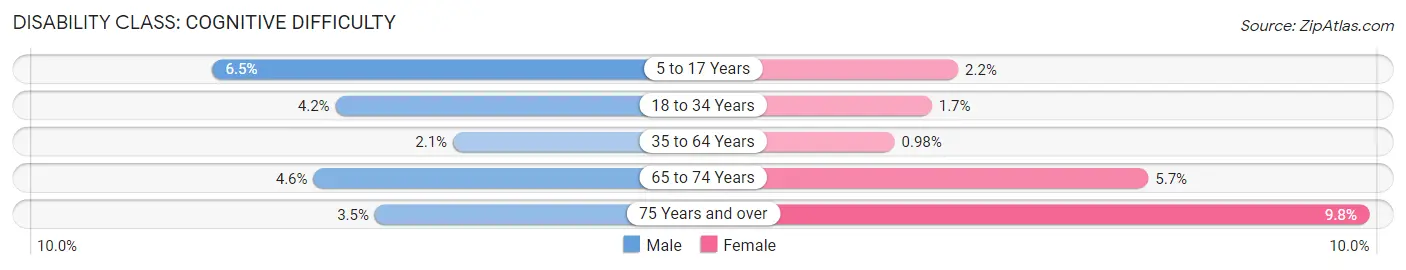
| Age Bracket | Male | Female |
| 5 to 17 Years | 193 (6.5%) | 75 (2.2%) |
| 18 to 34 Years | 139 (4.2%) | 55 (1.7%) |
| 35 to 64 Years | 142 (2.1%) | 68 (1.0%) |
| 65 to 74 Years | 68 (4.6%) | 90 (5.7%) |
| 75 Years and over | 47 (3.5%) | 195 (9.8%) |
Disability Class: Ambulatory Difficulty
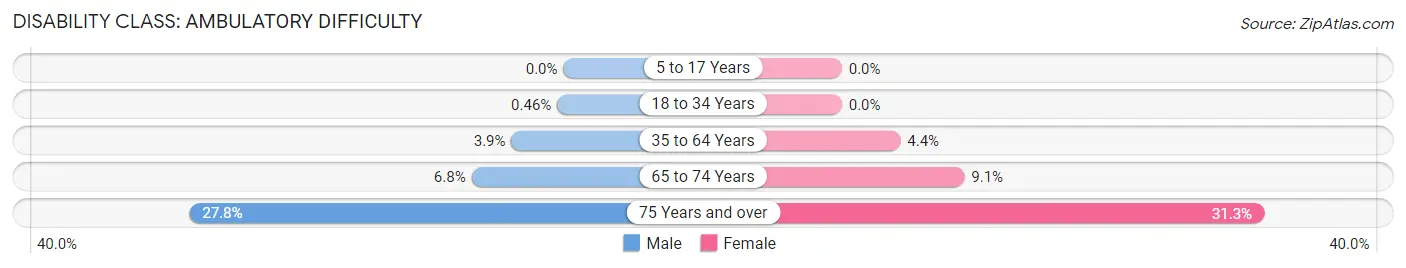
| Age Bracket | Male | Female |
| 5 to 17 Years | 0 (0.0%) | 0 (0.0%) |
| 18 to 34 Years | 15 (0.5%) | 0 (0.0%) |
| 35 to 64 Years | 268 (3.9%) | 301 (4.3%) |
| 65 to 74 Years | 100 (6.8%) | 144 (9.1%) |
| 75 Years and over | 373 (27.8%) | 625 (31.3%) |
Disability Class: Self-Care Difficulty
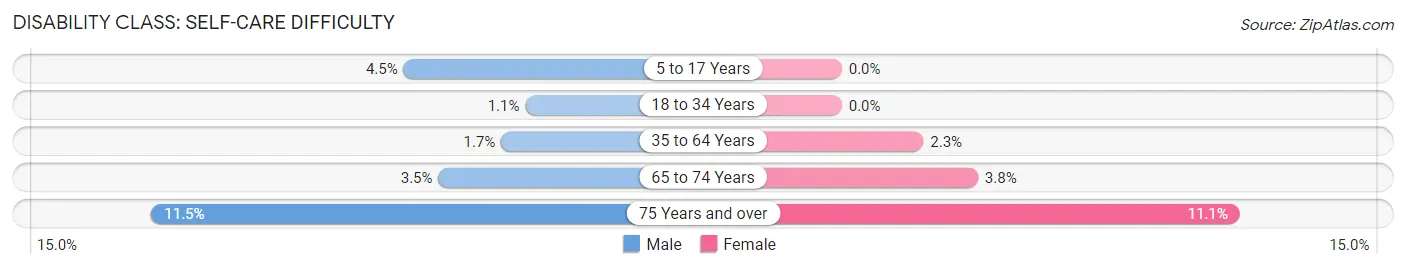
| Age Bracket | Male | Female |
| 5 to 17 Years | 132 (4.4%) | 0 (0.0%) |
| 18 to 34 Years | 35 (1.1%) | 0 (0.0%) |
| 35 to 64 Years | 120 (1.7%) | 157 (2.3%) |
| 65 to 74 Years | 51 (3.5%) | 60 (3.8%) |
| 75 Years and over | 154 (11.5%) | 221 (11.1%) |
Technology Access in San Juan Capistrano
Computing Device Access in San Juan Capistrano
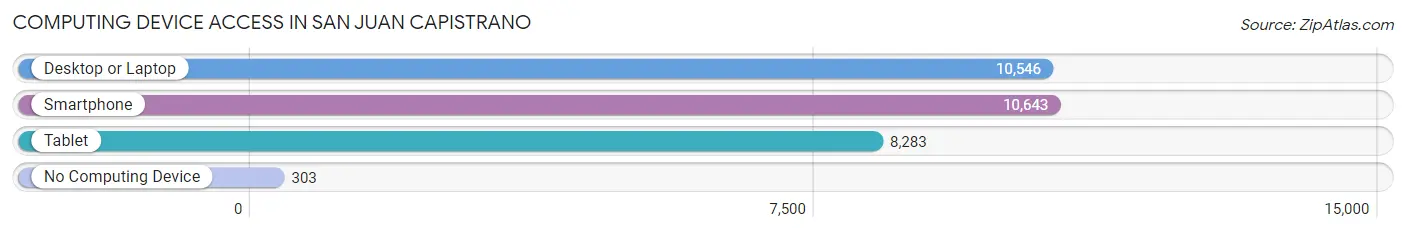
| Device Type | # Households | % Households |
| Desktop or Laptop | 10,546 | 89.6% |
| Smartphone | 10,643 | 90.4% |
| Tablet | 8,283 | 70.4% |
| No Computing Device | 303 | 2.6% |
| Total | 11,769 | 100.0% |
Internet Access in San Juan Capistrano
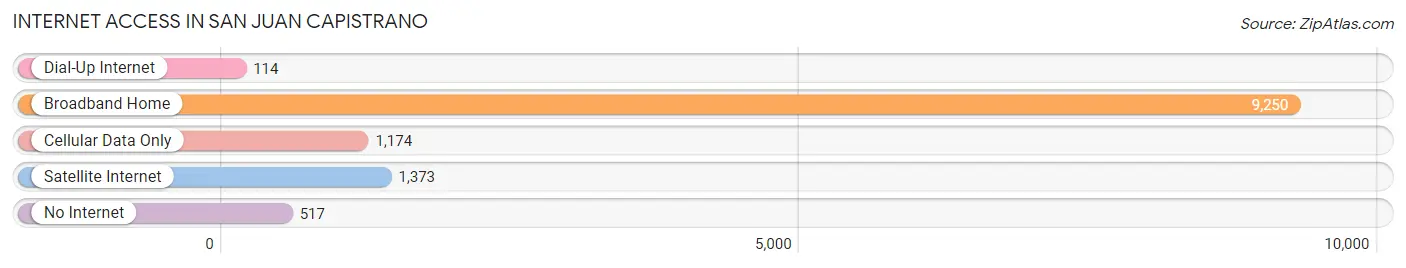
| Internet Type | # Households | % Households |
| Dial-Up Internet | 114 | 1.0% |
| Broadband Home | 9,250 | 78.6% |
| Cellular Data Only | 1,174 | 10.0% |
| Satellite Internet | 1,373 | 11.7% |
| No Internet | 517 | 4.4% |
| Total | 11,769 | 100.0% |
San Juan Capistrano Summary
San Juan Capistrano is a city located in Orange County, California. It is located about 35 miles south of Los Angeles and is part of the greater Los Angeles metropolitan area. The city is known for its historic Spanish mission, Mission San Juan Capistrano, which was founded in 1776. The city is also known for its annual Swallows Day Parade, which celebrates the return of the cliff swallows to the mission each year.
History
The area that is now San Juan Capistrano was originally inhabited by the Acjachemen Native American tribe. The first Europeans to explore the area were Spanish missionaries, who arrived in 1776 and established Mission San Juan Capistrano. The mission was named after Saint John of Capistrano, a 15th-century Italian Franciscan friar. The mission was the seventh of the 21 missions established in California by the Spanish.
The mission was a major center of activity in the area, and it served as a base for the Spanish colonization of California. The mission was also a major agricultural center, and it was the largest producer of wine in California. The mission was secularized in 1834, and the land was divided up and sold off.
In the late 19th century, the area began to develop as a small agricultural community. The city of San Juan Capistrano was officially incorporated in 1961.
Geography
San Juan Capistrano is located in southern Orange County, California. It is situated about 35 miles south of Los Angeles and is part of the greater Los Angeles metropolitan area. The city covers an area of about 11.2 square miles and has a population of about 35,000 people.
The city is located in a coastal region, and it is bordered by the cities of Dana Point to the north, San Clemente to the south, and San Juan Creek to the east. The city is located in a semi-arid climate zone, and it receives an average of about 12 inches of rain per year.
Economy
San Juan Capistrano is a primarily residential city, and the majority of its economy is based on tourism and services. The city is home to several tourist attractions, including the Mission San Juan Capistrano, the Los Rios Historic District, and the San Juan Capistrano Regional Park. The city is also home to several shopping centers and restaurants.
The city is also home to several businesses, including technology companies, medical offices, and financial services. The city is also home to several educational institutions, including Saddleback College and the University of California, Irvine.
Demographics
As of the 2010 census, San Juan Capistrano had a population of 34,593 people. The racial makeup of the city was 75.3% White, 1.3% African American, 0.5% Native American, 8.2% Asian, 0.2% Pacific Islander, 11.2% from other races, and 3.5% from two or more races. Hispanic or Latino of any race were 25.2% of the population.
The median household income in the city was $87,890, and the median family income was $103,890. The per capita income in the city was $41,945. About 5.2% of the population was below the poverty line.
San Juan Capistrano is a diverse city, and it is home to people of many different backgrounds and cultures. The city is home to a large Hispanic population, as well as a large Asian population. The city is also home to a large number of immigrants from Mexico, Central America, and South America.
Common Questions
What is Per Capita Income in San Juan Capistrano?
Per Capita income in San Juan Capistrano is $55,855.
What is the Median Family Income in San Juan Capistrano?
Median Family Income in San Juan Capistrano is $141,663.
What is the Median Household income in San Juan Capistrano?
Median Household Income in San Juan Capistrano is $123,474.
What is Income or Wage Gap in San Juan Capistrano?
Income or Wage Gap in San Juan Capistrano is 24.0%.
Women in San Juan Capistrano earn 76.0 cents for every dollar earned by a man.
What is Family Income Deficit in San Juan Capistrano?
Family Income Deficit in San Juan Capistrano is $13,453.
Families that are below poverty line in San Juan Capistrano earn $13,453 less on average than the poverty threshold level.
What is Inequality or Gini Index in San Juan Capistrano?
Inequality or Gini Index in San Juan Capistrano is 0.45.
What is the Total Population of San Juan Capistrano?
Total Population of San Juan Capistrano is 35,099.
What is the Total Male Population of San Juan Capistrano?
Total Male Population of San Juan Capistrano is 16,914.
What is the Total Female Population of San Juan Capistrano?
Total Female Population of San Juan Capistrano is 18,185.
What is the Ratio of Males per 100 Females in San Juan Capistrano?
There are 93.01 Males per 100 Females in San Juan Capistrano.
What is the Ratio of Females per 100 Males in San Juan Capistrano?
There are 107.51 Females per 100 Males in San Juan Capistrano.
What is the Median Population Age in San Juan Capistrano?
Median Population Age in San Juan Capistrano is 42.4 Years.
What is the Average Family Size in San Juan Capistrano
Average Family Size in San Juan Capistrano is 3.5 People.
What is the Average Household Size in San Juan Capistrano
Average Household Size in San Juan Capistrano is 3.0 People.
How Large is the Labor Force in San Juan Capistrano?
There are 17,983 People in the Labor Forcein in San Juan Capistrano.
What is the Percentage of People in the Labor Force in San Juan Capistrano?
63.8% of People are in the Labor Force in San Juan Capistrano.
What is the Unemployment Rate in San Juan Capistrano?
Unemployment Rate in San Juan Capistrano is 4.1%.