Cities with the Highest Percentage of Ethiopian Population in Minnesota
RELATED REPORTS & OPTIONS
Ethiopian
Minnesota
Compare Cities
Map of Cities with the Highest Percentage of Ethiopian Population in Minnesota
0.00%
6.00%
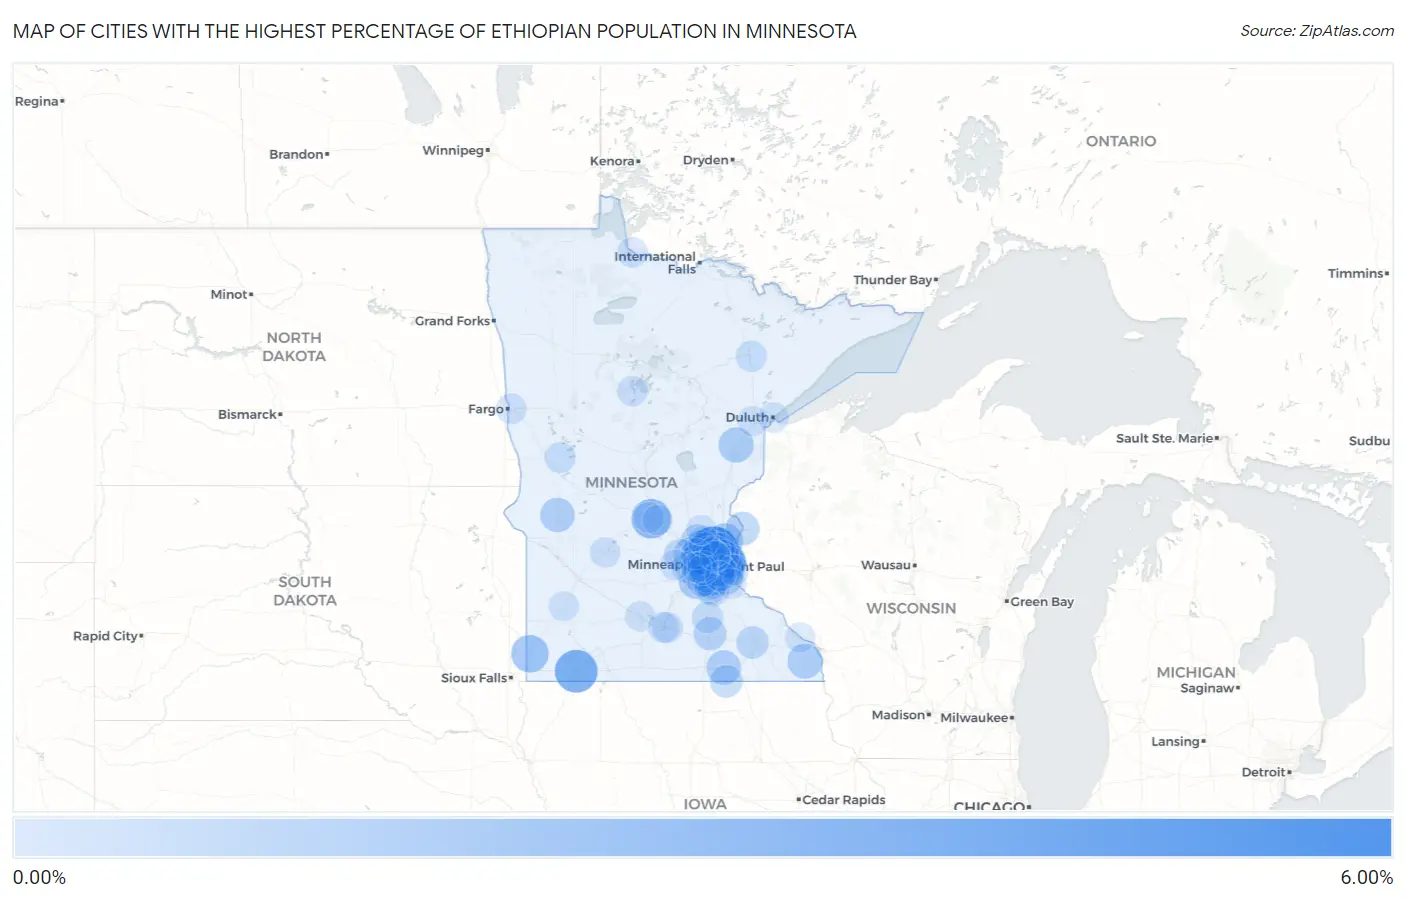
Cities with the Highest Percentage of Ethiopian Population in Minnesota
| City | Ethiopian | vs State | vs National | |
| 1. | Lexington | 5.15% | 0.47%(+4.68)#1 | 0.11%(+5.04)#24 |
| 2. | Worthington | 3.30% | 0.47%(+2.83)#2 | 0.11%(+3.20)#55 |
| 3. | Oakdale | 3.18% | 0.47%(+2.71)#3 | 0.11%(+3.07)#60 |
| 4. | Hilltop | 2.49% | 0.47%(+2.02)#4 | 0.11%(+2.38)#86 |
| 5. | Waite Park | 2.40% | 0.47%(+1.93)#5 | 0.11%(+2.29)#88 |
| 6. | Fridley | 2.10% | 0.47%(+1.62)#6 | 0.11%(+1.99)#103 |
| 7. | Birchwood Village | 2.06% | 0.47%(+1.59)#7 | 0.11%(+1.95)#107 |
| 8. | Columbia Heights | 1.88% | 0.47%(+1.41)#8 | 0.11%(+1.77)#114 |
| 9. | Jasper | 1.86% | 0.47%(+1.39)#9 | 0.11%(+1.76)#117 |
| 10. | Eagan | 1.85% | 0.47%(+1.38)#10 | 0.11%(+1.74)#118 |
| 11. | Brooklyn Park | 1.79% | 0.47%(+1.32)#11 | 0.11%(+1.68)#121 |
| 12. | Robbinsdale | 1.72% | 0.47%(+1.25)#12 | 0.11%(+1.62)#129 |
| 13. | Blaine | 1.60% | 0.47%(+1.13)#13 | 0.11%(+1.49)#136 |
| 14. | New Hope | 1.59% | 0.47%(+1.11)#14 | 0.11%(+1.48)#139 |
| 15. | St Paul | 1.50% | 0.47%(+1.03)#15 | 0.11%(+1.39)#145 |
| 16. | Forest Lake | 1.48% | 0.47%(+1.01)#16 | 0.11%(+1.38)#148 |
| 17. | Little Canada | 1.48% | 0.47%(+1.01)#17 | 0.11%(+1.37)#150 |
| 18. | Roseville | 1.44% | 0.47%(+0.973)#18 | 0.11%(+1.34)#156 |
| 19. | New Brighton | 1.43% | 0.47%(+0.959)#19 | 0.11%(+1.32)#158 |
| 20. | Brooklyn Center | 1.40% | 0.47%(+0.930)#20 | 0.11%(+1.29)#163 |
| 21. | Falcon Heights | 1.40% | 0.47%(+0.924)#21 | 0.11%(+1.29)#165 |
| 22. | North St Paul | 1.36% | 0.47%(+0.892)#22 | 0.11%(+1.26)#174 |
| 23. | Lauderdale | 1.30% | 0.47%(+0.832)#23 | 0.11%(+1.20)#183 |
| 24. | Shakopee | 1.30% | 0.47%(+0.829)#24 | 0.11%(+1.19)#185 |
| 25. | Moose Lake | 1.28% | 0.47%(+0.808)#25 | 0.11%(+1.17)#189 |
| 26. | Houston | 1.23% | 0.47%(+0.762)#26 | 0.11%(+1.13)#194 |
| 27. | St Anthony City Hennepin And Ramsey Counties | 1.13% | 0.47%(+0.654)#27 | 0.11%(+1.02)#212 |
| 28. | Morris | 1.12% | 0.47%(+0.647)#28 | 0.11%(+1.01)#214 |
| 29. | Austin | 1.09% | 0.47%(+0.622)#29 | 0.11%(+0.986)#220 |
| 30. | Woodbury | 1.07% | 0.47%(+0.595)#30 | 0.11%(+0.960)#226 |
| 31. | Maplewood | 1.01% | 0.47%(+0.540)#31 | 0.11%(+0.905)#237 |
| 32. | Champlin | 0.98% | 0.47%(+0.509)#32 | 0.11%(+0.873)#246 |
| 33. | Minneapolis | 0.92% | 0.47%(+0.449)#33 | 0.11%(+0.813)#258 |
| 34. | Taylors Falls | 0.90% | 0.47%(+0.431)#34 | 0.11%(+0.795)#264 |
| 35. | Cottage Grove | 0.89% | 0.47%(+0.415)#35 | 0.11%(+0.779)#269 |
| 36. | Lake Elmo | 0.89% | 0.47%(+0.414)#36 | 0.11%(+0.778)#270 |
| 37. | Ramsey | 0.83% | 0.47%(+0.357)#37 | 0.11%(+0.721)#283 |
| 38. | Burnsville | 0.81% | 0.47%(+0.342)#38 | 0.11%(+0.706)#287 |
| 39. | Apple Valley | 0.76% | 0.47%(+0.286)#39 | 0.11%(+0.650)#299 |
| 40. | Owatonna | 0.73% | 0.47%(+0.263)#40 | 0.11%(+0.628)#308 |
| 41. | Corcoran | 0.72% | 0.47%(+0.246)#41 | 0.11%(+0.610)#314 |
| 42. | White Bear Lake | 0.70% | 0.47%(+0.232)#42 | 0.11%(+0.596)#318 |
| 43. | West St Paul | 0.70% | 0.47%(+0.230)#43 | 0.11%(+0.594)#320 |
| 44. | Arden Hills | 0.69% | 0.47%(+0.222)#44 | 0.11%(+0.586)#323 |
| 45. | Lyle | 0.61% | 0.47%(+0.143)#45 | 0.11%(+0.507)#344 |
| 46. | Rochester | 0.61% | 0.47%(+0.136)#46 | 0.11%(+0.500)#354 |
| 47. | Richfield | 0.59% | 0.47%(+0.123)#47 | 0.11%(+0.488)#356 |
| 48. | Lino Lakes | 0.57% | 0.47%(+0.100)#48 | 0.11%(+0.464)#369 |
| 49. | Coon Rapids | 0.56% | 0.47%(+0.085)#49 | 0.11%(+0.449)#381 |
| 50. | Bloomington | 0.55% | 0.47%(+0.075)#50 | 0.11%(+0.440)#384 |
| 51. | Rockford | 0.52% | 0.47%(+0.046)#51 | 0.11%(+0.410)#402 |
| 52. | Spring Lake Park | 0.50% | 0.47%(+0.031)#52 | 0.11%(+0.395)#409 |
| 53. | Plymouth | 0.48% | 0.47%(+0.005)#53 | 0.11%(+0.369)#419 |
| 54. | South St Paul | 0.45% | 0.47%(-0.020)#54 | 0.11%(+0.344)#432 |
| 55. | Hopkins | 0.43% | 0.47%(-0.040)#55 | 0.11%(+0.325)#443 |
| 56. | Spring Park | 0.42% | 0.47%(-0.055)#56 | 0.11%(+0.310)#455 |
| 57. | Eden Prairie | 0.41% | 0.47%(-0.066)#57 | 0.11%(+0.298)#460 |
| 58. | Farmington | 0.39% | 0.47%(-0.080)#58 | 0.11%(+0.284)#470 |
| 59. | Golden Valley | 0.36% | 0.47%(-0.110)#59 | 0.11%(+0.254)#501 |
| 60. | Lakeville | 0.35% | 0.47%(-0.122)#60 | 0.11%(+0.242)#519 |
| 61. | Faribault | 0.35% | 0.47%(-0.123)#61 | 0.11%(+0.241)#522 |
| 62. | Crystal | 0.33% | 0.47%(-0.145)#62 | 0.11%(+0.219)#545 |
| 63. | Underwood | 0.24% | 0.47%(-0.233)#63 | 0.11%(+0.131)#656 |
| 64. | Virginia | 0.24% | 0.47%(-0.234)#64 | 0.11%(+0.130)#657 |
| 65. | Mankato | 0.20% | 0.47%(-0.271)#65 | 0.11%(+0.093)#729 |
| 66. | North Mankato | 0.20% | 0.47%(-0.275)#66 | 0.11%(+0.089)#736 |
| 67. | Savage | 0.19% | 0.47%(-0.280)#67 | 0.11%(+0.084)#751 |
| 68. | Mounds View | 0.18% | 0.47%(-0.288)#68 | 0.11%(+0.076)#767 |
| 69. | Circle Pines | 0.18% | 0.47%(-0.291)#69 | 0.11%(+0.073)#773 |
| 70. | Maple Grove | 0.17% | 0.47%(-0.305)#70 | 0.11%(+0.060)#799 |
| 71. | St Louis Park | 0.15% | 0.47%(-0.318)#71 | 0.11%(+0.046)#831 |
| 72. | St Joseph | 0.13% | 0.47%(-0.344)#72 | 0.11%(+0.020)#907 |
| 73. | Andover | 0.11% | 0.47%(-0.361)#73 | 0.11%(+0.003)#963 |
| 74. | Walker | 0.11% | 0.47%(-0.365)#74 | 0.11%(-0.001)#973 |
| 75. | Afton | 0.10% | 0.47%(-0.370)#75 | 0.11%(-0.006)#993 |
| 76. | Baudette | 0.089% | 0.47%(-0.383)#76 | 0.11%(-0.019)#1,042 |
| 77. | Moorhead | 0.074% | 0.47%(-0.397)#77 | 0.11%(-0.033)#1,105 |
| 78. | Watertown | 0.064% | 0.47%(-0.408)#78 | 0.11%(-0.044)#1,142 |
| 79. | Willmar | 0.062% | 0.47%(-0.410)#79 | 0.11%(-0.045)#1,158 |
| 80. | Edina | 0.053% | 0.47%(-0.419)#80 | 0.11%(-0.054)#1,207 |
| 81. | St Cloud | 0.045% | 0.47%(-0.427)#81 | 0.11%(-0.062)#1,259 |
| 82. | Shoreview | 0.045% | 0.47%(-0.427)#82 | 0.11%(-0.063)#1,261 |
| 83. | Duluth | 0.044% | 0.47%(-0.428)#83 | 0.11%(-0.063)#1,269 |
| 84. | New Ulm | 0.043% | 0.47%(-0.429)#84 | 0.11%(-0.065)#1,274 |
| 85. | Cloquet | 0.032% | 0.47%(-0.440)#85 | 0.11%(-0.075)#1,351 |
| 86. | Minnetonka | 0.032% | 0.47%(-0.440)#86 | 0.11%(-0.076)#1,353 |
| 87. | St Francis | 0.024% | 0.47%(-0.447)#87 | 0.11%(-0.083)#1,414 |
| 88. | Hastings | 0.023% | 0.47%(-0.449)#88 | 0.11%(-0.085)#1,428 |
| 89. | Marshall | 0.022% | 0.47%(-0.450)#89 | 0.11%(-0.085)#1,435 |
| 90. | Inver Grove Heights | 0.0056% | 0.47%(-0.466)#90 | 0.11%(-0.102)#1,595 |
| 91. | Winona | 0.0038% | 0.47%(-0.468)#91 | 0.11%(-0.103)#1,610 |
Common Questions
What are the Top 10 Cities with the Highest Percentage of Ethiopian Population in Minnesota?
Top 10 Cities with the Highest Percentage of Ethiopian Population in Minnesota are:
#1
5.15%
#2
3.30%
#3
3.18%
#4
2.49%
#5
2.40%
#6
2.10%
#7
2.06%
#8
1.88%
#9
1.86%
#10
1.85%
What city has the Highest Percentage of Ethiopian Population in Minnesota?
Lexington has the Highest Percentage of Ethiopian Population in Minnesota with 5.15%.
What is the Percentage of Ethiopian Population in the State of Minnesota?
Percentage of Ethiopian Population in Minnesota is 0.47%.
What is the Percentage of Ethiopian Population in the United States?
Percentage of Ethiopian Population in the United States is 0.11%.