Cities with the Highest Percentage of Ethiopian Population in Maryland
RELATED REPORTS & OPTIONS
Ethiopian
Maryland
Compare Cities
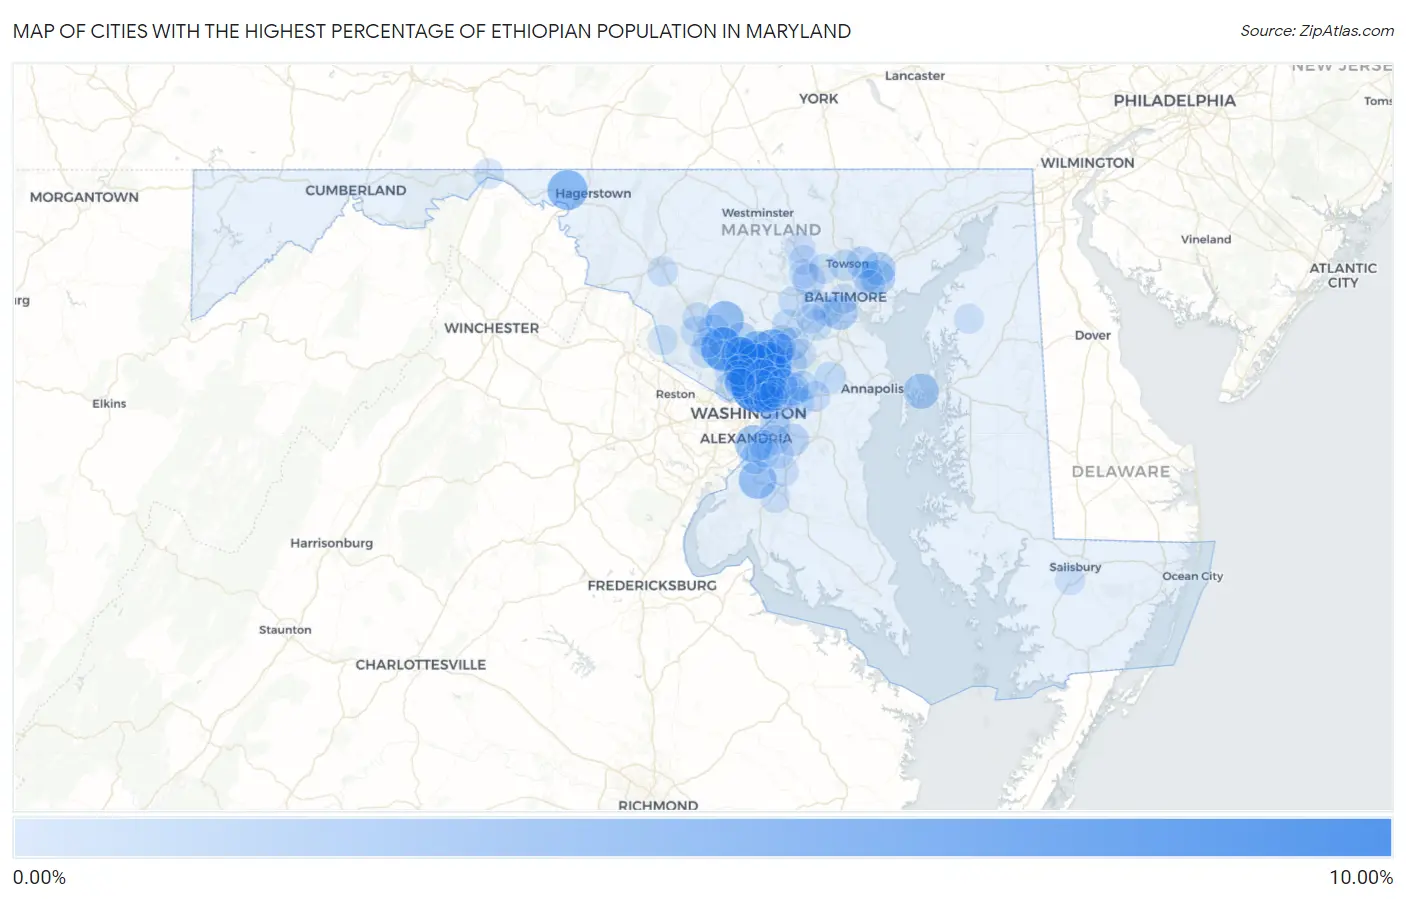
Map of Cities with the Highest Percentage of Ethiopian Population in Maryland
0.00%
10.00%
Cities with the Highest Percentage of Ethiopian Population in Maryland
| City | Ethiopian | vs State | vs National | |
| 1. | White Oak | 9.88% | 0.62%(+9.27)#1 | 0.11%(+9.78)#6 |
| 2. | Takoma Park | 9.76% | 0.62%(+9.14)#2 | 0.11%(+9.65)#7 |
| 3. | Calverton | 7.74% | 0.62%(+7.12)#3 | 0.11%(+7.63)#10 |
| 4. | Silver Spring | 7.27% | 0.62%(+6.65)#4 | 0.11%(+7.16)#12 |
| 5. | Kemp Mill | 6.71% | 0.62%(+6.09)#5 | 0.11%(+6.60)#14 |
| 6. | Derwood | 6.38% | 0.62%(+5.76)#6 | 0.11%(+6.27)#15 |
| 7. | Burtonsville | 5.72% | 0.62%(+5.10)#7 | 0.11%(+5.61)#19 |
| 8. | Chillum | 5.34% | 0.62%(+4.72)#8 | 0.11%(+5.23)#23 |
| 9. | Wilson Conococheague | 5.02% | 0.62%(+4.40)#9 | 0.11%(+4.91)#26 |
| 10. | Wheaton | 4.79% | 0.62%(+4.17)#10 | 0.11%(+4.68)#28 |
| 11. | Glenmont | 4.68% | 0.62%(+4.06)#11 | 0.11%(+4.57)#30 |
| 12. | Burnt Mills | 4.32% | 0.62%(+3.70)#12 | 0.11%(+4.21)#37 |
| 13. | Laytonsville | 3.94% | 0.62%(+3.32)#13 | 0.11%(+3.83)#42 |
| 14. | Cloverly | 3.85% | 0.62%(+3.23)#14 | 0.11%(+3.74)#44 |
| 15. | Accokeek | 3.84% | 0.62%(+3.23)#15 | 0.11%(+3.74)#45 |
| 16. | National Harbor | 3.73% | 0.62%(+3.11)#16 | 0.11%(+3.62)#46 |
| 17. | Adelphi | 3.45% | 0.62%(+2.83)#17 | 0.11%(+3.35)#50 |
| 18. | Fairland | 3.37% | 0.62%(+2.75)#18 | 0.11%(+3.26)#51 |
| 19. | Green Valley | 3.18% | 0.62%(+2.56)#19 | 0.11%(+3.07)#59 |
| 20. | Aspen Hill | 3.10% | 0.62%(+2.48)#20 | 0.11%(+2.99)#62 |
| 21. | Layhill | 3.06% | 0.62%(+2.45)#21 | 0.11%(+2.96)#63 |
| 22. | Chester | 2.65% | 0.62%(+2.03)#22 | 0.11%(+2.54)#80 |
| 23. | Colesville | 2.51% | 0.62%(+1.89)#23 | 0.11%(+2.40)#84 |
| 24. | Baltimore Highlands | 2.38% | 0.62%(+1.76)#24 | 0.11%(+2.27)#90 |
| 25. | Forest Glen | 2.32% | 0.62%(+1.70)#25 | 0.11%(+2.21)#93 |
| 26. | Rossville | 2.30% | 0.62%(+1.68)#26 | 0.11%(+2.19)#95 |
| 27. | Four Corners | 1.84% | 0.62%(+1.22)#27 | 0.11%(+1.73)#119 |
| 28. | White Marsh | 1.76% | 0.62%(+1.14)#28 | 0.11%(+1.65)#126 |
| 29. | Hyattsville | 1.58% | 0.62%(+0.960)#29 | 0.11%(+1.47)#141 |
| 30. | Seabrook | 1.52% | 0.62%(+0.905)#30 | 0.11%(+1.42)#143 |
| 31. | Olney | 1.52% | 0.62%(+0.902)#31 | 0.11%(+1.41)#144 |
| 32. | Melwood | 1.45% | 0.62%(+0.837)#32 | 0.11%(+1.35)#152 |
| 33. | Milford Mill | 1.39% | 0.62%(+0.775)#33 | 0.11%(+1.29)#166 |
| 34. | North Laurel | 1.30% | 0.62%(+0.685)#34 | 0.11%(+1.20)#184 |
| 35. | Carney | 1.21% | 0.62%(+0.592)#35 | 0.11%(+1.10)#199 |
| 36. | Colmar Manor | 1.19% | 0.62%(+0.570)#36 | 0.11%(+1.08)#203 |
| 37. | New Carrollton | 1.12% | 0.62%(+0.502)#37 | 0.11%(+1.01)#213 |
| 38. | Beltsville | 0.95% | 0.62%(+0.336)#38 | 0.11%(+0.847)#248 |
| 39. | South Laurel | 0.93% | 0.62%(+0.314)#39 | 0.11%(+0.825)#256 |
| 40. | Crofton | 0.87% | 0.62%(+0.251)#40 | 0.11%(+0.761)#274 |
| 41. | Overlea | 0.84% | 0.62%(+0.226)#41 | 0.11%(+0.737)#281 |
| 42. | North Bethesda | 0.84% | 0.62%(+0.224)#42 | 0.11%(+0.735)#282 |
| 43. | Hillandale | 0.82% | 0.62%(+0.202)#43 | 0.11%(+0.712)#285 |
| 44. | Columbia | 0.81% | 0.62%(+0.193)#44 | 0.11%(+0.703)#288 |
| 45. | Montgomery Village | 0.79% | 0.62%(+0.168)#45 | 0.11%(+0.678)#290 |
| 46. | Rockville | 0.78% | 0.62%(+0.163)#46 | 0.11%(+0.673)#291 |
| 47. | Leisure World | 0.78% | 0.62%(+0.162)#47 | 0.11%(+0.673)#292 |
| 48. | Towson | 0.75% | 0.62%(+0.134)#48 | 0.11%(+0.644)#301 |
| 49. | South Kensington | 0.69% | 0.62%(+0.075)#49 | 0.11%(+0.586)#324 |
| 50. | Elkridge | 0.69% | 0.62%(+0.067)#50 | 0.11%(+0.578)#329 |
| 51. | Lanham | 0.68% | 0.62%(+0.060)#51 | 0.11%(+0.570)#332 |
| 52. | Mitchellville | 0.67% | 0.62%(+0.051)#52 | 0.11%(+0.562)#333 |
| 53. | College Park | 0.64% | 0.62%(+0.024)#53 | 0.11%(+0.535)#339 |
| 54. | Glenn Dale | 0.62% | 0.62%(+0.005)#54 | 0.11%(+0.516)#342 |
| 55. | Bethesda | 0.61% | 0.62%(-0.010)#55 | 0.11%(+0.500)#353 |
| 56. | Redland | 0.59% | 0.62%(-0.024)#56 | 0.11%(+0.487)#357 |
| 57. | North Chevy Chase | 0.59% | 0.62%(-0.030)#57 | 0.11%(+0.480)#360 |
| 58. | North Potomac | 0.58% | 0.62%(-0.039)#58 | 0.11%(+0.472)#362 |
| 59. | Fort Washington | 0.58% | 0.62%(-0.041)#59 | 0.11%(+0.470)#364 |
| 60. | Germantown | 0.58% | 0.62%(-0.041)#60 | 0.11%(+0.469)#365 |
| 61. | Edmonston | 0.57% | 0.62%(-0.047)#61 | 0.11%(+0.464)#370 |
| 62. | Suitland | 0.51% | 0.62%(-0.103)#62 | 0.11%(+0.407)#404 |
| 63. | Ellicott City | 0.50% | 0.62%(-0.118)#63 | 0.11%(+0.393)#410 |
| 64. | Bowie | 0.45% | 0.62%(-0.167)#64 | 0.11%(+0.343)#433 |
| 65. | Catonsville | 0.45% | 0.62%(-0.169)#65 | 0.11%(+0.342)#434 |
| 66. | North Kensington | 0.45% | 0.62%(-0.169)#66 | 0.11%(+0.341)#435 |
| 67. | Mount Rainier | 0.42% | 0.62%(-0.194)#67 | 0.11%(+0.316)#452 |
| 68. | Arbutus | 0.42% | 0.62%(-0.201)#68 | 0.11%(+0.310)#454 |
| 69. | Chevy Chase | 0.41% | 0.62%(-0.209)#69 | 0.11%(+0.301)#458 |
| 70. | Honeygo | 0.40% | 0.62%(-0.219)#70 | 0.11%(+0.291)#465 |
| 71. | Hancock | 0.38% | 0.62%(-0.239)#71 | 0.11%(+0.272)#480 |
| 72. | Waldorf | 0.36% | 0.62%(-0.261)#72 | 0.11%(+0.249)#509 |
| 73. | Ballenger Creek | 0.35% | 0.62%(-0.268)#73 | 0.11%(+0.242)#518 |
| 74. | Langley Park | 0.35% | 0.62%(-0.269)#74 | 0.11%(+0.242)#520 |
| 75. | Gaithersburg | 0.34% | 0.62%(-0.280)#75 | 0.11%(+0.230)#529 |
| 76. | Reisterstown | 0.33% | 0.62%(-0.285)#76 | 0.11%(+0.226)#533 |
| 77. | Flower Hill | 0.33% | 0.62%(-0.290)#77 | 0.11%(+0.221)#541 |
| 78. | Brandywine | 0.33% | 0.62%(-0.291)#78 | 0.11%(+0.220)#544 |
| 79. | Greenbelt | 0.29% | 0.62%(-0.326)#79 | 0.11%(+0.185)#581 |
| 80. | Scaggsville | 0.29% | 0.62%(-0.331)#80 | 0.11%(+0.180)#590 |
| 81. | Coral Hills | 0.27% | 0.62%(-0.352)#81 | 0.11%(+0.158)#618 |
| 82. | Clarksburg | 0.26% | 0.62%(-0.353)#82 | 0.11%(+0.157)#619 |
| 83. | North Brentwood | 0.26% | 0.62%(-0.357)#83 | 0.11%(+0.154)#625 |
| 84. | Poolesville | 0.25% | 0.62%(-0.372)#84 | 0.11%(+0.139)#638 |
| 85. | Rosedale | 0.24% | 0.62%(-0.373)#85 | 0.11%(+0.137)#642 |
| 86. | Camp Springs | 0.24% | 0.62%(-0.381)#86 | 0.11%(+0.129)#659 |
| 87. | Clinton | 0.23% | 0.62%(-0.389)#87 | 0.11%(+0.121)#672 |
| 88. | Baltimore | 0.22% | 0.62%(-0.398)#88 | 0.11%(+0.113)#690 |
| 89. | Oxon Hill | 0.22% | 0.62%(-0.402)#89 | 0.11%(+0.109)#701 |
| 90. | Woodlawn Cdp Baltimore County | 0.21% | 0.62%(-0.407)#90 | 0.11%(+0.103)#714 |
| 91. | Owings Mills | 0.20% | 0.62%(-0.415)#91 | 0.11%(+0.096)#726 |
| 92. | Friendly | 0.20% | 0.62%(-0.420)#92 | 0.11%(+0.090)#733 |
| 93. | Ilchester | 0.19% | 0.62%(-0.424)#93 | 0.11%(+0.087)#741 |
| 94. | Maryland City | 0.19% | 0.62%(-0.427)#94 | 0.11%(+0.084)#753 |
| 95. | Chestertown | 0.18% | 0.62%(-0.437)#95 | 0.11%(+0.074)#771 |
| 96. | Riverdale Park | 0.16% | 0.62%(-0.453)#96 | 0.11%(+0.057)#805 |
| 97. | Fruitland | 0.16% | 0.62%(-0.457)#97 | 0.11%(+0.053)#814 |
| 98. | Randallstown | 0.15% | 0.62%(-0.466)#98 | 0.11%(+0.045)#837 |
| 99. | Pikesville | 0.14% | 0.62%(-0.474)#99 | 0.11%(+0.036)#855 |
| 100. | West Laurel | 0.14% | 0.62%(-0.479)#100 | 0.11%(+0.031)#876 |
Common Questions
What are the Top 10 Cities with the Highest Percentage of Ethiopian Population in Maryland?
Top 10 Cities with the Highest Percentage of Ethiopian Population in Maryland are:
#1
9.88%
#2
9.76%
#3
7.74%
#4
7.27%
#5
6.71%
#6
6.38%
#7
5.72%
#8
5.34%
#9
5.02%
#10
4.79%
What city has the Highest Percentage of Ethiopian Population in Maryland?
White Oak has the Highest Percentage of Ethiopian Population in Maryland with 9.88%.
What is the Percentage of Ethiopian Population in the State of Maryland?
Percentage of Ethiopian Population in Maryland is 0.62%.
What is the Percentage of Ethiopian Population in the United States?
Percentage of Ethiopian Population in the United States is 0.11%.