Cities with the Highest Percentage of Ethiopian Population in Michigan
RELATED REPORTS & OPTIONS
Ethiopian
Michigan
Compare Cities
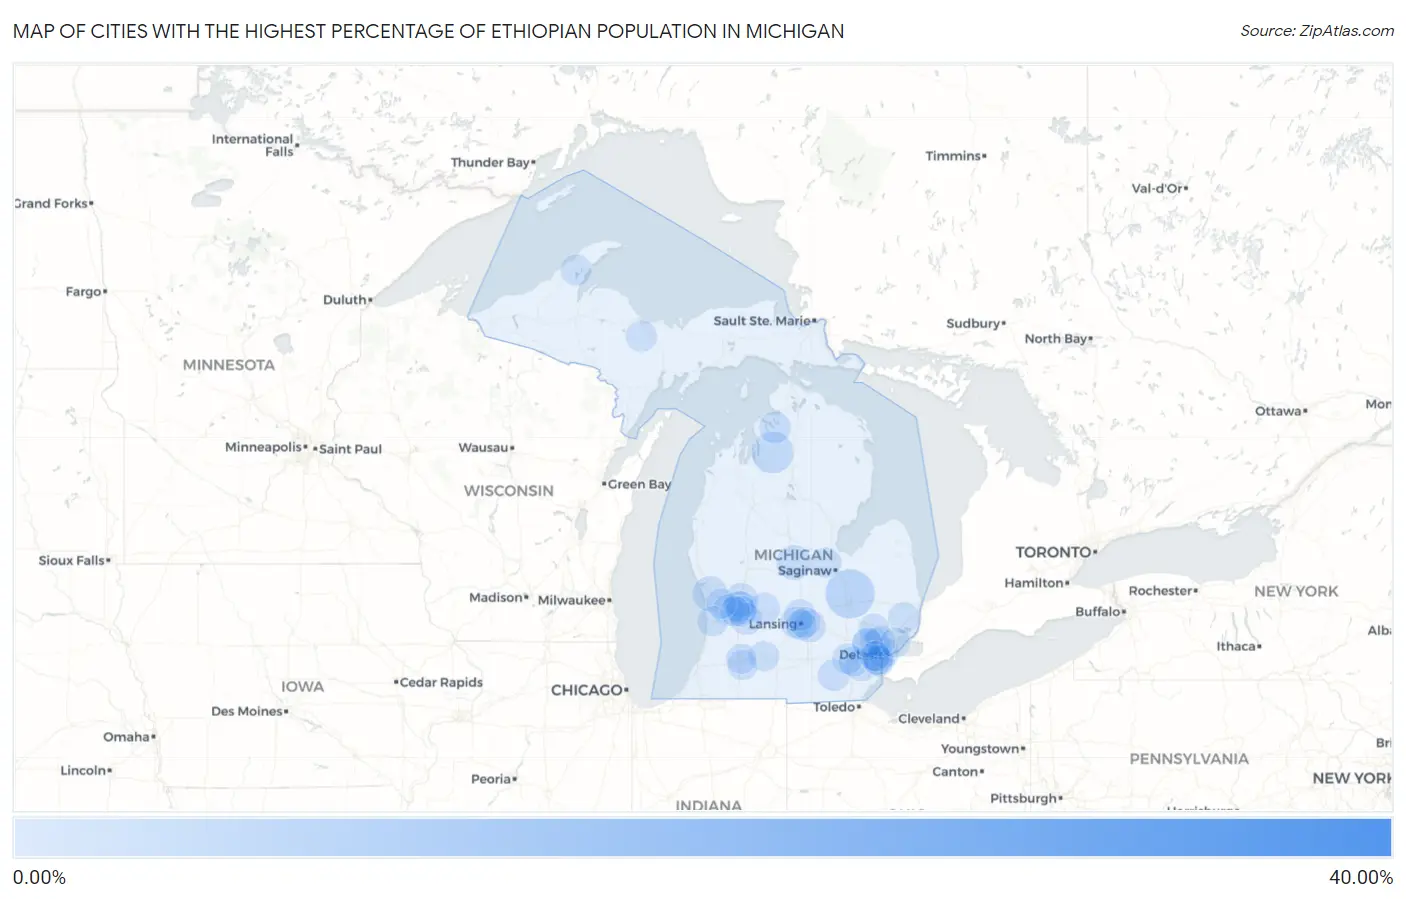
Map of Cities with the Highest Percentage of Ethiopian Population in Michigan
0.00%
40.00%
Cities with the Highest Percentage of Ethiopian Population in Michigan
| City | Ethiopian | vs State | vs National | |
| 1. | Scotts | 32.97% | 0.029%(+32.9)#1 | 0.11%(+32.9)#1 |
| 2. | Mount Morris | 3.62% | 0.029%(+3.59)#2 | 0.11%(+3.52)#47 |
| 3. | Mancelona | 2.22% | 0.029%(+2.19)#3 | 0.11%(+2.11)#98 |
| 4. | Fruitport | 0.94% | 0.029%(+0.908)#4 | 0.11%(+0.829)#254 |
| 5. | Shepherd | 0.85% | 0.029%(+0.819)#5 | 0.11%(+0.741)#280 |
| 6. | Northview | 0.67% | 0.029%(+0.639)#6 | 0.11%(+0.560)#334 |
| 7. | Belleville | 0.43% | 0.029%(+0.398)#7 | 0.11%(+0.320)#449 |
| 8. | East Grand Rapids | 0.37% | 0.029%(+0.340)#8 | 0.11%(+0.262)#490 |
| 9. | Saranac | 0.36% | 0.029%(+0.331)#9 | 0.11%(+0.252)#503 |
| 10. | Caledonia | 0.33% | 0.029%(+0.303)#10 | 0.11%(+0.225)#534 |
| 11. | Okemos | 0.33% | 0.029%(+0.300)#11 | 0.11%(+0.222)#539 |
| 12. | Boyne City | 0.31% | 0.029%(+0.285)#12 | 0.11%(+0.207)#554 |
| 13. | Clinton | 0.31% | 0.029%(+0.278)#13 | 0.11%(+0.200)#561 |
| 14. | Waverly | 0.28% | 0.029%(+0.253)#14 | 0.11%(+0.175)#593 |
| 15. | Dewitt | 0.27% | 0.029%(+0.243)#15 | 0.11%(+0.165)#611 |
| 16. | Jenison | 0.26% | 0.029%(+0.231)#16 | 0.11%(+0.153)#628 |
| 17. | K I Sawyer | 0.21% | 0.029%(+0.183)#17 | 0.11%(+0.105)#712 |
| 18. | Richmond | 0.19% | 0.029%(+0.159)#18 | 0.11%(+0.081)#761 |
| 19. | Grand Rapids | 0.18% | 0.029%(+0.152)#19 | 0.11%(+0.074)#769 |
| 20. | East Lansing | 0.17% | 0.029%(+0.145)#20 | 0.11%(+0.067)#784 |
| 21. | Dollar Bay | 0.17% | 0.029%(+0.140)#21 | 0.11%(+0.062)#793 |
| 22. | Melvindale | 0.17% | 0.029%(+0.137)#22 | 0.11%(+0.059)#801 |
| 23. | Dearborn | 0.14% | 0.029%(+0.110)#23 | 0.11%(+0.032)#873 |
| 24. | Lansing | 0.13% | 0.029%(+0.099)#24 | 0.11%(+0.020)#906 |
| 25. | Kentwood | 0.12% | 0.029%(+0.088)#25 | 0.11%(+0.009)#946 |
| 26. | Farmington | 0.087% | 0.029%(+0.058)#26 | 0.11%(-0.020)#1,049 |
| 27. | Ann Arbor | 0.086% | 0.029%(+0.057)#27 | 0.11%(-0.021)#1,056 |
| 28. | Freeland | 0.068% | 0.029%(+0.039)#28 | 0.11%(-0.039)#1,128 |
| 29. | Southfield | 0.064% | 0.029%(+0.035)#29 | 0.11%(-0.043)#1,136 |
| 30. | Detroit | 0.062% | 0.029%(+0.033)#30 | 0.11%(-0.045)#1,153 |
| 31. | Holland | 0.061% | 0.029%(+0.032)#31 | 0.11%(-0.046)#1,161 |
| 32. | Battle Creek | 0.046% | 0.029%(+0.017)#32 | 0.11%(-0.062)#1,254 |
| 33. | Portage | 0.045% | 0.029%(+0.016)#33 | 0.11%(-0.062)#1,260 |
| 34. | Ypsilanti | 0.040% | 0.029%(+0.011)#34 | 0.11%(-0.068)#1,288 |
| 35. | Wyoming | 0.038% | 0.029%(+0.009)#35 | 0.11%(-0.069)#1,299 |
| 36. | Lincoln Park | 0.033% | 0.029%(+0.004)#36 | 0.11%(-0.075)#1,340 |
| 37. | Allendale | 0.024% | 0.029%(-0.005)#37 | 0.11%(-0.083)#1,419 |
| 38. | Allen Park | 0.021% | 0.029%(-0.008)#38 | 0.11%(-0.086)#1,448 |
| 39. | Royal Oak | 0.019% | 0.029%(-0.010)#39 | 0.11%(-0.088)#1,459 |
| 40. | Auburn Hills | 0.016% | 0.029%(-0.013)#40 | 0.11%(-0.091)#1,486 |
| 41. | Farmington Hills | 0.016% | 0.029%(-0.013)#41 | 0.11%(-0.092)#1,495 |
| 42. | Dearborn Heights | 0.014% | 0.029%(-0.015)#42 | 0.11%(-0.093)#1,508 |
| 43. | St Clair Shores | 0.0085% | 0.029%(-0.020)#43 | 0.11%(-0.099)#1,573 |
| 44. | Kalamazoo | 0.0068% | 0.029%(-0.022)#44 | 0.11%(-0.100)#1,587 |
Common Questions
What are the Top 10 Cities with the Highest Percentage of Ethiopian Population in Michigan?
Top 10 Cities with the Highest Percentage of Ethiopian Population in Michigan are:
#1
3.62%
#2
2.22%
#3
0.94%
#4
0.85%
#5
0.67%
#6
0.43%
#7
0.37%
#8
0.36%
#9
0.33%
#10
0.33%
What city has the Highest Percentage of Ethiopian Population in Michigan?
Mount Morris has the Highest Percentage of Ethiopian Population in Michigan with 3.62%.
What is the Percentage of Ethiopian Population in the State of Michigan?
Percentage of Ethiopian Population in Michigan is 0.029%.
What is the Percentage of Ethiopian Population in the United States?
Percentage of Ethiopian Population in the United States is 0.11%.