Cities with the Highest Percentage of Ethiopian Population in Massachusetts
RELATED REPORTS & OPTIONS
Ethiopian
Massachusetts
Compare Cities
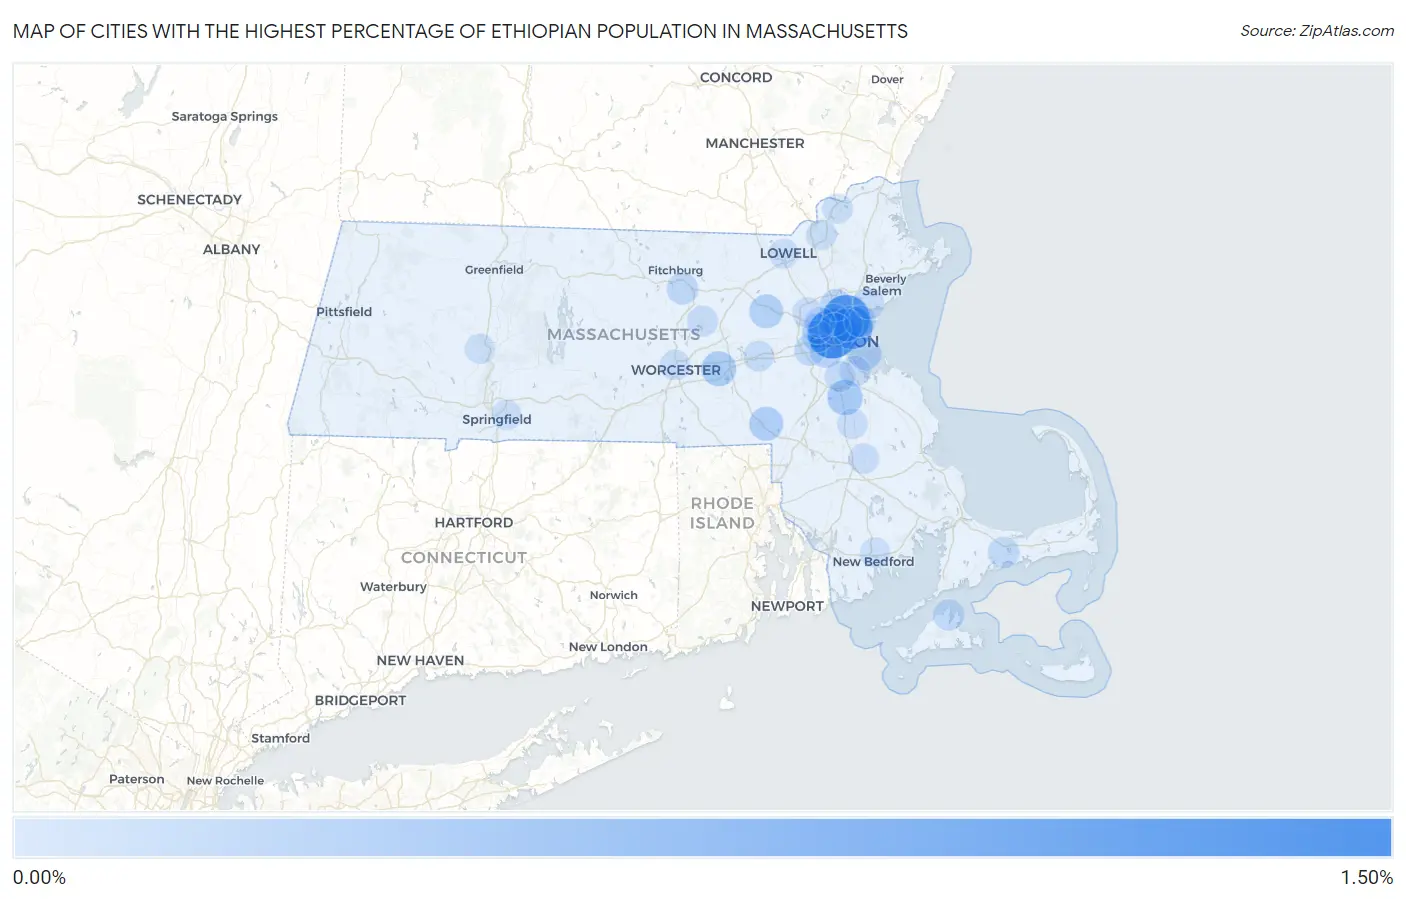
Map of Cities with the Highest Percentage of Ethiopian Population in Massachusetts
0.00%
1.50%
Cities with the Highest Percentage of Ethiopian Population in Massachusetts
| City | Ethiopian | vs State | vs National | |
| 1. | Cambridge | 1.45% | 0.087%(+1.36)#1 | 0.11%(+1.34)#154 |
| 2. | Malden | 1.29% | 0.087%(+1.20)#2 | 0.11%(+1.18)#187 |
| 3. | Chelsea | 0.95% | 0.087%(+0.866)#3 | 0.11%(+0.845)#250 |
| 4. | Randolph Town | 0.37% | 0.087%(+0.288)#4 | 0.11%(+0.267)#486 |
| 5. | Westborough | 0.34% | 0.087%(+0.256)#5 | 0.11%(+0.235)#526 |
| 6. | Franklin Town | 0.28% | 0.087%(+0.194)#6 | 0.11%(+0.173)#599 |
| 7. | West Concord | 0.26% | 0.087%(+0.177)#7 | 0.11%(+0.156)#621 |
| 8. | Boston | 0.22% | 0.087%(+0.129)#8 | 0.11%(+0.109)#700 |
| 9. | Brookline | 0.20% | 0.087%(+0.117)#9 | 0.11%(+0.097)#721 |
| 10. | Everett | 0.18% | 0.087%(+0.094)#10 | 0.11%(+0.073)#772 |
| 11. | Medford | 0.17% | 0.087%(+0.078)#11 | 0.11%(+0.058)#803 |
| 12. | Stoneham | 0.15% | 0.087%(+0.065)#12 | 0.11%(+0.045)#836 |
| 13. | Somerville | 0.12% | 0.087%(+0.031)#13 | 0.11%(+0.011)#939 |
| 14. | Leominster | 0.11% | 0.087%(+0.028)#14 | 0.11%(+0.007)#952 |
| 15. | Newton | 0.11% | 0.087%(+0.020)#15 | 0.11%(-0.001)#975 |
| 16. | Watertown Town | 0.11% | 0.087%(+0.018)#16 | 0.11%(-0.002)#981 |
| 17. | Barnstable Town | 0.10% | 0.087%(+0.017)#17 | 0.11%(-0.003)#985 |
| 18. | Revere | 0.10% | 0.087%(+0.017)#18 | 0.11%(-0.003)#986 |
| 19. | Vineyard Haven | 0.084% | 0.087%(-0.002)#19 | 0.11%(-0.023)#1,060 |
| 20. | Lynn | 0.061% | 0.087%(-0.026)#20 | 0.11%(-0.047)#1,165 |
| 21. | Quincy | 0.057% | 0.087%(-0.029)#21 | 0.11%(-0.050)#1,182 |
| 22. | Clinton | 0.054% | 0.087%(-0.032)#22 | 0.11%(-0.053)#1,197 |
| 23. | Milton | 0.053% | 0.087%(-0.034)#23 | 0.11%(-0.055)#1,208 |
| 24. | Amherst | 0.042% | 0.087%(-0.045)#24 | 0.11%(-0.065)#1,278 |
| 25. | Belmont | 0.041% | 0.087%(-0.046)#25 | 0.11%(-0.067)#1,283 |
| 26. | Framingham | 0.039% | 0.087%(-0.048)#26 | 0.11%(-0.068)#1,293 |
| 27. | Worcester | 0.036% | 0.087%(-0.051)#27 | 0.11%(-0.072)#1,315 |
| 28. | Arlington | 0.035% | 0.087%(-0.052)#28 | 0.11%(-0.072)#1,322 |
| 29. | Bridgewater Town | 0.028% | 0.087%(-0.059)#29 | 0.11%(-0.079)#1,379 |
| 30. | Brockton | 0.026% | 0.087%(-0.061)#30 | 0.11%(-0.081)#1,402 |
| 31. | Lexington | 0.023% | 0.087%(-0.063)#31 | 0.11%(-0.084)#1,422 |
| 32. | Lawrence | 0.016% | 0.087%(-0.071)#32 | 0.11%(-0.091)#1,487 |
| 33. | Haverhill | 0.015% | 0.087%(-0.072)#33 | 0.11%(-0.092)#1,501 |
| 34. | Springfield | 0.013% | 0.087%(-0.074)#34 | 0.11%(-0.094)#1,532 |
| 35. | New Bedford | 0.011% | 0.087%(-0.076)#35 | 0.11%(-0.096)#1,553 |
| 36. | Northampton | 0.0071% | 0.087%(-0.080)#36 | 0.11%(-0.100)#1,586 |
| 37. | Lowell | 0.00087% | 0.087%(-0.086)#37 | 0.11%(-0.106)#1,627 |
Common Questions
What are the Top 10 Cities with the Highest Percentage of Ethiopian Population in Massachusetts?
Top 10 Cities with the Highest Percentage of Ethiopian Population in Massachusetts are:
#1
1.45%
#2
1.29%
#3
0.95%
#4
0.37%
#5
0.34%
#6
0.28%
#7
0.26%
#8
0.22%
#9
0.20%
#10
0.18%
What city has the Highest Percentage of Ethiopian Population in Massachusetts?
Cambridge has the Highest Percentage of Ethiopian Population in Massachusetts with 1.45%.
What is the Percentage of Ethiopian Population in the State of Massachusetts?
Percentage of Ethiopian Population in Massachusetts is 0.087%.
What is the Percentage of Ethiopian Population in the United States?
Percentage of Ethiopian Population in the United States is 0.11%.